drawing support resistance but easier I'm going to get right into the video I know there's a million reasons you could click off this video right now so let me just hold your attention here by just keeping it real simple so I have traded for seven years and I draw support resistance zones where it looks like price is clearly bouncing throughout the past seven years I've made millions of dollars trading Forex crypto and stocks just using support resistance it's like not that complicated for me at least so here's what I do anywhere where prices had clear
bounces over and over I draw the zones just like at those locations so that's the first thing I do is I just make sure that there's it's a place where prices bounce very clearly over and over I do not use zones like this where price slashes through it a million times and some people try to read in between all the lines of it going back and forth and saying oh look it might be a Zone it might be this it might be that I I just don't do that I I think it's ridiculous the price
hasn't clearly been bouncing there over and over I don't think it's worth trading so I don't even bother doing that so I draw zones only where price has had nice clear reversals at over and over so other bounce that resistance or bounce of support if it breaks past it it comes to retest then bounces there those are the nice clean zones that are generally pretty easy to trade another example would be something like this right here an area where prices like bounce to support in fact it's probably a little bit actually further up here broke
below tested as resistance broke back above then found support twice it was support it was resistance then it was supported again and it was only broken through twice once here and then once here that's it zones that are very very clear areas where price has very very clearly and specifically bounced there over and over and over so that's the first thing areas where price clearly has bounced in the past over and over hasn't really swiped through it very often second thing I thicken up my zones nice and thick and I mean thick with two C's
y'all boys know what I mean so let's say you have an area like this here whenever price was bouncing here it started up here but then price bounced like right here so it could be that but then it also kind of came down there to that previous high so it could actually be this right here and you have this little cluster of levels that you're kind of like not sure price is going to bounce same sort of thing down here you've got like that low but then you've got price stopping a little bit like closer
up top so it's just it becomes a question like like what are you gonna do like what do you do right there so here's what I do I just I don't even play that game I just delete everything and I just draw a nice thick support resistance Zone to represent that that general area is where price has been bouncing and that's it I just thicken it up if sometimes price won't go all the way into a Zone sometimes it'll go really far into his own break past it a little bit I don't like getting myself
trapped in zones where you're trying to be super super specific and clearly Define them down to almost the exact pip in practice for me over the past five years that just doesn't work and I'm just speaking from experience I can only say what works for me that just doesn't seem to work very well for me it just seems to work better when the zones are thick so let's actually go let me prove this concept here I'll show you three trades I'm in right now using support resistance on the daily chart I bought right here on
Euro Canadian dollar you know why I bought because prices just at a support Zone that's it support twice here support the resistance twice resistance twice broke above found support once and then twice and now we're back here for a third time I just think it's going to bounce again so price breaks below this zone I'll lose like three thousand five hundred dollars and if it bounces here I'll make like Seven Grand if this is your GBP right here uh daily support Zone if price breaks below this Zone and tests it I actually took a cell
here and I closed that and profit and I got back in today risking three thousand dollars to go for about three thousand dollars if it wins just to break a retest of a support resistance there GDP JPY this kid's like plain as day like could not be simpler it's at a resistance Zone there's the previous high it's balanced nicely there bounced again here we're just at this zone for the third time oh no I just think it's gonna bounce and if I'm wrong I'll lose some money and if I'm right I'll make some money so
on this one if I'm wrong I'll lose like three grand and if I'm right I'll make like forty five hundred like a little over four thousand and if I'm wrong normally what I'll do to lose a little bit less on my losers is I use two risk structures one of them is using stop losses to make it simple another risk structure I use is hedging where if price breaks above the zone I'll either hedge or I'll get stopped out and then I'll manage the trade from there so in this case if this breaks above the
zone I'll probably just close right there that'll be maybe like a thousand dollar loss instead of a three thousand dollar loss so it's like I lose a little bit less when I'm wrong versus whenever I'm going to make a little bit more let me show you all this stuff uh actually on chart let's pick like a random currency pair here we'll pick a number between one and ten three so it gives us eurocad your GBP and GJ so let's go to a different GJ chart here and I will clear all the drawings all the drawings
are removed it will scroll back somewhere random and then I'll hit replay so here we are on oh this is the daily chart let me go to the one hour so it's easier let's just exit all this so one hour chart keep it simpler scroll back somewhere random then I'll hit replay and here we are cool so let me give you an example we're here on this chart we're not going to be drawing zones that are wishy-washy pishi poshy where it kind of snaps around back and forth we don't want any of that we want
the clean take them home to Mom and Dad zones where it's like nice and clean and everything's very you know respectful zones that have just bounced very nicely stuff that's not gonna be like unreliable and just thicken them up keep them nice and thick don't don't draw them too skinny or too tight or anything so um that's what I do now if price gets here we can sell and then if it gets back down here into the support Zone we can buy if we're wrong we'll just use a stop loss here just for the sake
of Simplicity I like I said I use stop losses I also use hedging to control risk as well depending on the context of the trade and how close the next zones are just all depends on the situation we'll do it in stop losses here just to show proof of concept make it real nice and simple for you now remember support and resistance has no predictive power it is just a good way of controlling a risk that is it you cannot predict where the Market's going to go I don't know where it's going to go you
don't know where it's going to go nobody knows so if price if we can enter right here I normally enter about halfway in between the zones I don't bother waiting for Rejection it seems to be a waste of time to me because price is still just going to go up or down whether you wait for rejection or not so I just enter as soon as it gets to the zones that's typically what I do my targets are generally at the next zones and then I put a stop just below the Zone on the other side
of it not too close because it'll pin past it sometimes but not too far either if I do put it far I'll just risk more and then I'll have an alert just on the other side of the zone to close if it breaks through the zone so in this case here's what the restructure will be so it'll either stop out or it'll hit the target so in this case it hits the target goes and hits the target that's great so price also got to this next resistance zone so I would have taken a trade there
so I would have sold right here at resistance I would have had a stop loss right past the zone right there and then a Target down here at this next zone so in this case this one lost you know so that's minus one unit of risk let's say we're risking a thousand dollars per trade here and uh you know we've made whatever this was a little over 2 000 then lost a thousand on that one so what do we do we do the same thing which just draw the support zones we wait for price to
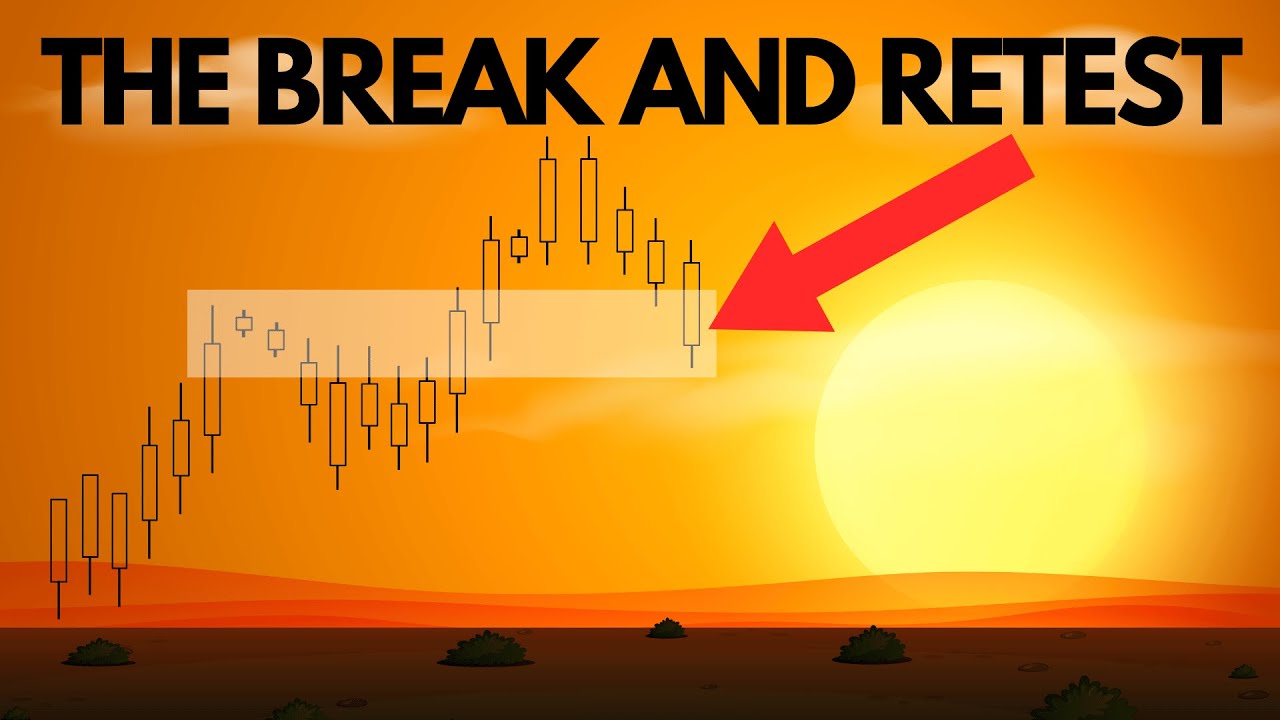
retest and the price retests the zones then uh we get an entry about Midway into the zone so in this case uh price it barely broke past the Zone it's not really a clear break every test so I'm just gonna pass this one up would have worked out cool so we'll wait for price to get all the way up here to this next resistance then we'll sell so we enter at the Zone we sell we put a stop loss just above the Zone Target down here around the next Zone we'll do like one like about
Midway through see if it comes in tests then we'll just let it play out so it comes and plays out so we win this we make two and a half whatever it is we wrist uh we'll do one more trade then we'll wrap it up and I'll show you guys um yeah the basics so price breaks it retest this zone so now we've broken and retested um I think this is going to break back above the Zone but just to show you how you can mechanically do it a cell right there a stop loss just
above a Target down here at the next Zone and then it either wins or loses it goes up or down in this case it went down so it's like whenever it comes to support or resistance keep in mind you will win half the time and you'll lose half the time most people's win rate sits somewhere around 50 50. on some weeks my win rate is like 70 80 90 percent on other win on other weeks my win rate's like 20 or 30 percent it averages about to be 50 50. that's pretty much like most people
who are average Traders like me because I'm nothing special at all been doing this for seven years and I'm still nothing special most people average out to be 50 50. it'll bounce at the Zone about half the time and it'll break the Zone half the time you'll be wrong half the time you'll be right half the time and the thing is is what makes it profitable trading with support resistance is that it's a great way to control risk you can enter at a specific area and then you can have a way to say if it
breaks the zone I'll be out of the trade and I'll lose some money and then if it bounces at the Zone then it'll be nice and I'll make a little bit more than I lose the only reason I'm profitable is because I make a little bit more money than I lose I have winning outcomes most of the time whenever I'm using hedging as a risk structure you can watch my other videos if you learn how to do that it's an even higher win rate if you look at an outcome by outcome basis then using stop
losses but this is the Simplicity behind it drawing simple support resistant zones accepting that you have no clue what's going to happen and just entering at support buying and support and then selling at resistance getting out if you're wrong for a small loss and then if you're right you know holding the trade to the next Zone where you think it's likely to bounce to make a little bit more when you're right than the amount of money that you lose when you're wrong so that basic if you want to see me do this live every single
day click the first link in the description that's my free telegram Channel I send out all my daily analysis trades support resistance odds make unlisted YouTube videos specifically for people in there there's like 30 or 40 000 people following me in there right now oh no it might help you too first link in the description thanks for watching I'll see ya