hey guys what is up and welcome to a new Tesla update video So today as per usual let's go over Tesla stock Let's go over the market Let's talk about what happened uh today this week overall And uh yeah I'll give you my thoughts moving forward uh moving into next week Next week I think could be a little bit potentially you know small shakiness to start the week off but I think next week should be uh a good week to get the market really you know finally rolling in the right direction Let's just say that
But all in all if you enjoy please don't forget to hit that like button This is not financial advice I am not a financial adviser And of course if you enjoy my technical analysis thoughts on the charts updates etc well I do share my thoughts with my members every single day The market is open while it's open throughout the day Um so definitely check that out if you're interested Uh just three bucks a month You get access to all my thoughts post updates mainly on Tesla stock sometimes other stocks They have been sharing other stocks
as well Uh or for $5 a month you get access to everything in the first tier plus Nvidia daily updates as well But jumping into it Tesla closing the day with almost a 4% rally closing pretty much at $250 per share which obviously compared to the market you can argue is maybe a slight underperformance but kind of in line arguably a slight underperformance with QQQ up two and a half% right Tesla should be up closer to 5% with this kind of day But sometimes you know it is what it is The reason it was only
the reason it closed at 250 I'll be honest is Tesla's max pain um was 250 right Sometimes that's just kind of how she rolls right You can see if I go here Tesla Max Pane If this decides to load is 250 I don't know why it's not loading Whatever I'm sure you trust me It's 250 I don't know why it's not loading Surely one of these loads Here we go Uh where does it say 250 I don't I don't know It says somewhere 250 Whatever man Just trust me on it The max pin was 250
and that's why we closed pretty much at 250 So what does this actually mean moving forward into next week Well let's start off with the 1 hour chart right 1 hour chart is you know one of my favorite time frames Uh especially lately I've been very much enjoying the 1 hour time frame lately Very very nice Uh 15 minutes pretty good too but uh I like the 1 hour personally Anyways so what can we expect moving forward Well today you know we had that little bit of a sell off right We had a nice open
at uh that you know classic 250 level that you know we're still finding some resistance at and we still couldn't close above So that is you know I wouldn't say it's necessarily a concern but it definitely would have been better right It definitely would have been better to close above 250 We couldn't do that just yet So regardless we we got rejected at it arguably twice today right once at open over here and uh pretty much right at close or towards the close you can see here right two rejections at 250 as we got rejected
we came right back into the cloud pretty much near the bottom end of the channel over here you can see roughly and then we of course found a bounce back higher and now we're back there now Tesla is arguably printing what looks to be um a nice looking uh rising triangle pattern where you know we have we've fallen I mean usually rising triangles are bullish continuation patterns but even this one could potentially be you know reversal situation where you know we're constantly getting rejected at the exact same level but we're making higher highs and higher
lows So you know ultimately really just comes down to getting we had a 15-minute closure above it You can see here on this candle right here but we couldn't really get nice followthrough So 1 hour would probably just be better confidence inspiring right But ultimately we would just you know we need to close a 1 hour candle above 250 251 252 something like that that $2ish dollar range And that should be pretty good news for Tesla moving forward But regardless of you know whether or not uh that's the way you want to look at it
another way to look at it on the 1 hour in this case is the fact that well two ways is the fact that you know we're still in this rising channel right I mentioned this rising channel This rising channel you know theoretically should continue rising right And this is a pretty steep rising channel right But you know we were also in a pretty steep descending channel for a long time actually like weeks even right That looks something like this right We're in this very steep descending channel all the way from uh February 21st is when
it technically started which is pretty ridiculous right And we were in this rising channel all the way until March 11th That's a pretty long time man That's like that's over two weeks of trading days that we were inside this very steep also descending channel right now You know it's not impossible to have something similar back to the upside right So just keep that in mind But regardless we're in this rising channel So as long as we're within this channel you know I assume we will overall make our way higher And I I'd be pretty surprised
if we don't Another sign that I'm starting to like to see on Tesla stock is the fact that on the 1 hour chart you can see this white line over here this one kind of been moving with us the 50 EMA This is the first time today that we have officially been testing it that we've had enough bullish pressure or the very least the bearish pressure has eased off enough to bring us up to this 50 EMA Again you can look all the way back from here you know when we pretty much started this breakdown
right here this whole time You can see keeping our eyes on this white line Not one single time We got kind of close over here but we didn't actually really get to it Um you know we haven't actually pretty much like quite literally tested this line right Not a single time And this was the first day in literally weeks that we have officially finally got to the 50 EMA without just you know the bearish pressure can pushing us down lower and steeper and faster right Which is you know showing that that bearish pressure is starting
to ease off which is a good sign The next step I want to see as well while we're within this rising channel to continue rising within it which honestly assuming things go well even by Tuesday we can potentially even see Tesla you know closer to the 270s potentially that'd be pretty impressive but you know we also want to get back above this 50 EMA right once we cross back above the 50 EMA get these two moving averages down here the 8 and the 21 to cross back over as well which is essentially what Nvidia did
over here you can see nice little gap up we can also gap up on Monday morning that'll be ideal right we could do what Nvidia did it gapped up above the 50 EMA and then it started turning you can see into support the EMA's also crossed over and Nvidia has been having a pretty nice you know follow up since then and holding pretty strong as well right so that's just something that you know we're looking for Tesla to do now right essentially is what I'm trying to say so let's see how that actually plays out
moving into Monday now Monday has been historically not historically um for the past I mean pretty much since this correction began ultimately has been a pretty bearish day uh you know it has been pretty much the most bearish day of the week uh for a few weeks now in a row so if we can get a change of character essentially in Monday coming up this coming Monday essentially in a couple days That would be a good sign That would be a good sign for the for the market that you know there is a change of
character if you will in the markets overall sentiment I guess Um which will be very nice sign to see Obviously next week we have FOMC on Wednesday Keep that in mind So you know take that for what it's worth But nonetheless I do think you know maybe we get a little bit more shakiness to start the day or the week off Maybe maybe even on Monday Maybe Monday just happens to be another you know unfortunate day and Tesla sells off back down to about 244 245 But I would expect that to hold and us to
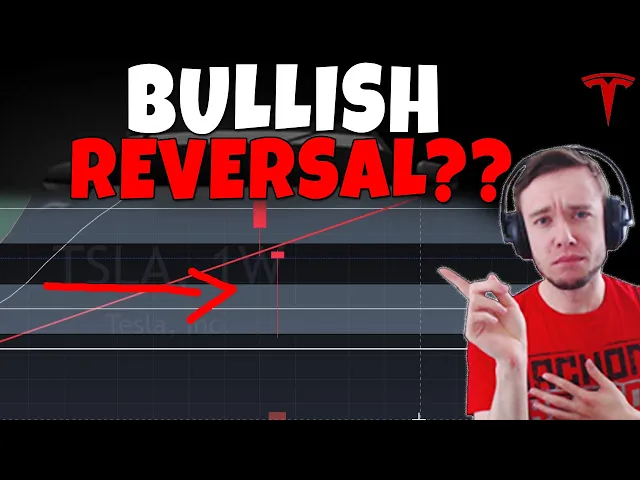
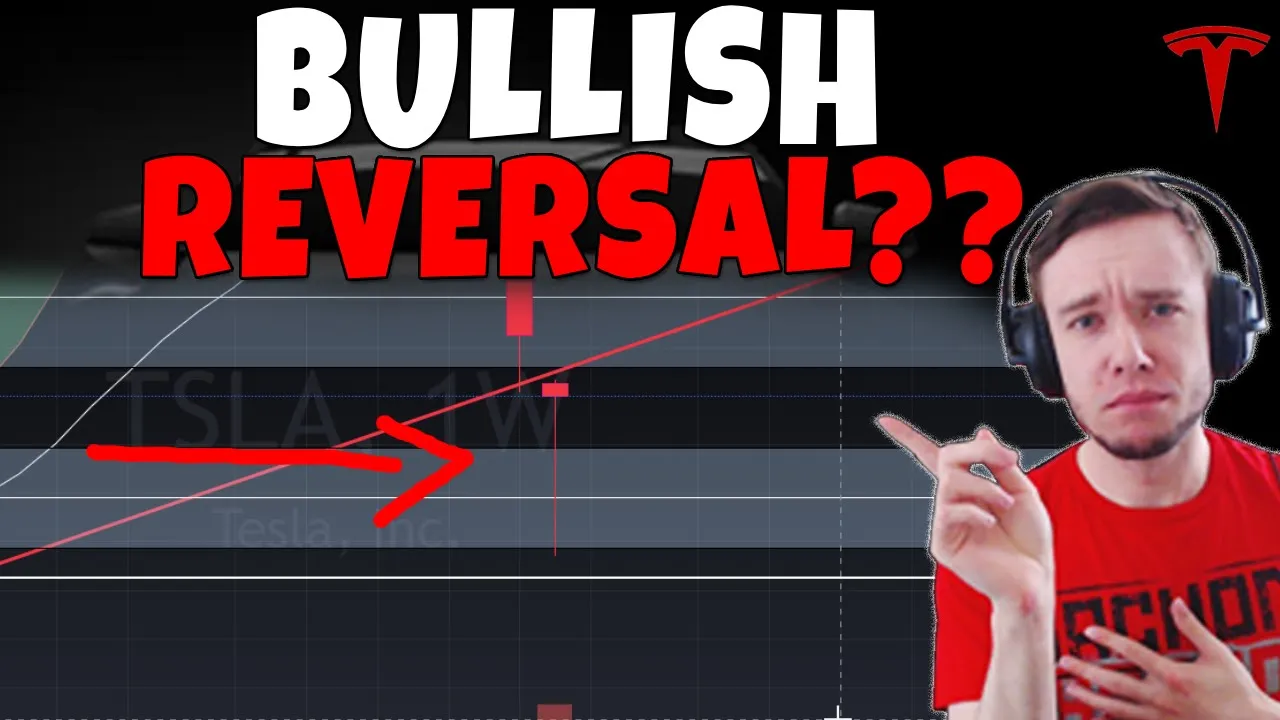
push up higher off that or even better a gap up and then we continue higher kind of like what I just showed how Nvidia did That's pretty much the one hour analysis right Uh let's go over to the weekly I want to do the weekly here because the weekly has officially or the week rather has closed So the weekly is interesting This is uh this is quite a hammer candle I'm not going to lie You can even argue that this one is pretty much a dogey candle ultimately Um you know whether it's a dogey candle
or hammer candle I mean let's take a quick look Actually it's hard to say that's a dogee or a hammer right You can take it You can kind of argue it's either or right You can you can argue it's a dragonfly dogee or you can argue that it's just a hammer candle right You know whichever one you want to make an argument for I think they're both they're both pretty similar in structure But the point is you know I'm going to stick with a hammer cuz the hammer is in my opinion more bullish And this
is quite a hammer candle I will admit Now the one thing I would have definitely like to see is again a close pretty much you know around the mid 250s That would have made this hammer candle green or you know in my case white which would have been even better right a green or white hammer candle is more impactful than a red one which is you know the one that we unfortunately got However it's a hammer candle nonetheless And what does it show Well I mean I think kind of speaks for itself right It shows
some pretty intense buying pressure and we pretty much closed You know the idea is the fact that it shows that we opened up towards the high higher end of you know in this case the week pushed down significantly and then within that week we had enough bullish pressure come in to buy it all back up and pretty much closed at pretty much the same spot or close to it um that we opened up the week on in this case it's a weekly candle of course right same thing on the daily whatever but the point is
the fact that it just shows that you know the bearish pressure is easing off and the bullish pressure is actually kicking in right very very it's one of my favorite candlestick patterns again would have preferred it to be white or green but nonetheless still pretty good And this is quite a hefty one right The longer pretty much the longer the the uh uh the wick and the smaller the body the better it is And in this case we have an extremely long wick and an extremely small body So this is with a very small wick
at the top This is also pretty important The wick at the top is also very very small which is also good news So yeah it's it's a beautiful looking hammer candle You know it's I will give it like an eight out of 10 on this on a scale of how good it is 10 out of 10 would have been if it was green or white in this case that would have been even better Uh that would have been 10 out of 10 But nonetheless pretty good So I do expect follow through on this right This
combined with the fact that we're in this 1 hour rising channel I think both are pretty good news But again the only concern I would say quote unquote concern is that fact that you know we did technically officially break down below this uh channel you can argue right This you know massive rising channel that we were in We did technically close below But the thing is is we're so damn close to the line that I think that you know on such a large scale after such a very aggressive and vicious selling pressure you can easily
make the argument the fact that you know it deserves some extra wiggle room right you know the fact that we're this close to it implies the fact that you know it's not that bad like if we close well below it then it's like okay then you know maybe we're not out of the woods just yet maybe we won't get that relief rally etc but because we're just so darn close to it right and you know because my trend line obviously obviously isn't drawn to absolute perfection and just a guideline line You know you can give
it the benefit of the doubt is what I'm saying right On top of this the weekly we're very far away from the 50 EMA but that's not the main thing The main thing is the fact that the weekly is extremely far from the up to down We're 22% downwards from the 8th and the 21 rough area and a rally of about 28% higher Like we're so far away from the 8th and the 21 EMA on the weekly Like it doesn't you have to understand guys you have to understand like if you look back in the
history of the stock right Like it doesn't get this far away from these EMAs Like even look at this one Even here when we were selling off this aggressively we never were that far away like we are right now from those EMAs Like especially the eight right It's a pretty fast I mean yeah it's a weekly chart but it's still a pretty fast moving exponential moving average right Even here to the to the lowest point we were only down Actually no this was pretty far away too Never mind I lied But but okay fine We
we were But regardless the point stands Look what happened just a couple weeks after We slingshot it back up very aggressively right back into them and even above them Not saying we'll go above them this time necessarily but the point is is that we did slingshot back into them pretty quickly right So this would be something similar of that sort So let's see how this plays out right Let's see how this plays out But again usually when you're this far away from the exponential moving averages like this especially the quick ones again you don't usually
stay that far away from them for very very long right You're usually at the very least you meet somewhere in the middle like this which would bring Tesla somewhere to the 280s let's say 290s or we can move up back to it right Whichever one really comes first But again the point is the fact that you don't stay away from them this far this long Uh usually at least Um yeah So the daily you can see how important this kind of you know very low 250s level is You know we need to get back above
it ideally as soon as possible We did come back to the 8 on the daily chart So we're back to it That's a good sign Um but you know we need to start closing daily candles above it kind of like what Nvidia did back here You can see it closes a daily candle above the eight ema That was you know a nice sign that you know the that was another sign that the bullish pressure is coming in and the bearish pressure is easing even further So in other words Tesla wants to start getting a daily
closure Let's say maybe Monday or Tuesday or something like that Again that mid250s that mid250s is just that level right We need to start getting those closures in the mid 250s Uh that still is a crucial level that would be a good sign The RSI I did switch it back to 14 here on the RSI got very oversold but we did exit oversold territories A lot of people what they use RSIs for is instead of entering uh you know the stock when it's down here they actually wait for it to get back above and then
we did get back above and now we're showing a little bit of a bullish divergence if you will uh slight bullish divergence on the RSI as well which is also a good sign and some people wait for it to kind of retreat back upwards like this from oversold territories before stepping in That's exactly what we did the past two days and including today Also a potential positive sign for those kind of traders So there's a lot of good signs setting up for Tesla stock right There's a lot of bullish momentum setting up Now obviously the
the biggest thing that would tell me that the bullish momentum is no longer the uh you know the case here if you will is losing this rising channel That'll be the main thing I'll be looking at Essentially really dropping below 245 244 something like that and really starting to close 1 hour candles below those levels roughly um would be a bad sign So that's that's the thing to watch out for Um let me see Am I missing anything I think that's majority of what I wanted to mention I don't think there's too much more to
talk about Uh monthly we still have a lot of work to do Uh monthly is nice you know 50 emo It's holding pretty nicely there I'm pretty sure if I bring out the um 200 day moving average I'm pretty sure we closed back above the 200 day moving average I know a lot of people really like the 200 day moving average Let's take a look at and see where that is exactly but I'm pretty sure we closed back above it as well Just barely Yeah you can see we actually just barely held the 200 day
moving average I know a lot of people rely on this one quite a bit So the fact that we held that is also a pretty good sign So again there's a lot of good signs setting up Now can it all fall apart Absolutely But you know as of right now I don't expect it to pretty much one hour it will tell me that it's falling apart pretty quickly Um so let's see how that plays out moving into next week with FOMC But I do expect the market especially the market looking pretty decent right Also the
market setting up some nice looking hammer candles SPY at the 50 EMA right QQQ right around the 50 EMA You know there's a lot of signs pointing that the market maybe you know maybe a little more pain early in the week Maybe you know definitely definitely a possibility but overall it's it's feeling like it's ready to get at the very least a dead cap bounce and you know relief rally uh moving into the next couple weeks or so But yeah I don't know That's all I got So let me know what you think down below
ladies and gentlemen Very quick look at options flow Take a little peek over here at Tesla stock Let's see what it's telling us as I go back to it over here That's stock Yeah pretty mixed flow honestly Pretty mixed flow throughout the day Nothing really crazy Yeah nothing really standing out to be completely honest with you Uh yeah nothing crazy Um pretty muted honestly Surprisingly pretty muted So let's see how we open up on Monday and start off next week with FOMC Thanks for watching See you on next week This