an exceptionally brutal day on Wall Street the stock market suffering major losses on the heels of the president's tariffs what is setting up to be the worst day for US equity markets since at least the onset of the pandemic millionaires are made when the stock market crashes and the bigger the crash the bigger the opportunity especially if we can be greedy when others are fearful that's the best way to get rich without getting lucky so in this video I'll cover everything you need to know about the market crashing and which stocks could win big as
a result your time is valuable so let's get right into it first things first I'm not here to hold you hostage so here's everything I'm going to talk about why this latest round of tariffs caused such a big market crash how far stocks could drop and for how long exactly how to be greedy when others are being fearful and of course which stocks I'm buying as prices continue to tank this is a once-ina-lifetime opportunity so strap in and let's talk about this market crash stock markets around the world are crashing as President Trump's tariffs take
effect both the S&P 500 and the NASDAQ saw their biggest draw downs since the pandemic after reciprocal tariffs were announced for nearly every country on the planet the reason that markets are crashing is these reciprocal tariff rates came in much higher than expected for example goods imported from China to the US now have a 34% tariff on top of the existing 20% imports from the EU now have 20% tariffs and Southeast Asian countries like Vietnam and Cambodia got slapped with massive 46 to 49% tariffs china and the EU accounted for about a quarter of all
US imports last year and we also get a lot of things from Southeast Asia like textiles machinery and electronic components the big thing to understand is that these reciprocal tariffs are part of a much bigger economic plan a plan that I personally think is going to backfire which affects how I'm personally investing just to be clear this isn't about personal politics and I'm going to back up everything I say with numbers let's cover the plan first and then talk about its potential impacts on the stock market trump's economic plan is heavily inspired by a paper
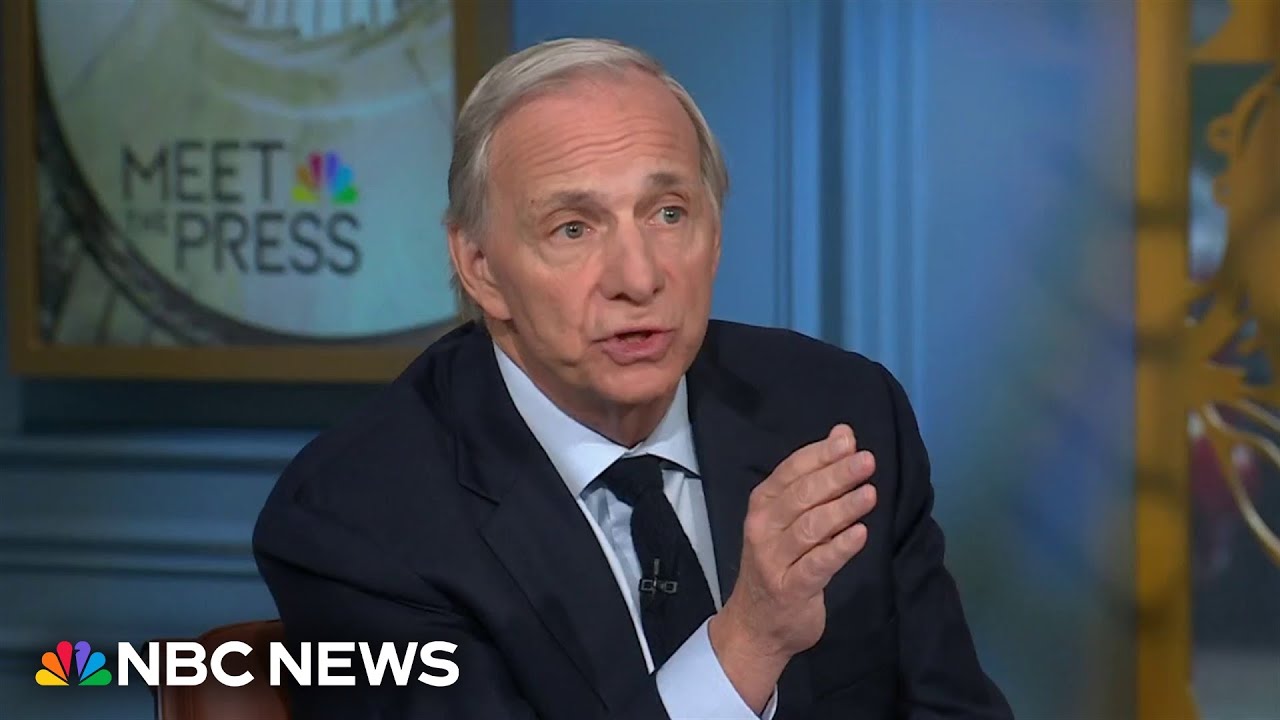
called a users's guide to restructuring the global trading system by Steven Moran who's the current chair of the White House Council of Economic Advisors i'm obviously not an expert on global economics but I did sit down and read the whole paper to try and get a sense of the big picture moran's paper has three key parts using tariffs as a negotiating tool forcing fair trade through separate reciprocal tariffs and ultimately restructuring the US's foreign debts and we're already in part two of this plan the first part is using tariffs as a tool to pressure other
countries into renegotiating trade deals like I said in my previous videos the 25% tariffs on Canada and Mexico were negotiating tactics to address US trade deficits and issues around immigration and border security the big idea of this part of the plan is to create enough economic pain for other countries to force them to the negotiating table part two is leveling the economic playing field with reciprocal tariffs which is what happened earlier this week reciprocal tariffs mean that if a country imposes 20% tariffs on US steel we automatically impose 20% tariffs on their steel as well
so it's kind of like mutually assured destruction where the only logical conclusion is for everybody to start lowering tariffs and trade barriers which ultimately levels the playing field for American manufacturers and workers the third part of the plan is all about weakening the US dollar without risking its status as the world's reserve currency which also helps make US exports cheaper and US labor more competitive now let's talk about why I think this plan is going to fail remember what I said earlier markets are currently crashing because reciprocal tariffs came in much higher than expected but
how can that be if they're just the same rates that those countries are already charging us well it turns out that instead of actually being reciprocal the tariff rates announced last week appear to follow a simple formula that has nothing to do with other count's tariffs at all they just take the US trade deficit with that country and divide it by that country's total exports to the US to get the number in the middle column of Trump's reciprocal tariffs table then you just divide that number by two to get the discounted reciprocal tariff rates in
column three for example America's trade deficit with China was $295.4 billion and the US imported $439 billion worth of Chinese goods in 2024 295.4 divided by 439 is 67.3% and dividing that number by 2 gives us the 34% reciprocal tariff rate there's nothing in there about the specific tariffs on Chinese steel or cars or electronic components it's simply the bigger the deficit the bigger the tariff another big problem is inconsistencies from country to country according to the formula I just showed you the US would have to have around a 10% trade deficit with the UK
to make this math work out but we actually had a $12 billion trade surplus with them last year which means the UK already buys more from the US than we do from them and the Trump administration is still charging them a 10% tariff there are 115 countries on this list with that same 10% tariff and all 115 of them are countries that buy more from the US than they sell to us and all 115 of them just got hit with a 10% tariff anyway and since nothing in this formula is actually a reciprocal tariff there's
no way for other countries to even calculate how to lower their tariffs in response that's why these tariffs can't last especially once huge US trade partners start imposing actually reciprocal tariffs based on the ones the US just announced for example just as I'm recording this China announced 34% tariffs on all US goods and it wouldn't surprise me to see more countries follow suit remember tariffs on US goods work the same way they lead to lower demand which lowers sales for US companies which leads to lower stock prices that's the big connection between tariffs and the
stock market crash and that's why it's so important to diversify your investments with assets that don't correlate to the stock market the problem is that most alternative assets either have high minimums like private equity or they're high risk like cryptocurrencies that's where the Fundrise flagship real estate fund who's making this video possible can help you they give you access to invest in some of the best real estate strategies without breaking the bank real estate investments usually need a lot of upfront capital but the Fundrise flagship fund gives everyday investors access to high demand single family
rentals affordable multif family apartments cuttingedge industrial warehouses and commercial facilities all in one portfolio designed for diversification and long-term earning potential with an access point starting at $10 they also have an impressive track record already managing over $7 billion of real estate across hundreds of high-v valueue properties so if you want access to some of the best real estate across multiple investment strategies check out the Fundrise flagship real estate fund with my link below today all right that covers why I don't think these tariffs will last very long which means all the pressure they're putting
on stock prices will eventually go the other way but how long could eventually be and how far can stocks fall in the meantime to answer that let's look at some historic market data next this is a chart from First Trust and Bloomberg showing the S&P 500's performance during every bull and bare market going back to World War II the x-axis is time and the y-axis is total returns it turns out that bull markets last an average of 4.3 years while bare markets last 11 months and the average return during a bull market is 150% while
bare markets lose roughly 32% on average that means bull markets last 4 and 1/2 times longer than bare markets and return three times more than bare markets drop this is why millionaires get made during stock market crashes they're really opportunities to buy the best stocks at the biggest discounts that's also why I focus on long-term investing it takes years for markets to hit the top and recover from their bottoms and to understand that let's look at another study that splits bare markets into two parts their declines and their recoveries in 1956 the S&P 500 went
down 21% over 15 months and then took another 11 months to recover from the bottom compare that to the start of the pandemic where the market dropped 34% in just one month and it also only took 5 months to recover there's an important lesson in this study that I think will make millionaires as well the average bare market takes around 13 months to bottom and another 24 months to recover and even the shortest bare market lasts months not minutes that means there's always plenty of time to plan build cash and prepare to be greedy when
others are being fearful that's how real money gets made in the stock market but how do we actually know when to be fearful and when to be greedy let me show you that next before I even check my favorite stocks I always check CNN's fear and greed index which is currently showing extreme fear this is one of the lowest ratings I've ever seen for this index and if we look at a one-year timeline the market is the most fearful it's been in the last year which is useful info for anyone who wants to be greedy
when others are being fearful the reason I check the fear and greed index first is because it's an average of seven very useful market indicators like stock price momentum strength and breath the current ratio of puts to call options and market volatility as well as the relative demand between stocks and bonds so I get a lot of high-level market information all on one page two of the metrics that I use the most are market momentum and volatility market momentum compares the S&P 500 to its 125day moving average there are around 250 trading days a year
so this is really the S&P's 6-month moving average and the separation between the current price and its six-month average tells you roughly how much momentum the market has and in which direction so right now there's a lot of downward pressure on the market from these tariffs so my plan is to keep building cash until that pressure starts to reverse the price doesn't need to get back above the 6-month moving average but I try not to dollarcost average in too heavy until I'm confident that I'm not working against the rest of the market which means the
price should be trending upwards the VIX is the S&P 500's volatility index which measures how much prices are expected to move up and down based on options contracts over the next 30 days which means this is a forwardlooking indicator the VIX usually drops when the market is moving up and it skyrockets when stocks start to crash that means its 50-day moving average tends to be lower in bull markets higher in bare markets and has huge spikes that signal extreme fear so when the VIX stabilizes after a big spike and market momentum starts trending toward or
above its average that's when I start buying more aggressively all right so far we've covered why tariffs cause stocks to crash looked at how long crashes take to recover and found a way to tell when the market is being greedy or fearful now with all that context we can talk about which stocks to buy as a result and if you feel I've earned it consider hitting the like button and subscribing to the channel that lets me know to make more content like this thanks and with that out of the way let's get into the stocks
in my opinion every great long-term portfolio starts with a fund especially if this is your first market crash or you just want to play it safe everything we've looked at so far tracks the S&P 500 but it applies just as much to the NASDAQ 100 since they have so many stocks in common but the NASDAQ only has 100 companies instead of 500 so it makes higher highs in bull markets and lower lows in bare markets which is exactly what we're looking for to buy low while others are panic selling one of the big challenges with
tariffs is that increased prices often get passed on to consumers a study from the National Bureau of Economic Research found that the costs of President Trump's trade war in 2018 were passed entirely onto importers and consumers rising prices means lower spending which means lower earnings for companies and ultimately lower stock prices that means companies advertising or selling things directly to consumers are especially sensitive to tariffs but that also means they have the most upside if you believe these tariffs won't stick on the advertising side Google is trading at a price to earnings ratio of 18
which is the lowest PE ratio it's seen in two years and the second lowest in over 10 years the only time Google was trading cheaper than this was at the end of 2022 and according to discounted cash flow models like Simply Wall Street's Google is currently 43% undervalued set another way Google stock would have to go up 77% to hit its fair value today that's a 77% upside like I said millionaires are made when the stock market crashes and now you can see why on top of that I think Google's earnings estimates tend to be
on the low side analysts expect 10% earnings growth but Google's earnings grew by 36% last year and 27% the year before that likewise DCF models calculate the fair value for Meta Platforms at a whopping $880 per share making it 43% undervalued today and giving it a 75% upside and again that assumes 10% earnings growth while they've actually been growing by more than double that ever since they stopped burning so much money on the metaverse another area of the market that's crashing hard is semiconductors a very big focus of my channel the Taiwan Semiconductor Manufacturing Company
or TSMC makes 90% of all advanced chips on Earth including Apple's A series and M series chips for iPhones and MacBooks Tesla's chips for full self-driving and of course Nvidia's GPUs president Trump issued a warning that tariffs on foreign chip makers are starting very soon and they could hit 25% or higher like I've been saying though I think this is more of a tactic to pressure TSMC into building more factories and chips on US soil as opposed to a serious long-term tariff we'll see how things play out over the coming months but today these headlines
are driving TSM stock down to under $150 per share while fair value is calculated closer to $225 that implies a 50% upside the last company on my list is Nvidia itself because it's trading at a PE ratio of 32 the last time it traded at a PE ratio this low was in 2019 when it was under $5 per share after adjusting for stock splits models calculate Nvidia as being 20% undervalued but I actually think it has way more than a 25% upside in the years to come and I've made many videos explaining why but hopefully
this video helped you understand what's causing the stock market crash how long this crash could last how to be greedy when others are fearful and of course give you some great stocks to think about once all this dust settles because relying on data instead of your gut is a great way to get rich without getting lucky and if you want to see what else I'm buying to get rich without getting lucky make sure to check out this video next either way thanks for watching till the end even though I gave you everything up front and
until next time this is Tickerol U my name is Alex reminding you that the best investment you can make is in you