using momentum and volatility to track Trends can be one of the most powerful methods in trading this is because not only are we following the trend of the market via the momentum we are also taking into account how rapidly the changes in the market are occurring allowing us to know how quickly to react to changes in the chart the problem is often this is hard to visualize on a chart easily that's why we at chart Prime created the DSL Trend analysis indicator this indicator is designed to track the moment mum in the market by using
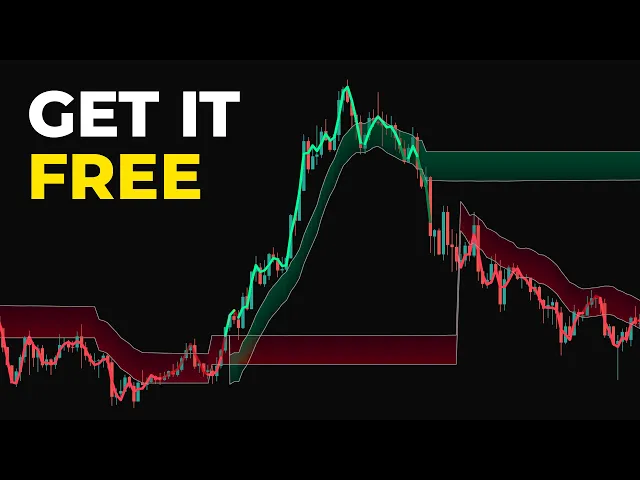
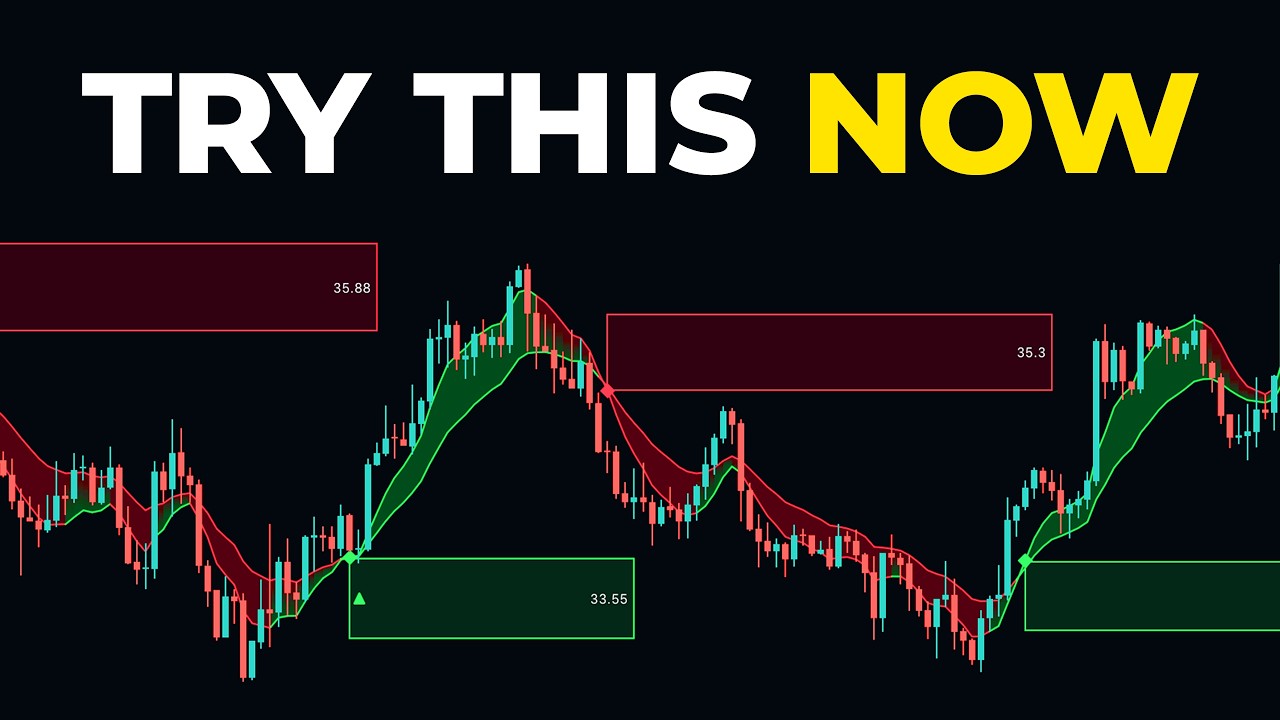
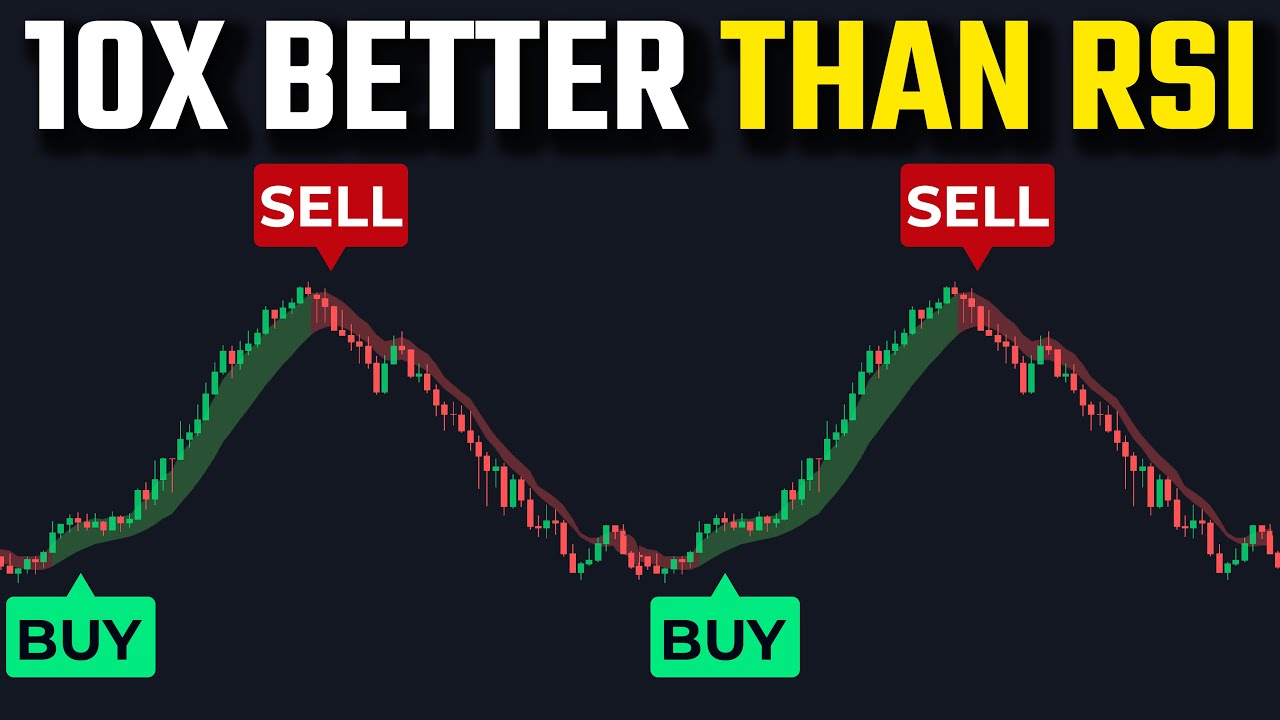
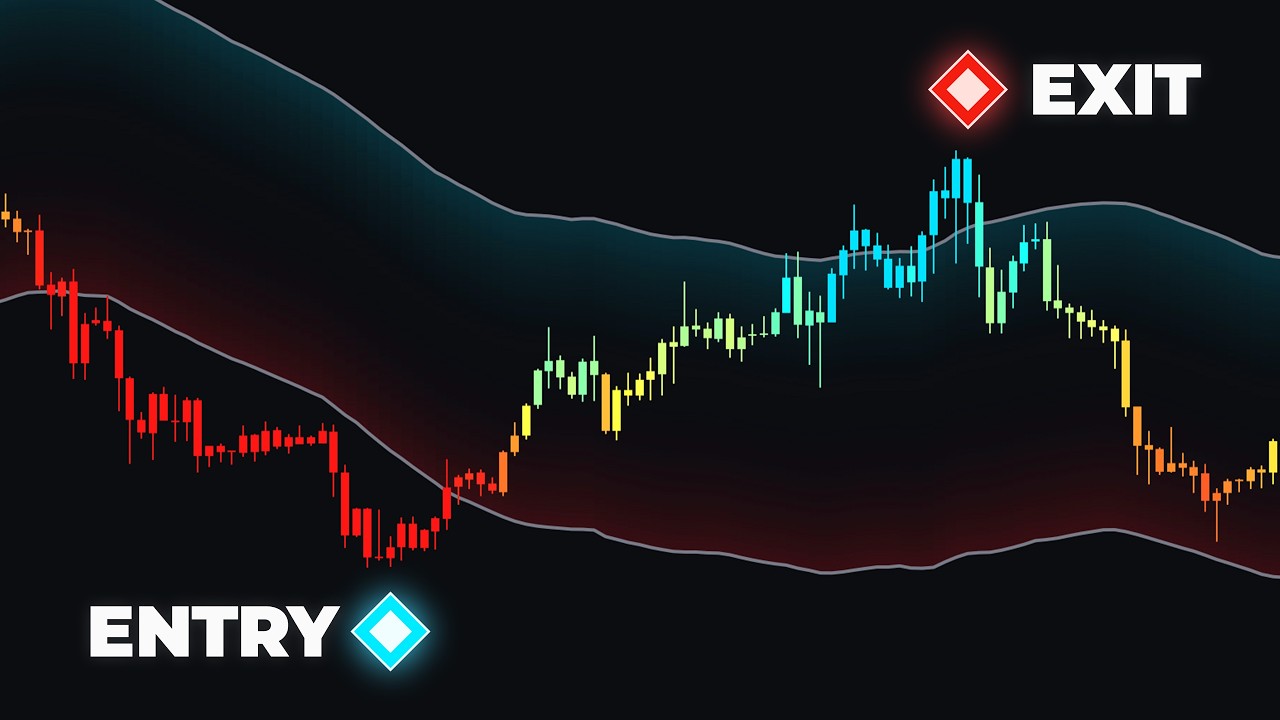
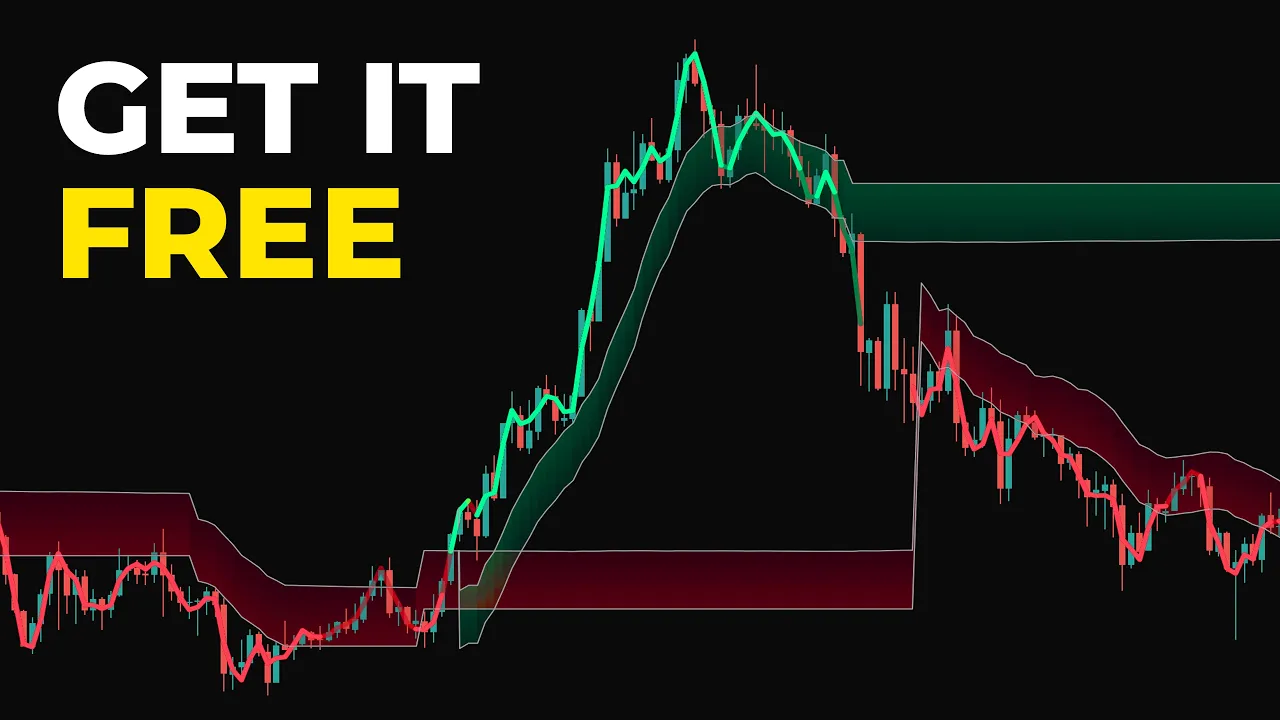
some specially calculated bands so let's take a look at how it works once you've loaded the indicator on your chart you'll notice a few key features immediately you'll firstly notice a green and red band on the chart that behav in a squarish nature when the price is above the green band a green line is displayed on top of the candles showing the uptrend has started this can serve as an excellent Buy Signal for example here we were in a downtrend we broke through this upper green band and the green line is displayed this was a
great time to enter a long position and shortly after we see the market rally the opposite also occurs when price goes below the lower band this signifies a downtrend with the line turning orange showing its prime time to be looking for selling opportunities both bans also serve as an excellent support and resistance Zone often just following the trend can lead to weaker entry and entering on retests of major market trends can be more optimal here we see in this trend the price comes down and bounces on our band making this a great place to enter
leading to larger gains and potential the other interesting thing about the main line is that it will indicate weakening momentum the line will start to become more transparent as the trend appears to have less juice making this an excellent sign to take profit and to warn of upcoming reversals and then when the price is between the bands this color is 100% transparent showing the market is changing its state for CH BR premium users you of course have the trend assistant which does exactly this but in a cleaner line form smoothing out those noisy price variations
and protecting you against potential Market fake outs but back to our indicator here for users like myself who prefer long-term trends and less noise you can open the settings and modify the length once the length is increased it allows for the indicator to perform better in swing trades whereas A reduced length is more optimal for scalpers increasing the offset can also achieve this by allowing the bands to be further apart it means you are less likely to be faked out by Rogue volatility in the market here we can see the trend was extremely smoothly followed
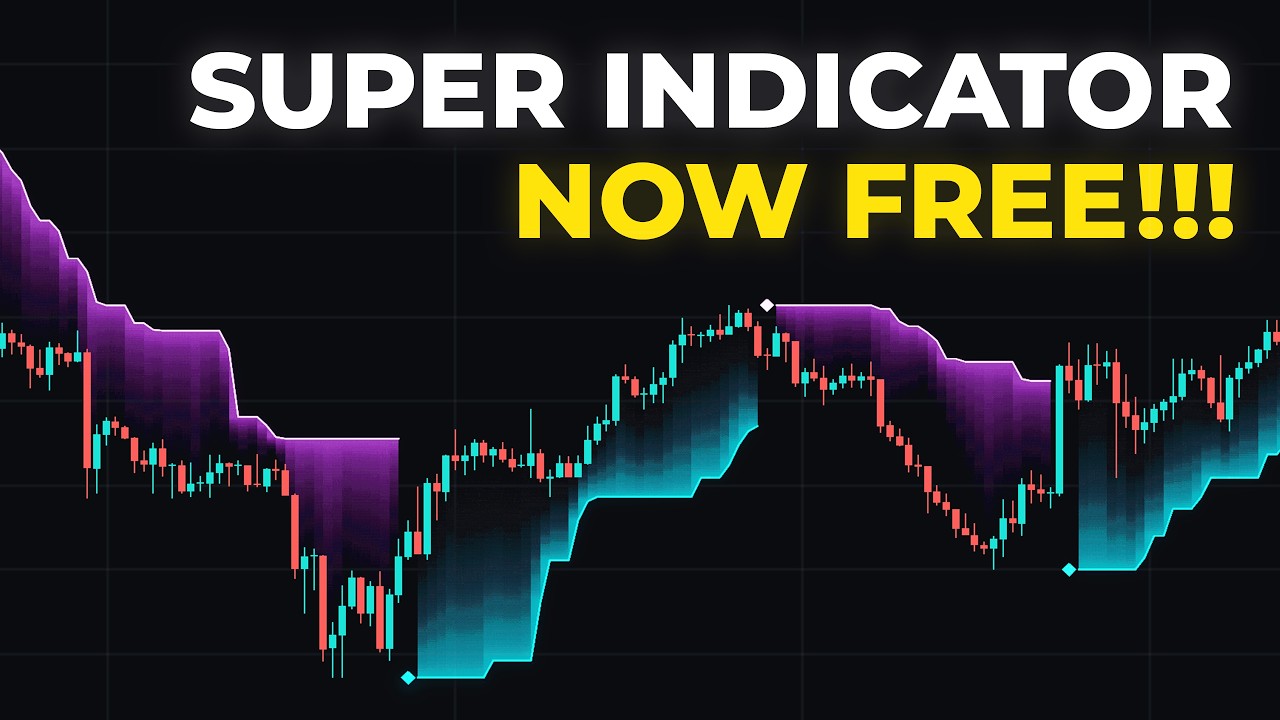
avoiding these nasty moves that other indicators would have got confused by using momentum and volatility can be some of the most powerful and classical ways to analyze a market however combining them into one tool and turning them into bands can be a massively powerful idea so if you want to use this indicator 100% free search for DSL Trend analysis and use this one by chart Prime and and if you want more free indicators like this don't forget to join our Discord [Music]