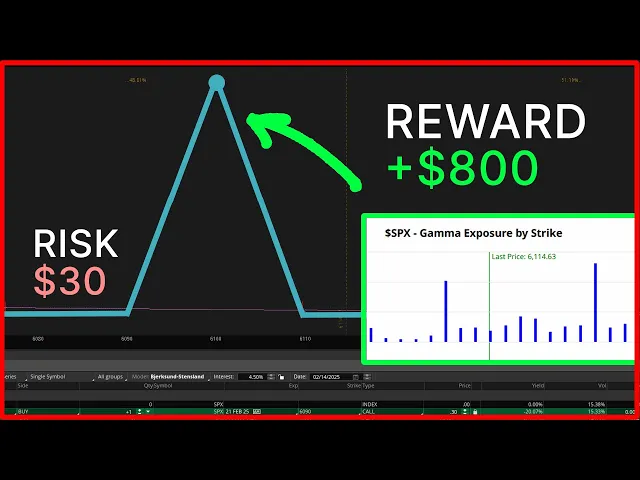
good afternoon everyone in this video we're going to build some SPX trades for monthly expiration pins and we're going to do so by analyzing gamma exposure and dealer flows by the end of this video we'll craft two different trade ideas each one is going to be a lowrisk trade idea one is risking $30 the other is risking $80 and in both cases we're looking to make more than $800 the whole idea of this lowrisk High reward trade is to analyze what is the Market's underlying gamma exposure for this February's monthly expiration and take advantage of
that information by putting on some lowrisk trades where you're okay losing if the trade doesn't work out but if you win you get a disproportionate reward for taking on this risk now to understand gamma exposure we need to First understand the gamma piece of this here's a quick overview of what gamma is but I would recommend doing a deeper dive if this is something you find interesting now You' probably heard of the concept of Delta if you trade options you've most definitely heard of Delta because you're purchasing whatever Delta strike price option that you typically
tend to purchase and you've heard it measured in Deltas Delta measures the change in the actual options price for each plus or minus $1 move in the underly so say you have apple for example for each plus or minus $1 move move that Apple moves the Delta tells you how much that option will move so say a Delta 50 options will move $50 for every plus or minus $1 move now in this case you also have to measure that the Delta today is not going to be the same as the Delta tomorrow you have this
concept called Delta Decay and the Delta changes now the rate at which this Delta changes is measured through gamma gamma measures the change in the options Delta for each plus or minus $1 stock now once you aggregate this uh gamma data across the same strike but the different expirations you can then create this concept called gamma exposure you're essentially summing up all of the data and you're then trying to figure out is this gamma exposure the net gamma exposure positive or is the net gamma exposure negative now a net gamma exposure me uh being positive
would imply the following if the net gamma exposure is positive then we know that we should expect less volatility market makers options market makers have sold options at whatever those strike prices are and it's in their best interest to essentially keep price fluctuating and to be able to collect all of this premium that they've sold to retail traders who have purchase these options this is your typical scenario that you've seen in periods like this at near these strike prices it's trades like the mean reversion trades a lot of the choppy Market trades that work exceptionally
well and if you keep trying to trade Trends during uh when price is near these strikes you'll find that those Trend following trades fail a lot more frequently now on the flip side if net gamma exposure is negative then we should be expecting a lot more volatility as price gravitates towards that particular strike price and a lot more directional moves the reason for this is if our net gamma exposure is negative then a lot of the retail Traders have sold the options and we actually have the options market makers who have purchased those options options
it's in their best interest to keep price away from whatever that strike is in which they've purchased these options so say that strike might be let's just use an example of $60 then if price came exactly to $60 all of that premium that they have purchased would be eradicated instead they want to get price away from $60 as quickly as they can so this option is actually worth something to them so that's how gamma exposure can start to become useful and this is a very high level overview but you'll see how this all ties in
now I tried to sum this up in a easy to read table maybe you find this useful if the net gamma exposure is positive then we know that dealers are incentivized to reduce the volatility it's periods in this where you'll see a lot of choppy and range-bound price action and as a result you want to take advantage of these sorts of setups mean reversion setups uh volatility box reversal setups the fade setup works really well here that's because your you're taking advantage of not just a volatility Edge but you also have gamma exposure and really
big money on your side here as well selling spreads and Condors in this joining the options market makers and selling the premium is usually a good strategy on the flip side if you have NE negative gamma exposure then you're looking for a lot more volatility and greater swings as price approaches whatever that strike price is because dealers want to get price way the heck away from whatever that negative volatility is in periods like this buying mispriced inexpensive options think out of the money calls for example make a lot of sense because you start to actually
see a lot of these crazy directional moves also during this period the opening range breakout setup works really well because you start to see the crazy movements momentum base setups so this is a quick way of how you can use gamma and Gamma exposure to make slightly smarter options decisions but now let's try and actually apply this on SPX this Friday is monthly expiration and I want to try and see where does Big Money have their interests uh in the underlying Market where do they want the market to go where do they want to take
the flow now this is a chart of the gamma exposure by strike and this is a free resource uh I've left the resource uh Link in the description box below it's barchart.com in the free version I think they choose the strikes where you get to see just a near- DAT month so right now you get to see February which works out perfectly because that's 4 days from now so with February and they've aggregated the data for us let's take a look at where we see the larger spikes here so let me remove the expiration and
let's start to analyze each strike so I see three spikes the first at the 6100 strike where we have positive net gamma exposure we can see that here positive plus 4.61 second strike 6150 positive uh net gamma exposure here as well and then the 6200 strike positive net gamma exposure here as well so with all three of these strikes 6150 is the one that seems to be the biggest than 6100 and then 6200 current price is at 6114 so we're right in between these two periods of our high gamma exposure areas now take a look
at where this gamma exposure goes negative and that's near the 6050 price Mark which tells us that as price gets closer and closer to 6050 we would expect to see dealers start to get a little bit more aggressive in getting price back up towards the 6100 Mark so 6050 is a place where I would expect to see near-term support that's the first place where our net gamma goes negative and if you were to load in the full chart here you would be able to see uh the 6,000 strike excuse me which is also the large
negative gamma exposure strike where I would expect to see a lot of support but 6050 is where it first goes negative so before I move to the next slide let me sum that up so six th000 which is not even on this chart is where we have a large negative gamma exposure strike bar just like we see here 6050 where we start to see this go negative then we have 6100 6150 and 6200 out of these three 6150 is the strike with the greatest gamma exposure all three are positive then we have 6100 and then
we have 6200 now let's bring this together on a chart of SPX I've drawn out all four levels price currently 6114 we have that 6100 6150 and 6200 all three of these are positive gamma exposures suggesting that as we're in this we would expect to see choppy price action which is what I think we're likely to see 6050 is down here which is the first place that gamma exposure goes negative so as we approach there I would expect to see dealers very aggressively picking price action back up so a place of support So 6050 if
we get there looking to aggressively buy maybe even some out of the money calls expiring this week monthly expiration is this week and now we bring back in the gamma so we have 6100 6150 both are potential pins 6100 is closer more in the money to where prices 6150 would be a new high but still just a ston throw away now let's use all of this to analyze the options chain and craft some trades this is where it starts to get a little bit more fun and we get our hands a little bit dirty now
we had the 60 uh 6100 strike excuse me and if we take a look at the open interest here notice how the open interest stands out this is the largest open interest for our Feb expiration series and the sum of the open interest there almost 53,000 contracts the next strike we have 6150 and we take a look at the open interest here almost 30,000 contracts so a lot of open interest but not as much as 6,100 now we take this information and let let's come into the analyze tab in the analyze tab I've built in
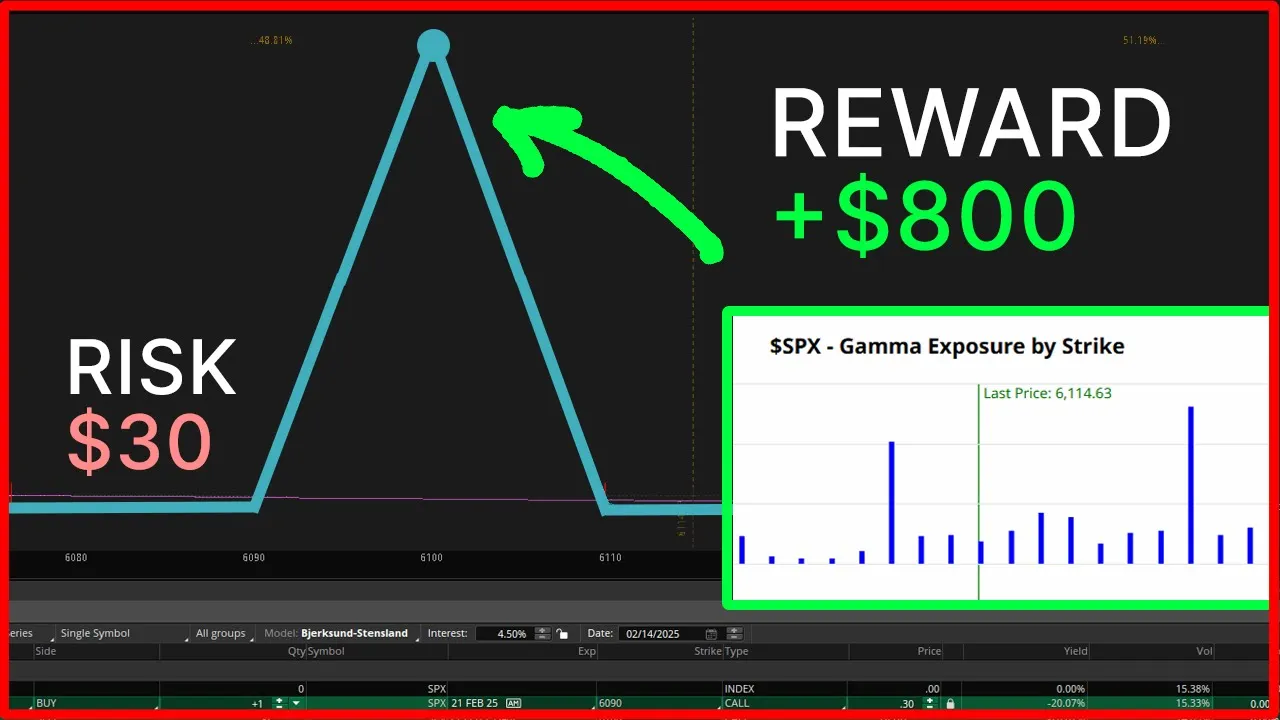
two separate trades here and both of these trades are butterflies now before we take a look at anything more with these butterflies notice the middle strikes the middle strikes are the two prices that we've been looking at where we have the greatest gamma exposure and it's also where we're looking to sell that premium positive gamma exposure we're looking to join the option market makers who have sold options near near that strike price so 6100 6150 now I've made these butterflies very narrow they're just $10 wide which is how we're able to keep the cost so
low the 6,100 is $30 the 6150 is currently $80 in both cases your reward is greater than $800 take a look at the box down here if you were to get the pin at the exact prices which is why we're putting on these trades in the first place now if price does dip below uh to 6050 then you might consider buying the 6100 call as the out ofth money call where you're looking for price to gravitate towards but if you do buy that call keep in mind you're going against what is really the big money
position here so all I'm looking to do is take advantage of that quick burst and very quickly get out before expiration it's just 6100 is where there's a lot of liquidity so these two butterflies are my two favorite trades and they're the ones that look a little bit more practical if we get closer to that 6050 65 uh 6055 Mark excuse me then I'm looking to aggressively use this as a support Zone and try and use that 6100 which is where I still think there's a lot of open interest where price is likely to gravitate
towards into the expiration so now if we summarize everything that we covered in this video we started our conversation by first understanding what is gamma and understanding why gamma exposure is useful then we moved on on to taking a look at this free graph of the SPX gamma exposure for this Friday's expiration it includes uh two other expiration dates as well and we made note of all of the key levels where we thought price was likely to react around and we then plotted those on our chart and once we plotted that we used the option
chain to build two separate butterfly positions Each of which is fairly low risk but has a disproportionately high reward associated with it and all of these stem from where we think big money has their interest for expiration 3 days from now and for all volatility box Traders I'm looking at those mean reversion fade setups this week maybe I might make a video talking about a few of those setups this week I'll also be curious if you create your own options butterfly position or maybe a different position using all the information that might be even better
than the trades that I've discussed in this video take care everyone and I'll see you in our next update