okay welcome back folks this is part two of a continuing series of four videos and i want to preface this by saying that i am again hypothetically speaking to myself when i was 20 years old and how i would coach myself if i had the ability to speak to my younger self this lesson i guess if i could preface it by saying is one of the most important things that was delayed in my own understanding one of the things that i used to crack the algorithm of the markets that repeats every single week every single
week this phenomenon takes place and i want you to really focus in on what i'm showing you here because at first it's going to seem like oh this is classic support and resistance but i'm going to change the perspective that you have on that dramatically with this lesson it's one of the things that helped me abandon the idea of classic support resistance and then it helped me understand the real narrative of what was going on and once you see this and let me be very clear some of you perhaps the majority of you will not
fully appreciate this video the first time you watch it okay so it's going to be brief it's not going to be very long but i want you to have the proper expectations coming in but if you give it a second or third viewing after going through your charts and doing the things that i'm going to talk about in this video you're going to see something that has eluded you all this time okay and one of the things that well brings extra value is i haven't even taught this to my mentorship group and i felt inclined
to teach this i felt moved to do it so i'm doing it it's not in your books no one else is teaching it no one else talks about it but they will now it'll start spreading around like order blocks now become institutional candles these things that you're about to see are rather simplistic but when you take a step back it's going to require you to study and this is the very reason why it has eluded everyone it has eluded everyone's perception uh it's eluded everyone's realization that this is what's actually going on and until you
see it for what it really is it's going to feel like well this is hindsight it's all fluff has no value whatsoever and if that's how you feel about it i really want you to never watch another video of mine because you clearly are not prepared to learn the highest degree of order flow there is because this is how the algorithm from the central bank level not the mom and pop bank not the prop traders view of order flow this is what's really going on all right so you really want to understand how the market
delivers price this is one of the central tenants to it that no one else is going to teach you you're not going to see it and you can prove it by going into your charts and looking for it but you have to understand what it looks like so i'm going to do that now all right michael you are looking at charts i'm sure wondering what it is that you should be looking for and as a trader we need movement we need volatility we need a idea of where the market is going to be reaching for
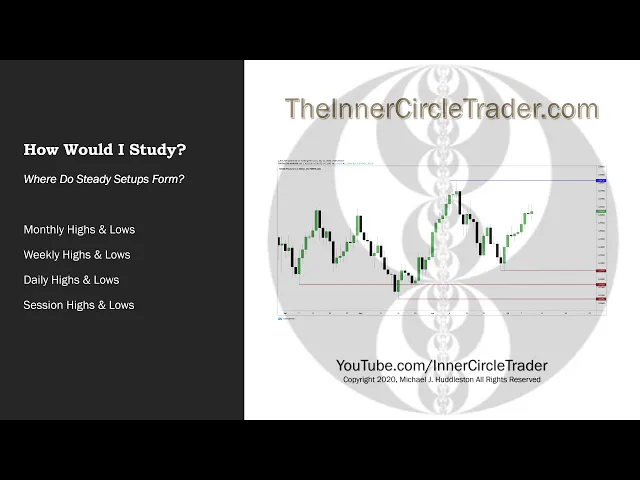
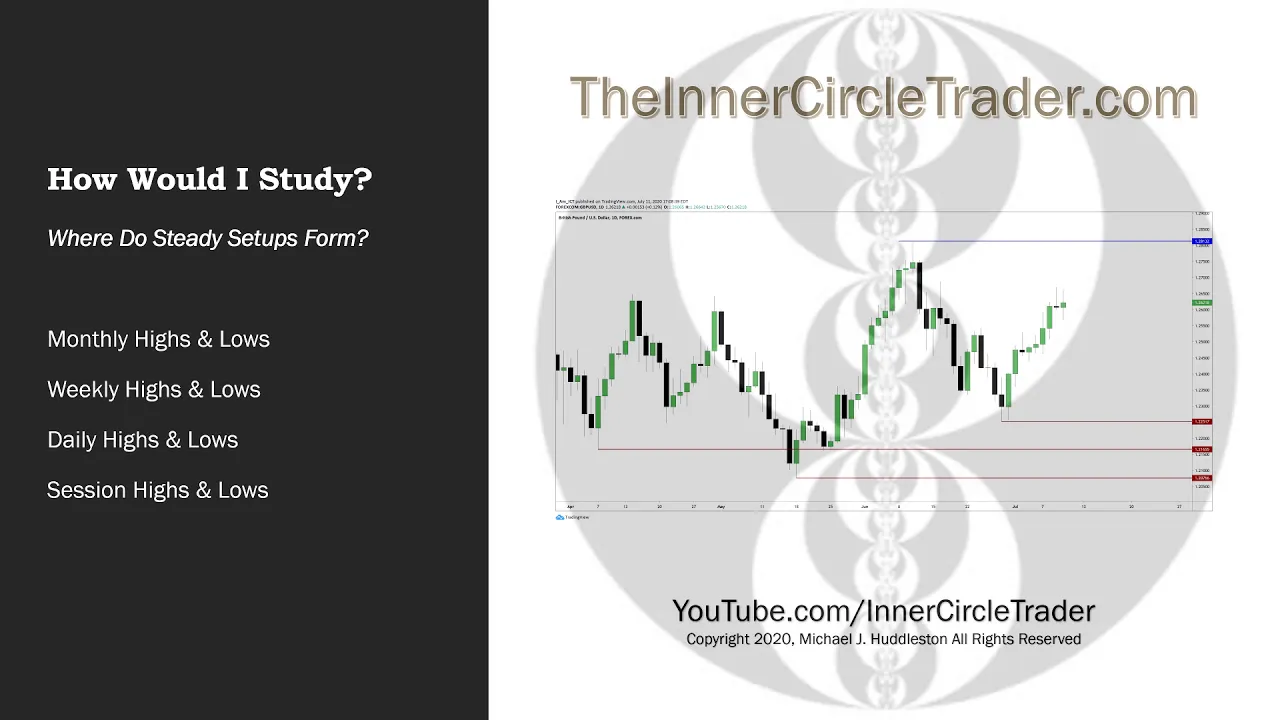
so in a nutshell what we're asking is where do steady setups form because if you can come to this realization that there are steady setups they do form repeatedly and they are reoccurring then you have a steady supply of potential wealth making setups now you're going to lose trades you're going to you need to put that behind you because you're spending too much time worrying about what if you lose what if you win more than you lose what if you stop worrying about losing and focusing on how to manage the money and the risk and
having these repeating recurring setups that form all the time the sky is not the limit so the things that you worry about at nighttime and while you're at work these things stop making them paramount because you have enough you need to focus here where specifically monthly highs and lows weekly highs and lows daily highs and lows and finally session highs and lows if you understand the price flows that occur around these highs and lows you will have everything you need for setups you don't have to look for classic chart patterns you don't have to look
at trend lines suppose it's support and resistance you don't have to concern yourself with moving average crossovers you don't have to concern yourself with overbought and oversold or divergence you're going to waste a lot of time and many years holding on to these things because you think that's the real secret because they're in all of the books that you're buying it is not the secret they are distractions and i'm telling you you're going to lose a lot of money holding on to that idea and trying to prove that you're just doing it slightly off it
just if you just have the right settings you're going to figure it out i'm telling you you're wasting time don't do that you need to focus on price the open the high the low and the close of any interval these intervals the monthly the weekly daily in sessions highs and lows monthly highs and lows what you want to do is look at the monthly high from the last couple months i'm gonna say the last three months is a fair general rule of thumb and you want to take the high and the low and you want
to mark it out and extend that out in the future because you want to study the reactions and how the markets react around it it doesn't necessarily mean that particular price level because the books you're reading are saying that's the magic right there that's the specific level and you're going to lose fortunes using these levels trading the way you're learning them from the books so stop don't pay any attention to those things understand that these books are priming you and everyone else around the world and spends the time to read them and you're being misinformed
because you haven't considered this question yet but when you take a step back and think about it if it is exactly like these books are saying why isn't everyone else rich it's simple right by support cell resistance by resistance broken turn support short support turn resistance the markets don't work that way there's going to be some examples where you'll see it in the books but i'm telling you you're going to lose money trying to do that and you're gonna waste time forcing your will on it to possibly magically fall into your lap where it just
makes it easy and i'm telling you that day doesn't ever come so don't do it don't waste time what should be done at these monthly highs and lows is you want to see does price draw up to an old monthly high or is it aiming for it basically or is it drawing towards an old low or if it has recently went below an old low is it rallying up because it's probably rand stops and if it's rand stops in the form of sell stops it's probably going to reach for an old monthly high even if
it doesn't make it to that monthly high you still have the potential to find setups that would generate momentum in that direction you're going to develop this insatiable desire to see your trades pan out to perfection and please listen to this you don't need that michael you don't need it to be perfect you don't need perfection you're gonna have so many sleepless nights and you're going to waste all kinds of energy and time doing that thing that will never arrive perfection is never going to get there if i could shake you by the lapels and
make you understand it would be this stop trying to be perfect you don't need to be perfect to be profitable but pursuing perfection will cause you to lose multiple live accounts because you want to be right and it's not about being right it's about being aligned aligned with the order flow you want to be in sync with the algorithm you're trying to fight it you're trying to make indicators tell you what it's going to do and at this time at 20 years old you don't even understand there is an algorithm you have no idea that
the markets are rigged you think everyone with the right indicators are making money and you're wrong and it's going to be many years before you realize that unless you see this as the facts so when we look at monthly charts we want to see does price drive up into an old monthly high or down to an old monthly low because if it's reaching up to an old monthly high it's probably going to trade basically above it and reach for the liquidity that we're resting above it and or if it trades down to an old monthly
low it's probably going down here to reach below for sell side liquidity or sell stops in and of itself that is a huge paradigm shift because you want old highs and old lows to react as support and resistance and that is a fallacy you're going to see that the market wants to go slightly above and slightly below to and through remember this those words are going to be meaningful to you later on you won't understand it right now but if you spend time with these lessons you'll understand it quickly to and through weekly highs and
lows in between the monthly highs and lows you're going to have very specific key levels that are found by finding the weekly individual weekly highs and lows and you'll be studying the importance of how price will sweep below old monthly and weekly lows and then gyrate up and down but reach for an opposing weekly higher level now in this chart you're seeing the monthly levels highs and lows but i've also annotated where the weekly highs and lows are now the blue levels i've only put those on here to differentiate highs in the red levels or
lows it's important for you to understand that in your charts when you're laying out your charts you want to have specific colors to reference highs and lows because if you don't do this you're not going to understand what i'm showing you here when the market is able to break above the blue levels what that is indicating that is it's able to trade higher and through old highs now how it trades above old highs or in this case the blue lines gives us an x-ray view in terms of the underlying pinnings of the market is it
really bullish or is it just reaching for liquidity and then rejecting because if it's taking out multiple blue levels on the upside that's actually showing an underlying bullish narrative that's in play and it's going to be reaching for a higher level pool of liquidity not just simply reaching for a weekly high it may be reaching for an old monthly high and vice versa everything said for the opposite if the market starts to break down and takes out multiple red levels which would be indicated by a weekly low or series of weekly lows and or monthly
low then it's showing relative weakness and it's able to break through not just one old low in the form of a weekly or a monthly level but it's going down multiple monthly and or weekly lows so it's seeking some form of higher time frame liquidity daily highs and lows when you get this lesson you're going to see there are setups every single day now it's important to understand that while i'm outlining the potential for everyday setups you are also going to blow many live accounts trying to day trade and short-term trade every single day and
you're going to find there are actually better days to wait and i'm going to talk a little bit about that in a couple of minutes but for now just know that being content with profitability early on in the week is ideal and taking new setups late in the week typically thursday or friday after being profitable this is going to be problematic for you because you think that you're going to be able to do this every single day when you're first developing and that is a misunderstanding on your part because you're falling in love with the
idea of winning and you're not falling in love with being process oriented you like being right and it doesn't matter how much money you're making you are falling in love with the idea that you're correct that you're better than everyone else and that's going to be a trap for you you don't see it right now michael but it's going to be a trap you think that you have to do this every single day and it doesn't have to be done every single day in the future you're going to find a great deal of comfort by
not taking trades right now it feels uncomfortable to you you don't feel like it's right to be outside of the marketplace the markets are open so therefore you should be in there trading that's what you think right now but you have not understood the potential risks that are involved in this yet you're too fixated on the money so you have to understand that when we understand the daily highs and lows offered the potential for draws on liquidity and that means the market will likely go above old daily highs to reach for buy stops or below
old daily lows to reach for sale stops not every single day is the market providing that opportunity some days there's consolidation some days it doesn't even trade to the previous days high or low and you have an inside day other days you'll have an outside day which is it's trading above the previous day's high and below the previous day's low and you're going to learn there's a lot of things that are relatively significant when it comes to individual days that form like that but that's outside the scope of this discussion i want you to take
a look at this chart i have included the vertical lines that delineate each daily range now when the market trades through multiple blue lines it's indicating that it has strength to break old daily highs and when the market trades down below old lows in the form of the red lines it's showing willingness to go lower and it's showing bearishness now it seems obvious but that's really not what i'm trying to get you to understand here i want you to see how the market reacts once it trades below the red lines if we are bullish and
we think the market is likely to go higher we want to see the market spend little time under the red lines and then once it goes back above the red line it needs to trade back through a blue line at least because if it does that the algorithm will change its state of delivery where it will no longer see a necessity to go lower for liquidity on the downside it'll start to seek liquidity on the upside and vice versa if the market trades above the blue lines which is an old high of some capacity once
it trades above that blue line we want to see it not spend a lot of time there then break down back below the blue line and then seek a run below a red line which is an old low then the delivery state will change from being bullish to bearish and then the algorithm will then seek sell side liquidity which is below an old low or below a new red line what i just said to you you're not going to pay attention to the first time you hear it it won't mean anything to you until you
start studying it you're spending hours every night looking at tweaking rsi settings stochastic settings macd settings and the right moving average crossovers and all of that stuff are distractions none of it's going to work it's not going to work you're going to find later on the times that you were right early on you were absolutely lucky buying in markets that were just predisposed to go up that's it that's all this is and it's not going to feel good when you find this out it's going to feel unsettling that this is really what it was that
you got lucky for nine months you are going to get lucky but you're going to feel like it's skill you're going to feel like you figured it all out and then it won't work everything you do will fail and then you're gonna start using trades without stops and you're gonna lose money faster and you're not going to want to talk about it and you're going to go through a period of depression and i'm telling you how to avoid that but you have to listen to me michael if you don't listen to me you're going to
go through that long period of six years of frustration faking it like you have it figured all out but internally you're gonna be dying inside it's avoidable if you listen if you look at these individual days the vertical lines delineate those separations between the beginning and the new day and the end of a day and starting another when you look at price like this it creates a grid now the algorithm is going to look for sell side liquidity below old lows and buy side liquidity above old highs what you want to be focusing on on
is the times when the market will change its delivery state from bearish to bullish how does that happen the algorithm defines it by what i've shown you here if it goes below an old low and goes back above it you have to see it trade back above an old high once that happens the algorithm will change its delivery state and then it will now seek the opposing liquidity in other words if it's just recently taken cell cylinder quality out it's going to be looking for a form of bicep liquidity because that's what the algorithm is
doing it's not able to see your particular stop you're going to feel like it does and you're going to spend time on the internet telling people preaching to people that it is seeking your stop and everyone else's thought because it can see that particular stop it can't the market cannot see your individual stop the broker can but the algorithm that delivers price doesn't see it so we might be arguing semantics here but the point is this the algorithm understands where that liquidity is and it's going to trade to that because it's offering smart money high
level central bank level not mom and pop not ubs not credit swiss not city those traders no goldman sachs none of those people are who i'm referring to there are it's above that they're wrong on the corporate ladder for institutional trading is much lower than what i'm referring to when the market changes its state of delivery you need to be focusing in on how it will seek that next level of liquidity we've taken cell side liquidity out great wait for a old high to be broken that's these blue lines so if it sweeps below a
red line and goes back above the red line okay it's a stop run but is it a buy because of that no you have to wait for it to take out a blue line now don't get so wrapped up in the fact that we have red lines and blue lines because you're going to look at this and say which lines do i use it's going to be whatever line is appropriate at the moment for instance if you're looking at this low here we've ran below this low here we ran below it we went back above
the red line here until we get above this blue line here we will not have any reason to be a buyer because it has to trade back above an old high which is a blue line by itself it just gives you the stage in which the delivery state at the algorithm it won't want to move higher it won't send a displacement in the marketplace higher until it does this this is like the first stage that you're waiting for once you get this then you can go in and start looking for more specific criteria to look
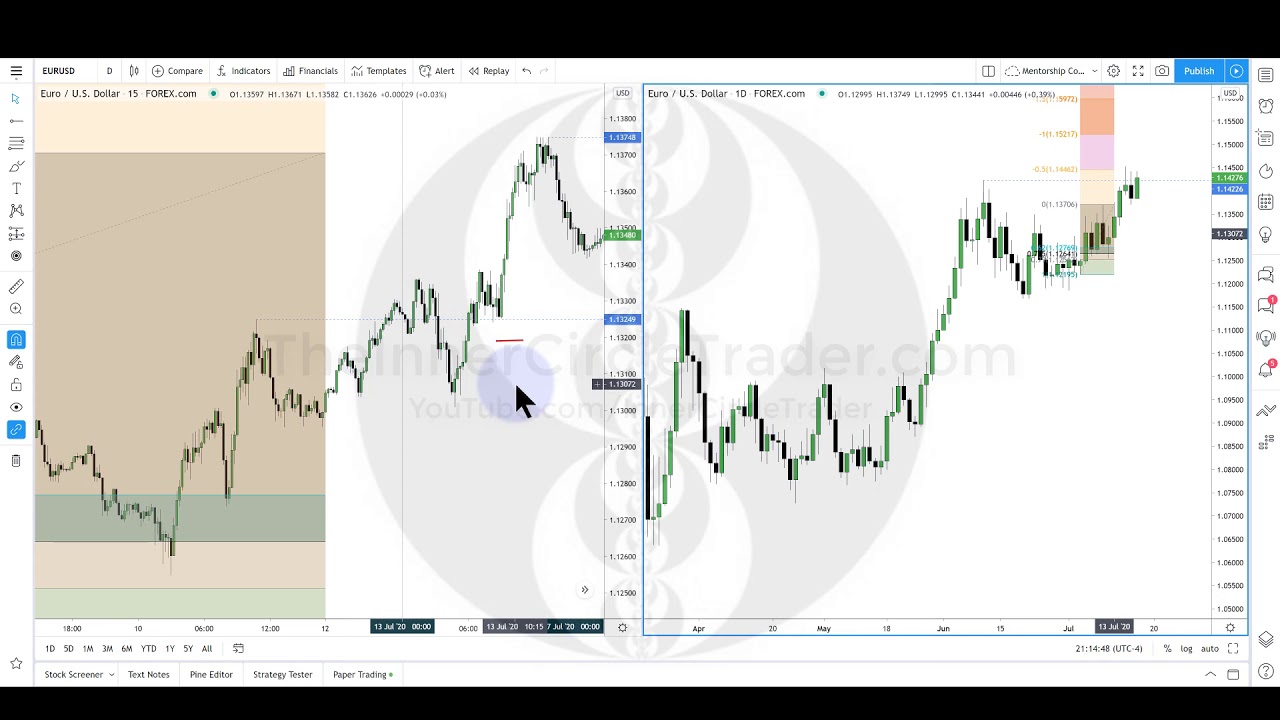
for setups it's again it's not an everyday thing but this is going to give you the choicest setups this is the one that will give you the ideal setups for that particular week yes that particular setup that week all right session highs and lows the importance of these times of day in concert with what i've already outlined if we know that the market has changed its delivery state in other words the algorithm has already taken salsa equity out the market will likely want to go higher and reach for buy side liquidity we can see that
occurring in here so we have an old low the market trades down below that it trades back above the red line but at all this time period in here does it trade above that next blue line up here which is an old high no it hasn't done that yet it does it here it runs through now once it does that your eye needs to go back to where it started from which is down here so this run here is an impulse leg you're going to anticipate a retracement and it's going to retrace back down you
do not think it's going to go back below that low because it's already left the red line it's already done its job over here it's swept old liquidity now we went above it it's in a consolidation this run here is what you wait for then you start waiting for time of day time of day is the london session between two o'clock and five o'clock in the morning eastern standard time in new york session between seven o'clock in the morning to nine am eastern standard time on this chart there's a green level indicating two o'clock at
five o'clock in the morning and then seven o'clock to nine o'clock in the morning is the little red line all they are little markers to show you what this looks like when the market trades down into the impulse leg you're going to feel nervous when you start trading like this but you will quickly see how nice it is to trade with these movements when the market drops down below the blue line we don't think of that as a false run here and break down because the state of delivery is changed over here it's taken out
cell's liquidity it's consolidated and then it showed its hand here so the impulse leg is the willingness that it wants to go higher then you wait for it to drop down into a low that forms performance between two o'clock and five o'clock in the morning eastern standard time and then the ideal scenario is to wait for it to create an impulse like there now you can trade that but i'm telling you you're going to have at least three and a half years of hit and miss hit and miss hit and miss because london has a
lot of rolls to it so you want to focus right away just trading the new york session it's going to be the easiest one and later in the future you're going to find that you're actually going to be teaching everyone around the world that this is the session they should be starting with as a new trader this low to this high that's your london impulse and then it retraces back down into seven o'clock in the morning to nine o'clock in the morning it's going to create a low there this is what you were going to
teach the entire world as optimal trade entry or we call it today ote this is the setup for the week that's ideal it's easy and that's the one you wait for much in the same way the previous week on that wednesday same thing here it trades back down impulse leg retraces back into the new york session this is the ote or optimal trade entry and price runs aggressively higher so when you see how the time of day day of week and the changing in the state of delivery for price after it runs below a key
level of sell side liquidity you wait for a specific signature in price when it takes out sell side liquidity and starts to rally it has to break an old high otherwise it's going to remain in consolidation you're going to struggle and beat yourself up trading and consolidations not knowing this so i'm trying to teach you now michael how to avoid all that pain how to know what to look for this is what you're supposed to be looking for everything in this example for the british pound can be done on a stock it can be done
on a futures market it can be done on any other foreign exchange pair it's universal i didn't pick any specific form-fitted highs and lows i went through a series of just the time that was shown in these charts i put the highs and the lows on and that's it and i'm showing you how you're going to pick that one shot one kill every single week that one shot one kill setup that you're waiting for that the entire world always wonders how does ict know that one particular setup was going to happen that week and they're
all going to clamor and they're going to email you hundreds a day are going to come to you asking please show me how to do this one shot one kill and i'm time traveling and telling you right now michael this is how it's done i'll be back next saturday to talk to you until then keep studying