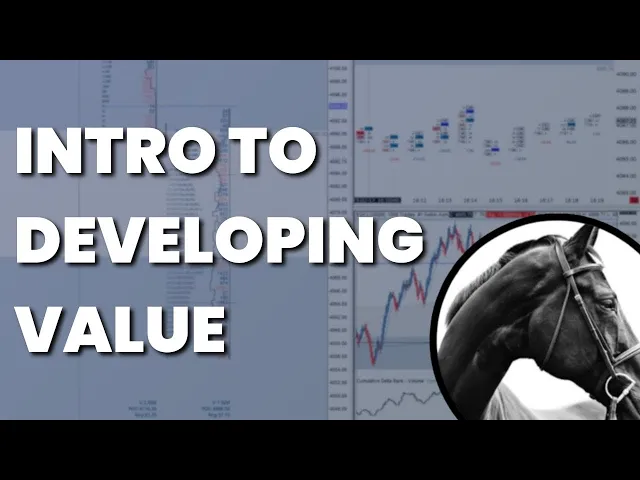
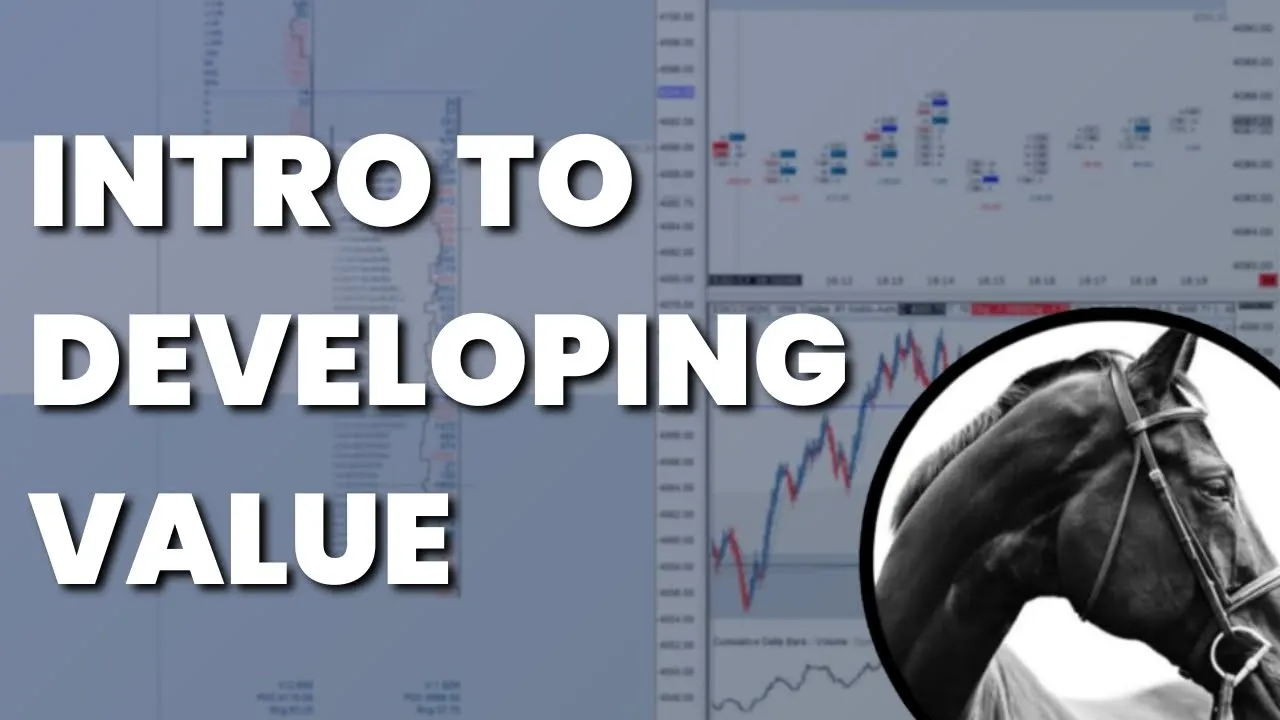
so some of the things we're going to be talking about quite frequently are the terms you find right here so the value area the value area high the value area low the point of control and developing value now for the sake of this video when we refer to the value area high the value area the point of control we're going to be talking about the TPO value area so we're going to have a separate module on the volume profile which you're going to find within here as well we're going to talk about how we use
this with the TPO value area and with the TPO structure as a whole so in this case the value area is the Zone where 70 percent of the participation fell Within so what we're looking at here is what I have designated between a color change okay so I have it delineated as white that is the value area this is where we spent 70 percent of the time meaning if you fell within the structure you fell within essentially as close to agreement as possible so where seventy percent of the participation fell within this is a Zone
you could think of the value area if you were thinking of for example let's say a normal gaussian distribution so balance distribution in this type of distribution 68 of the values fall within one standard deviation of the mean so a very balanced distribution and you would say that this portion 68 in this case set up for this chart 70 70 would be the value area so anything that fell within that anything that was close as close as possible to the center of that would be considered more and more fair value right so this is what
we really pay attention to okay we pay attention to how we are rotating within that how we are responding to the exteriors of that and so forth we're going to get further into that so the value area is where 70 of the participation fell within so since this is a TPO chart when we unravel this where we spent 70 of the time throughout the day very simply put okay anything that's marked in blue represents essentially an outlier it represents a move that is outside the norm in terms of that day's events so the value area
high that's just the Range High of that so if we're looking at a single daily session the value area high is the high of that value area and the obvious opposite can be said with the value area low which in that case is the low of that structure now the point of control that is where we spent the most time so the point of control is where we spent the most time the highest concentration of time and you could essentially say that this is as close to fair value and the point of agreement as possible
and an even better case can be made for this when you see that this is confirmed by the volume point of control but for now obviously we're just talking about the TPO point of control so this is where the highest concentration is found and I have this designated by this red line moving through the course of this profile now developing value this is how value is changing over time so essentially what we're talking about is how value is changing from one day to the next are we in Balance are we still within the prior days
value are we continually having these overlaps do we have days where we're moving outside of value where we are having one day within balance and the following day the entire value area is above or below okay this is indicating the value is being established at new levels so most of what we pay attention to when we're looking at a TPO chart is actually this value area okay if you look at a balanced profile let's say that this is as close to a balanced profile as we have right here you know if we go back to
here this is the most balanced profile that we have okay when this is in Balance this is what we say is buyers and sellers in relative agreement so if we open this up you'll see that it's pretty much both sides and even participation we have this mean reverting behavior and it creates what is a very fair valued even distribution range okay now the concept with the value area and in auction Market Theory we cover this in the roadmap modules so we talk about how when the market is balanced let's say the market is moving sideways
over a period of time so we'll combine these two structures for example so this structure with the prior when price drops away from the point of control and towards the low of the prior day's value what we look for is a responsive buying activity and I've used the the example before of if you had something like iPhones let's say iPhones or a thousand dollars and when they drop in value you would want to see that they didn't spend too much time at those lower prices if demand was there we should see them being bid up
very quickly so we cover this in the roadmap modules this is just the concept of auction market theory and how or why these value areas are useful but the value area is where the bulk of the activity is occurring okay so what we're looking for over time and a lot of what TPO and Market profile trading is is short-term oriented so most of it is focused on The Daily session is we're going to be paying attention to where we open up within the prior days value or outside of the prior day's value and look to
these levels for a certain level of response so if we are within a balanced structure we would expect that the market would continue to range so we would expect sort of a responsive buying activity at the lower value and a responsive selling activity at the high just to put very simply now the value area from something like this to something like this is telling two different stories so using this as an example and then this structure and then this structure now this is a value area that represents balance right more of an indication of balance
right here than you would have right here okay they both are value areas so they both indicate where 70 of the participation was found where we spent 70 percent of the time rather but they're two entirely different structures okay a market that is ranging is going to have a value area that looks more like this even distribution within the entire structure more towards the midpoint so we will normally have the point of control being relatively towards the midpoint open close not too far outside of value we're looking at relative balance when a market is trending
what we would say is that the market is constantly reevaluating value at newer prices so a trending Market is a market that is not accepting prices one side is not accepting the current prices in a balanced Market such as this or this the market is in relative agreement okay so we would say that within this value area buyers and sellers are in relative agreement no one side is really doing a tremendous deal we're doing a lot of work to push around the other side we would say that they are again in more or less relative
agreement that is a balanced structure that is a balanced structure that is a balanced structure structures like this which should immediately become obvious when you're looking at them and this is the benefit of using the TPO are structures that are not balanced okay what they are again is value being reconfigured and redetermined at new prices there is an imbalance so a structure like this is considered a balanced structure and this is what we're going to be referring to when we talk to it's one example of an imbalance structure now imbalance structures come in many forms
and we're obviously going to be covering more of those moving forward but this is primarily one of the backbones that we're going to be building our entire approach on we're looking for where value is developing okay over time where is value developing we're not just going to be looking at a single day and that's the benefit of looking at something like a TPO chart if let's say that we're only coming from this location and we are closing right here none of this has happened yet okay we know that value has just come from a trending
period and is now in relative agreement okay so if we open up this structure we could actually see that it's in relative agreement right it is essentially the market moves from a period of consolidation to expansion and then to consolidation again and now the market is in relative balance what we're looking for is how the market behaves relative to yesterday's structure essentially so what you're doing with TPO is not essentially trying to predict necessarily how this day is going to unfold which we'll go further into as soon as we get more into things like the
initial balance and that opening up within context or through certain levels but we're looking at how we behave relative to current previous levels previous areas rather previous sessions so over time if the market has been moving within a range this gives us a very easy structure to look at because now we don't have to look at a structure on a Candlestick chart or we would do something like this so we look at a chart like this and we see that the market has moved from balance to imbalance to balance again but we don't really have
a clear idea about where the most agreement occurred within the structure where the most volume occurred now when we use something like the TPO what we can do is actually just combine these okay so we're going to combine these and see over time where value has been determined to be right or we're going to determine rather where value value has been established okay what we're looking for is where buyers and sellers are in agreement because what we can do from there is begin to sort of designate the areas that we're going to look for responsive
activity by the other side of the market when we roll into it right so this is the concept of developing value where is Price being accepted where is Price not being accepted okay in the areas outside of value we want to see that there is an immediate response okay if the market is going to remain in Balance if the market is going to remain let's say auctioning sideways or within a range we want to see responsive activity by the buyers we want to see responsive activity by the sellers and this is just one of the
things we're going to be building off of moving forward constantly looking for where value is developing over time how value is Shifting is value shifting upward is it shifting downward do we have overlap do we have cases like this where you have a value area that completely exceeds almost the entire prior day's range okay so we have the value area here new value area begins here and is constantly at this point migrating upward this is one of the signs of a strong Trend when value is constantly being determined at higher prices if the trend is
upward and if it's a strong downtrend the value is beginning to be determined at lower prices okay the market in agreement will have multiple days of back to back inside value so what that might mean is for example here's your balance day here's a day that opened up within value writer opened up slightly outside of value cross through the priorities value and again you could see that since this level is essentially where buyers and sellers were in agreement as soon as price gained acceptance back into this level it sort of got back right into this
meaner voting behavior so move from the low to the high back down to the low and price is just kind of oscillating within this groove what we're going to be looking for moving forward is how price again responds to these extremes do we move through value impulsively are we getting rejected constantly all these things we're going to be looking for and we're going to be looking for these behaviors with respect to where the value has been determined over time