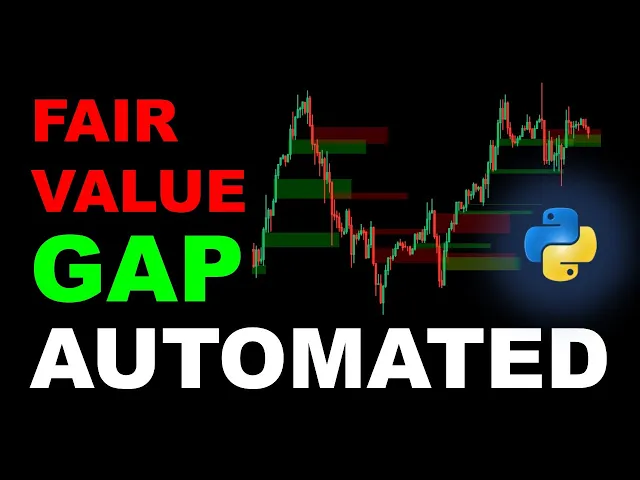
hi today we will go through the fair value Gap indicator and how to automate it in Python so we can detect the so-called gaps automatically and include them straight into our algorithmic trading strategies if you are interested in the coding part you can also download the python code for free from the link in the description of this video so how to identify a fair value gap on a chart a fair value Gap pattern is formed by three consecutive candles candle one represents the initial move of the price it sets a starting high and low values
C C two is the momentum candle it's usually a strong push in One Direction leaving a gap and candle three which is the reference candle it doesn't fully close the gap from candle one so its minimum is still above the maximum of the first candle and so the Gap is identified as this non-covered distance between the maximum of the first candle and the minimum of the third candle if the price moves up too quickly it may leave a bullish fair value Gap and if the price moves down too quickly it may leave a bearish fair
value Gap in reality price is driven by market orders and limit orders large institutions such as Banks and hedge funds Place orders in a way that create inefficiencies fair value gaps represent inefficiencies where price moved too fast meaning liquidity might not have been fully collected and apparently the market often revisits these areas to fill the orders left behind in other words the fair value Gap is a concept that helps us identify imbalances in price actions these gaps can indicate areas where price might return in the future to fill or correct the imbalance Traders can use
fair value gaps as potential entry points because they believe that the price usually retraces to fill the gaps before continuing in its original Direction and the gaps themselves act as areas of support or resistance where institutional orders may still be active now let's move on to the uh coding part and see how to write this in Python so this is our jupter notebook file um importing pandas reading from a CSV file the EUR US dollar candlesticks 1 hour time frame from 2020 up to 2023 so this should be enough to demonstrate if the algorithm is
working I'm applying some quick cleaning removing rows or candles where the volume is equal to zero and then we're adjusting the format of the GMT time uh column in case you need to use it then this is where the magic happens actually I'm defining a new function named detector fair value Gap it takes a data frame it takes a look back period of 10 candles by default and a body multiplier of 1.5 we're going to explain these parameters within the function first of all we're going to compute the signal if we have a fair value
Gap in a list so this is where I'm going to append the fair value Gap occurrences and then we're going to add these as a new column into the data frame but for the first two candles we can't compute such a fair value Gap uh indicator because we don't have any previous candles remember that you need at least three consecutive candles to compute whether you have a fair value Gap happening so this is why the first two values are none for the first two candles then we're going to check for the rest of the candles
or the rest of the rows in the data frame so for I in range starting index two remember it's zero base so index two this is the third candle in the data frame up to the length of the data frame and we're going to just extract the first high so that's the high of the uh first candle in the pattern this is why the index is IUS 2 then IUS 2 again so that's the first low the middle open is IUS one the opening price of IUS one the middle close is the closing price of
IUS one then the third low and the third high are the low and the high of the current candle so that's index I remember the index is coming from the for Loop range ing from two up to the length of the data frame then we're going to need to compute the average absolute body size over the look back period The Look Back by default is the previous 10 candles why do we need this so we need the average body of a candle over the last 10 candles for example it can be five or 15 candles
but for now by default it's 10 candles in order to compare this with the uh middle candle which is causing the breakout or the Gap so this is the middle candle and this is the body of the middle candle I need this body to be above a certain threshold otherwise I will end up with an infinite number or a huge number of signals that are meaningless because simply this is like a fair value Gap that's happening but it's happening on very small movement on very small candles and on very small volumes as well and it's
not going to affect my strategy much so in order to have those powerful signals and for this fair value Gap to be uh significant we need the middle candle's body to be above a certain threshold and this is how I'm Computing the threshold I'm Computing the average uh body size of the previous let's say 10 candles and then I'm setting a threshold that's body multiplier times the uh average body of the last 10 candles in other words this condition appears here so if we have the third low above the first high and then the middle
body above the average body size times the body multiplier in this example it's 1.5 times the average body of the last 10 candles so if the current or the middle body is above this uh quantity then this fair value Gap candle is accepted this pattern is accepted and this should be applied for both the bullish and bearish fair value Gap patterns because if you read online the description of the fair value Gap pattern they always mention this sentence that the middle candle or the candle where the fair value Gap is happening should be a strong
movement candle and this is one condition numerically or one way to uh Define what a strong movement candle uh can be in terms of numbers so the average body size is computed here then we have a condition if the average body size is equal to zero so it's not positive then we give it a synthetic value of 0.001 then the middle candle's body size is the absolute difference between the Middle close and the middle open values and then we have the conditions for a bullish fair value Gap and the conditions for a bearish fair value
Gap and whenever we have these conditions verified we're going to append to the list of fair value gap which was defined here um the topple named bullish then the first High Val value the third high value and index I in case we need these values to be used later on in our strategy but we're going to keep these in memory somewhere in our list if we don't have any conditions any patterns we're going to append none to the list and this is it this is the function that's going to detect the fair value Gap I'm
going to execute the function the cell and then we can uh Define a new column data frame fair value gap for example we call the function and we're going to run it it shouldn't take too long and this is how our data frame looks like now so we have the GMT time open high low close and the volume columns and now we have this new column fair value Gap wherever we don't have any fair value gaps happening so we have none and when we have a fair value Gap confirmed like a pattern so that's the
third candle in the fair value Gap pattern on the third candle's row we have this topple so we have a bullish happening with the uh low so that's the first High then the third low this one and then we have the index which is two so as you can see we can verify the index here and this one is another one it's a bearish one bearish one bullish one so we have these fair value gaps happening if you need to be more selective you can increase this value so the condition on 1.5 so for example
the body multiplier should be at two for example in order to increase the minimum allowed threshold size of the middle candle's body and here I've added a cell to visualize the signals on the chart so as you can see we have a bearish fair value Gap happening here this is colored in red another bearish one Happening Here uh this one is a bullish one and this one is a bullish one so I extended the length of these uh rectangles uh a bit to the right to see what's happening to see if really these uh areas
are AC as support or resistance levels and as you can see sometimes it's true actually this price for example is going up here then it's bouncing uh on this fair value Gap area almost it's Crossing it then uh reattempting to cross it in the up Direction then once it goes up it bounces exactly on this area before continuing its uptrend momentum however this is not entirely true for all these areas but anyway the algorithm is working uh well so as you can see here we have the pattern with three candles and the highlighted area is
in green here because it's a bullish signal it's a bullish fair value Gap is actually the difference between the low of the last candle and the high of the first candle so IUS 2 as you may have noticed this is just the indicator we didn't apply any back test I wanted to keep this video as simple as possible to focus on the pattern itself let me know if any interesting strategies you are using following the fair value Gap indicator maybe we can back test these strategies in the next videos and until our next one trade
safe and see you next time