Hi everyone welcome to this quick tutorial on data modeling and how that can be implemented using power bi now when we talk about data modeling one of the things which we are importantly talking about is the relationships now when you talk about your relational database world in symbol terms what we can understand is That you normally when you talk about data modeling you have a facts table and you have a dimension table so let's quickly understand what do you mean by your fact table or what we talk about table which has measures or which can
be your calculated values and then you also have your dimension tables which are holding your data so for example you have a dimension table now we can understand that with simple examples so this Dimension table might have say five columns let's take a simple example so let's say we have a customer id we have the name we have the location of the customer what products the customer bought and the country of the customer so here you can see the customer id that would be the primary key column Which is basically uniquely identifies the data here
and this is what i am talking about as a dimension table now i can have then specific data for product table so that would basically have more information or specific information about different products so here do we have the products which are in the customer table which basically talks about what are the products the customer bought and here i can basically have a Product id so that's the primary key column for this table and then you have your product description which is basically the product name and then you can say the product quality high quality
low quality and probably the price of the product so this is one more dimension table now you could have another dimension tables which could have a link to this table so when we Talk about your schema and if we want to understand data modeling so there is what we call as your snowflake schema and your star schema so when i say star schema in simple words it could be understood that you could have multiple dimension tables in this way and then you have a facts table which basically has information so i could say there is
a customer id here you have your product id here might be you have something else which Talks about location id if you have a specific table for the location which is based on country so you have location id and then the country name if that's one table so you have location id and then you can have some measures or columns which are nothing but calculated values so when i say calculated values might be it is quantity might be it is tax amount and so on so You have basically relationship so this is your primary key
and you have one relationship here you have product id you have one relationship here you have location id you have one relationship here and probably this one also relates to a particular column which has a relation so this becomes your fact table and these are your dimension tables and that's what we mean by Your star schema in simple terms where you have a direct relationship between the dimension tables which basically contain the data and your facts table which contains the measures now dimension data can have a lot of values which could be a unique or
could be duplicates now that could again have your fax table fax table could have repeated values so you could have Product id and location id and same product and location id but might be that belongs to a different customer id so you can have different entries so that's your star schema now if you talk about the other kind of schema then that is your snowflake and snowflake basically means that you have another dimension table but that is not having a direct connection with fact table so for example here i'm talking about products And then this
particular product is related to a product sub category so might be i have one more column here which talks about sub category of the products and here you have the table which has sub category id and then you have basically details of that particular product might be it is a luxury product might be it is a consumer product or whatever it is so always when you have the main key so these becomes your primary key and here You are talking about your foreign key concept or say for example you have these as your foreign keys
because this one or your product id is basically your primary key so you could have these columns which can be taken so if you have in simple terms either you have a star schema or you have a snowflake schema wherein your dimension tables are then connected to other dimension tables but some Dimension tables have no connection between fact and dimension so if you are pulling out information which is about a product and a sub category of that then you would have to connect your fact table with dimension table so this is in short brief about
your data modeling which we need to understand when we are defining relationships now we can have our data sets which can be coming in from different sources we may want to connect Them so that we can access the data from both of them and then we can basically have a consolidated information so what we can do here is let's look at an example so other than our regular data let's load some interesting data now here i have a scenario where i was using a different tool but then we are investigating or we are doing some
threat hunting now you have the data which comes in from different Sources so let me just show you that so for example if i look into the data here and this data set or these set of data sets i'll show you the github link from where you can download all this data set you have to just go ahead and type say bot sv1 data set and you have basically the full data set which can be downloaded which is huge or you have the attack only data set now this has basically your windows event logs it
has Firewall related events it has dns or http and you have other data here so this data can also be used to basically join your different data sets and create a relationship because what we know is the data might be coming in from different sources but then it has certain fields which have a connectivity between them so we can use one such data set or couple of data sets so if you would want to Download this you can directly download these attack only data sets or what you can do is all these source files are
available as json or also as csv source type that's where i got the data from so you can use this so for example if we have the data coming in here and say i have data coming in from firewall that is fortigate you have data coming in from http stream or http dns you have windows Event log and we can take up these data sets and see how we can basically use them now say for example you are searching for the http data and then you would want to find out how many source ips are
there or how many destination ips are there and then what kind of information it contains so let's start with some data set here so for example let's say get data i will use excel i will get into the Data types i can choose all files and let's go for the first one just to play around with this one let's see what does this contain now this is a huge data set fortigate event that's mainly for firewall related data so let's open this now obviously the data is huge it shows whatever we have based on first
200 rows which we see there is a serial number there is a time source what is the protocol which was used What's the source type you have host you have index you have splunk server and then you have the raw events which are all in one column which obviously we can split and create different columns based on our requirement so before we do a load of this data let's go for transformation which brings our power query editor now we have the serial number are we really interested in this so i would say probably not so
i will just go ahead and Remove this column so time is fine you have time which can be then split as per time zone you have source you have source type which we know it is coming from fortigate event i can keep that just in case i would later want the information to be understood i have host i have index now this is where the data is coming from and i don't need this so splunk server let me get rid of this and then i have the raw data which we have seen earlier but let's
go ahead and Split this because if you just double click on one value it tells me that it talks about the time it talks about an ip address it says date it has a device name device id login id type so it basically gives me sub type it has user statistics and all this so let's play around with this one and i'll break this or split this so what i can do here is i can go ahead and select this and i can choose split and i can go by Delimiter now delimiter can be chosen
and i see that there is space as a delimiter and i calculated if i look at the event i can divide that into nine different columns but rather than going by delimiter i'll go by positions and it basically says these are the positions you can anyways change the number so it says something at 16th position and then 30th position and so on so you can do that You can just say okay now what does that do it has basically replaced my data with different columns now that's based on the positions so then we can basically
transform it in a better way so for example i have these two which says august and fifth but let's see if we have any date field here which says i have it talks about august 5th it talks about the time so what i can do is i can actually get rid of this one So i can say let's choose this let's choose this and let's go ahead and remove these columns so that's gone so you have time you have ip addresses and let's basically look at this so i have this time i have the date
and then i have time again so let's select this and this And what i have noticed or i have seen already that the time what you have here and the time what you see here as the event time is the same so let me go ahead and remove these columns too so that's also gone now we have the date as the column so i can remove this one and what i can do is this one i can rename as date so let's choose this let's give it a name let's call it date and that's your
date now this one is your time so let's change this to time And we can make it time so that's done now here i have the ip address so for example let's just call it let's just rename this and let's call it ip address so that's also done now let's see what else we have so we have a host ip here and then we had an ip which shows up so i do have this and basically these Values should be same so what i can do is i can in fact get rid of this one
also remove this so date is fine time is fine you have host now these are your device names so let's basically give a name to this column so i can say rename i will call it device name and that's fine what we will also do is it will be easier to check so we can replace this so i can say replace values And let's give this pattern so i'll say device name equals and i want to just remove that so let's say okay and your device name is gone similarly you have device id let's do
the same thing so first let's rename it to device id so that's my device id and here i will replace this so i will say replace values and let's say device id equals has to be replaced or should be gone so that's also done Now you have your login id so let's get rid of this column so i will remove this and then here i have i think it should be log id or login id so let's rename this and let's call it log id so that's also done now we can change this data types
so we have some raw event here which says type is event sub type is system so We can split this again so let's take this let's do a split and let's call it by say delimiter so i can basically split it with delimiter and that's going to create four columns if we use equals or i can go for position for example let's go in here and let's try doing a split and this time let's go for Position and here it gives me some positions so let's say okay so it's giving me some error please enter
a value so let's say 4 5 9 10 let's say 10 and let's say 11 and then you have a space so let me just choose this and check how it works so you have your subsystem type Which is fine but then i lose my event so i don't want to lose anything so let me cancel this let me cancel this okay and we have the data here let's say type is event system is subsystem and i can basically have the information here but then let's go ahead and ignore this because this one would not
be really used in my search so i can in fact remove this or i Could have said type and it will have event sub type will be system but that's going to remain same so let me remove this column now again i have raw format which talks about level what kind of information it is is it information is it notice you have root id you have log description you have interface so let's go ahead and split this one so let's do a split let's go by positions And we have the positions here so let's for
example take position of the characters here so for example the first one could be you have 5 and 6 18 so let's say 18 and then let's go for other values so that's again your let's go for say 28 And then we have 28 and 7 35 36 36 and 541 42 and you have 4 46 around 52 so let's go for 52 so what i did was the last column which we had which we were splitting by position so we can basically split based on positions or the number of characters but then sometimes in
one bit of information you Might have indefinite number of characters so choosing the splitting based on characters or positions might be inappropriate what we can do is we can do a splitting and i can go for delimiter and this time in custom i will instead of custom i'll go for space which should basically consider every space as the delimiter it automatically identifies the maximum number of columns which will be created is 13. we can Anyways get rid or delete some of those which we don't need so let's say okay and it has done the splitting
so now you have all this as level so let me rename this so you have to work with transforming your data before that can be loaded in the way you want so let this be level and let's also replace this like we did earlier with level equals and then replace it so that Becomes your information on notice now this is your vd which is related to your login so for example let's keep this so i will rename this to v d and then we can basically replace all the values here so let's call it vd
equals and then replace it with nothing so that gives me the root user I also have the description here which tells me where is this information coming from so let's rename this to log description and then once that is done we will also replace the values so i'll say replace and i will go for log description equals replaced with nothing so that gives me log description here we have interface or action so this is what we have which basically has some values now if i go into the Filter it tells me it talks about the
count or it talks about the interface or it talks about status so there are various fields now we could keep it as it is and we know that there is this delimiter so let's just call it type and that's enough so now you have the total which talks about the count or cpu so we have messages Right how many times it was used what kind of statistics it is right and we have a lot of information here which we can use and we can filter this but it depends on what kind of information i'm looking
from this particular data set i'm really going for something like totaling or something like cpu count so you always have these filters which tells me okay if you are Looking for what kind of messages you have what kind of information you have so let us have that as it is this one talks about your action or it talks about your message and so on so i would not need this so let me remove this one then i have message which talks about statistics it talks about total sessions So either i can focus on the message
or i can look at how many sessions were there so that's something which we can look at and we can do a filter so for example i can say text filters and let's say begins with and let's say Either you have message begins with we can choose one of these so either i could say total session or i could keep message or i could keep ips so i can have specific kind of data so let's say yeah so let's do one thing first we will do some filtering here so first i will say replace the
values and i can basically keep it As message total sessions and ip address these are the three things i would be interested in and rest of the things can be taken off so what i will do is here i will say unselect all then i will go for action is login action is log out i can look for the ip values i can look at message values And then you have your total sessions so if you are really looking for a count of total sessions or we could have split this data filtered it out and
created different columns out of it so let's go for because message we already have so let's go for total sessions so here i will basically say i'm only interested in begins With and let's say total session and i will just say i'm interested in total session values let's filter it so that gives me total sessions and if you see here it might affect the kind of information what you are collecting if you are using this particular filter so let's keep it dynamic let's clear the filter now i do have information about your Disk your bandwidth
not interested your setup rate so let's take this let's take this let's take this let's take disk log rate i will remove these columns then i have my other information message performance statistics not interested remove these columns So i have my list of columns now we do see that the user is root here in most cases so vd and what we can do is we can remove this because if it's all column values or common values we don't need it log id it's not relevant and i have filtered out my data with has date which
has time device name device id ip address What is the source type so this is we will keep this which can be useful and now we have our timestamp here which basically has the data but we have date and time which is given here so we can either keep one of these or i can keep the time column so that i can sort it out based on time or based it on dates so let's choose this and this Which is 6 28 this is in a different time zone so let me get rid of this
one so i'll say remove now that's basically the data which i have looks good which we can use so i will say close and apply and that's applying my changes now this is one simple data set which we took from firewall and which has Particular fields so you see there is a date field now date field is basically you can look at the date hierarchy you have year quarter month day and you can choose work on it so you have some raw fields and we can rename those so we will see that so we have
our data which is getting loaded and that's your cpu which we had we have the total sessions which we are seeing here Okay and we have some systematic information let's also go back here home and what i can do is i can go into transform just a quick run through the data so we have the ips host log description now these are my raw fields which talk about the type which talk about the total and which talk about the messages so let's give them some name rather than keeping So we can call them this is
type let's rename this and let's call it type 1 info let's call this one type 2 info and then let's call this one type 3 info did i i removed the column sorry yeah so type 2 info and then you have type 3 info type 3 info and so you see we had some raw data or data coming in from logs but we have transformed it let me just do a close and apply and that's my one data set which we have which will have these fields if you see the names right and it shows
me the kind of information we have now depending on the filters so you have these different Filters i can select all and it shows me all the information i can unselect these and i can say okay i'm interested in looking at the information where i p is 2500 and let's select that and basically then it gives me the kind of log description messages what is the type of info and again in this i have just interface information in this i'm seeing dhcp message right so i can remove the Filter but then my filter works perfectly
fine so this is the data i have and we are good to go with this one so i can basically save this if this is what i'm interested in let's call it something so let's say 40 gate event report save it And that's basically the report which i have saved with this information although we have not done any kind of visualization on this so this is good now let's take a stream http data and work on it and we can see how we can connect these so for example let's go in here so let's select
all files so we took this data now we have a traffic data it would be interesting if you would want to look at the data before because then You would know what data can be collected so if you look at this data which is in a csv format looking in excel so it's trying to read that and then we will see what are the fields which we can use to map different information so you might have some firewall information about an ip you might have the traffic information you might have the dns information you might
have the attack or the malware Information and all that information can be joined together by recreating a model which can have a relationships and then basically create visualization which relates to the data coming in from different data sets so you could do a join you can have multiple data sets and you can go for a left join right join you can merge different data sets you can do that but data modeling does make your work easier Where you can have your fax and dimension tables you can basically have more meaning to it so it says
file not loaded completely that's okay we will filter this now if you see here this also has a host information it has time and it basically talks about server and then you have your raw data which basically is your timestamp device id what we were seeing And then you have your login id like we had in previous example right and then this is basically the traffic information so if i basically take one such field here i could see what is the kind of information it contains it gives me the traffic information what is the source
protocol right so this is my one event which i'm looking at it tells me uh what was the Transaction ip what was the transport port what was the service which was used is what it was a microsoft portal which was being used uh what was the application risk what was detected how many bytes were sent how many binds were received right so this is basically giving me some traffic information now we might be able to use this if i really want to see from one particular source ip If you look at the source ip here
and to the destination ip how many bytes or how many packets were sent and that might be something which we want to query or visualize and find out if there is uh basically huge amount of data flowing out or flowing in so we can take this data so looks interesting so let's not save it and i will go ahead here and what i will do is This is my one data set so let's go in home let's go to get data excel let's go in here i'm looking at all files look at the traffic data
open obviously that's huge data so we want to transform this we can even limit the number of rows or select particular ips which we would Want to look at so as we did last time let's remove the serial number not needed time we will have in other fields so let's get rid of that source is fine source type is fine host is fine index not needed your server not needed you have the raw data which has to be basically split and this is the data which we have now we can select certain important fields here
so let's go ahead and do a split And let's go for positions and if you see it identifies the position it basically knows that there are these positions the values are at these positions which we can then merge or say for example i could have gone simply by space so if i say let's go in by split columns by delimiter let's choose space as the delimiter let's say okay And that basically gives me columns so let's go in for this one august this one so we will see if we have any time field so we
don't have any time field as of now this is what we have we have date we have time which can be merged together if we are interested in so what i can do is i can remove these columns right so it becomes so easy with power Bi where you're working with bigger data sets although the data is in structured format but even if it is not you can use all these things to basically split the data now here we have some timing so let's get rid of this one let's remove this one so there is
repeated information you have host and this one let's remove this because all the information in a raw format is stored in one particular Column so you have date and time so we can keep the date and time together we can concatenate it uh we can basically merge it and make it one so let's say first let me replace this so i will basically go ahead and rename or let's say replace and i'm going to replace all the date equals with nothing so that purely gives Me the date and this one is time so let's replace
everything with time so time equals and then replace it with nothing and then i choose this and this and i do a merge and let's call it separator let it be i can give a colon or i can give a comma or i can give a space space looks good let's call it date and time or let's say it's just a date so that's my data looks good so you have Device name you have your device id like what we had so we don't need this one which we deleted so let's get rid of that
so type you can always see how many values you have so if it is type is traffic let it be so let's quickly replace this one with device name and then basically go ahead and oh i did a remove but not to worry i can Just cancel this and i have it back so now i can replace the values here and let's say device name is replaced with just the name similarly this is device id so let's do that device id and we will still do a replacing here so i will say replace all the
values and device id equals is replaced with the actual value Now type is traffic let that be it's a type of information which might be useful for us so let's go ahead and rename this and let's call it type 1 info and here i will replace all the values of type equals there should be multiple other simpler ways of doing it you can transform the data using a programming language you can do that so this tells me there are some subtypes which are about Because we are talking about the traffic data so it says subtype
which is forward or local now that depends on what kind of information you are searching for but let's keep this so i will rename this i will call it sub type might be we can take this and keep it in a different column or different table all together so we can do that so subtype and let's say replace the values here Subtype equals is replaced with just the value then you have the level you can see what kind of levels you have it just says notice that's the only one value so let's get rid of
this one let's get rid of this one now you have the source ip you have the source port which can be very useful information so let's rename this and let's call it source ip Go ahead and replace the values here so let's say replace and i'm going to say source ip equals is replaced with everything so that's gone and now you have your source ports which could also be important so let's go ahead and rename this let's call it source port and let's replace the values source port equals and that's basically gone Now we can
go further we can look at the source and what is this kind of information so here it tells it's a source uh internal source port what we are seeing and we have some internal or some other information so there might be various other messages but all of these refers to the same key and value so let's rename this we'll see how we can use all of this information so i'll call It intf and then i'm going to replace this source intf equals is replaced because we have given the column name now you have the destination
ipn destination port very important information so let's go ahead and rename this let's call it destination ip which might be just meaning ip in some other Uh some other data set so let's do a destination ip let's replace the values now with dst ip equals is gone and the same thing here dst port that's the name and then replace i could have done that easily in excel also but then it's good to view The data and then make the changes here so destination port and then you have your this one so it basically has some
values might be we don't need this so let me remove this column and and i will remove this column also i don't need it so i Till i have my source ips and port destination ip and port which we can even merge with a particular column but let's keep it separate in case we would want to pull out the information then you have your raw information which says session ids and all that so let's get rid of this let's get rid of this let's get rid of this and anytime you can basically see what kind
of information it has so it has Some session ids we are looking at the bytes going in and out so let's remove these columns that's gone you have policy id okay and action so let's keep these so this one basically has either your policy id or destination country information and what has happened is based on the position Sometimes you see the destination id or country either in this field or in this field right so you have destination country source country destination country and source country so this information what we are seeing here is something which
has split based on the positions what we have so we have a position id Which has action so let's look at these so we have here so we have action we have policy id destination country source country and then you have these fields so what we will have to do is if we have to extract the values and create this as a new column so for example i had this and i could basically say duplicate columns and then i can basically say one can Just have my policy id values one can have my destination id
values so it depends on the kind of information we are looking at we don't want to lose any particular data here but let's see so we have action let me do one thing let's say action let's say draw 2324 destination source country so you have a service which tells you About what kind of service was used what was the duration you have to just make sure that you don't have any fields which are being missed because of the data what we have so well we have the actions policy id destination country source country what kind
of transport was used what kind of service was used and this is where it gets challenging Because you have lots and lots of fields so if you see here all these fields are nulls so first let's take this let's take this so you have fields where there might be data down the line i mean it does not mean that all these fields so you see here there is some data in the underlying rows but it depends on what is the information we Are looking for so for now i will just choose this we can do
a lot of work here but let's not get into everything let's do a remove let's just see step by step the critical ones and let's go all the way here let's do a remove we don't need this data so here we have your application category your Collaboration your app risk now this could be useful so let's do one thing let's keep this this this because remember we have a text filter which can be used to filter out the data so i can basically choose these fields as one transport let's keep this one And we will
test it so we have these fields let's take this last one yeah and let's do a merge column okay and i will basically say let the delimiter be either comma which could be useful so let's go for comma and let's call this Info so that's my data which has been split now say for example if i would want to filter out some values i do have something like this and i could basically go for text filter i can say contains and let's go for something like united and now you will see wherever your values are
united states that shows up but you can be more Specific in saying i want the destination country so i can basically say clear the filter let's go in here let's go for text filters let's say it contains and let's say destination country Equals and let's say united let's just search for this particular pattern and now you will see you have only the destination country being united states right so that basically allows you to filter out the data for now i can clear the filter so looks good we have some useful data and this is your
traffic related data what we have so let's basically close and apply And depending on the size of the data set you can have it taking some time so we could filter out we could have said okay i'm not interested in anything which goes after or before august 19th because this is i think data coming in from 2016 2017 and we can choose the year so but let it get loaded we can anyways do a transformation and we can check for information But this is how you are basically creating data sets which has different fields now
we can then change the data type as i explained we can transform this data we can basically relate these data sets and extract information out of it we can create visualizations out of it and let's see what is the size of this data so it tells me we have oh that's a huge data set let's say If you see that's almost 4 gigabytes so 88 yeah so it's a four gigabytes data set might be we have to uh cancel this and [Music] there are some pending changes but let's just let's reduce it so what i'll
do is i'll go for transformation and i'll do a transform And we have these different filters but let's go for the date field which talks about something and it tells me 2016 right so we can select this and what i can do is i can do a transform by ear and let's say i'm saying ear doesn't look good so that's only giving me how many values do I have i have only 2016 so let's do a load more to see if there are many other values nothing specific so let's go ahead and remove this okay
so i would be interested in it's all august 8th but then might be i can pick up a date which is going to reduce the data so we have eight one two how many entries we have we have Say for example 24th and i know that there is some problem in 23 onwards so let's choose from 8 20 onwards so i'm going to unselect all and then i'm going to say let's go for 8 20 21 22 23 24 28 and anything before that let's take 29 let's do a load more to check if we
are missing on any dates no so let's go for select all Right now you could go here and you can say date filters and you can basically say the month or the day right so is not latest you can choose is earliest in the next in the previous before after so if i go for after now it tells me you need to choose a particular date so i could straight away say let's choose anything which goes after 8 19 right and now you have 28 So that's basically selecting some data so we can then also
say if we want data for particular subsets so for example let's choose this now let's say close and apply it should substantially reduce the data now if you see here since i'm doing a close and apply it's trying to load both the data sets which we have and that might again take time so you Have to choose once you have transformed if the data set which remains in your query editor if that should be loaded when you are loading the other data sets sometimes if you are working on multiple data sets that might be a
bigger problem so let's give it some time and we will check once the data is loaded so both the data sets have been loaded now and if you look into the fortigate event data so that basically Has my dates and we can check that it has everything beyond 20 as we chose and let's look at the traffic data so if i look at the traffic data now this one basically has dates which are even before 20 so it is trying to load the columns and it has all the dates and what we will do is
we will try to sync the data and we will keep it beyond 8 20 like what we had in the Previous data set so let's have this one selected and let's go in here and i will say transform and i will go for transforming the data again which i forgot to do earlier or we can just reduce the data because the data sets might be huge and once you have prepared your model and if you have a bigger system then you can go for loading all the data so we have the Time and date field
here and then we have other fields which we are looking at but this one basically has time which shows up everything we can again merge this as date and time like what we have in our traffic data so let's quickly check in traffic data we have date and time so let's go in here and we have the date and time so let me Just bring it here and then we can basically first merge them so i have the date and time but we are interested only in data which is after or from 20 onwards so
first let me basically apply a filter here so we can go for date filter i can say after that's an easier way let's go in and select from 20 or let's say Let's go in here and this shows me 19 let's choose 19 and let's go for okay that should basically now give me only data which is 20 and beyond and now let's select date and time and let's merge this with a space in between so let's call separator as space and let's call it date Let's say okay and that's merged so we have the
time here which is 1158 and in rest of the fields so that looks good to me and now let's do a close and apply but remember my i'm working on event data and traffic data was already loaded and it is a bigger data set so i can select this i can say enable load again So do a continue and now let's select this where we really made the changes let's do a close and apply and that's done because this was not a bigger data set and now we can quickly check so in the date fields
we are looking at the event data so you have everything starting beyond 820 so anything before 820 is gone And that's fine with us and what we need is the the traffic data also so let's go back because that was not loaded but we really need that so let's go in home let's go to the transform let's choose this it was not loaded and let's enable load so let's check yes this is fine and let's go ahead and Basically close and apply so now it's only going to get me the traffic data so earlier we
had the event data that was already loaded so you can select data sets step by step and then load them so in that case it can be faster you can reduce the time how much it takes now obviously once you have filtered out all the data which you are interested in and that is already loaded then we can Basically create a data model which can join these data sets based on device name based on device id based on ips and we can create a link between these so now that the data has been loaded for
these two kind of sources we can basically look into the fields what these have so you have device id device name destination ip destination port and similarly you have the events here which has device id device name so we Can basically get rid of some columns or some columns we can keep them with the same naming conventions so this one basically has a date dot one field which we can change and here we have date so let's look at this one and i'm looking at the date field here which basically says state.1 which doesn't look
good so let's rename This let's call it date and remember this is a bigger file based on the time or the date or any other filtering criteria which we have chosen so either you reduce the amount of dates so that you can break it down and your processing can be faster or when you would be using say microsoft bi that would be working on a powerful machine which could store it now once this is done what we also would want to Do is we would want to work on loading one more data set so this
is firewall data and i would be also interested in http data which also gives me information of the http different methods such as you have have post you have request and so on so we can do that now this date column looks good you have type 1 type 2 type Informations you have device name which says dev name dev id so that looks good to me and let's go in here let's look into this one so we have dev name dev id so those names are fine you have your destination ip destination port you have
the host name you have the info you have source and source type So let's look at the traffic data and this is where we have your source ips your source port destination ip which looks like a dns server and you have your host ip so you can see what other information you have so if i just scroll this i have source and source type which is showing up right here in the beginning And if you compare this one so this also has a source and source type which basically uniquely identifies where the data is coming
in from and obviously we can arrange the columns in the way they look the order of those we can merge and manage them so this this looks good now let's go in here let's go to get data let's go to excel let's choose one more file And i would be interested in http i can look into this win event log which looks like a one gigabyte file this one looks like a smaller 28 megabytes file so let's take this one and that's getting loaded here we would want to transform this data okay so let's get
rid of serial let's filter that out now we can see there is this time field which is here but we can Split that out so let the time be let's not take this one let's remove this so stream source host index we don't need let's get rid of this let's get rid of splunk server now let's look at host information and that basically gives me a similar kind of server name so let's not even use This one now comes our raw field if you double click on one of these it shows me a lot of
information here and it is in the form of you have your data is separated by comma here so we can basically choose comma as the delimiter splitting the data and then you can have consolidated information so let's go ahead this one let's do a split column Let's go by delimiter and i'm going to choose comma and let's say okay and that basically shows me the column so you have your end time timestamp now these two can be merged and we can replace the brackets so that's fine You have acknowledgement packets information you have bytes bytes
in bytes out you have source ip which is c i p you have cached so we can get rid of these we can so you see there are these number of columns now let's work on this so first let's get this and this So first let's replace this so we have everything starting with end time so let's go ahead and rename this to end time that's done now just to replace values and what do you want to replace so let's use this bracket let's say end time and colon now that one should be gone so
that looks better we have the timestamp also And if you carefully look at the timestamp here so you have the timestamp which can be brought out from this one let's do a second level replace and what i'll do is i'll choose anything starts with t i can do a wildcard ending with z and let's try this and it does not find this particular pattern Okay let's do it in a different way so i can do a replace and we can basically say t should be replaced with space so now you have t which is gone
and we basically have the date and time so what we can do is it will take a little bit of work here where you have to merge the date and Time so the easier way would be basically splitting this data based on a delimiter so we have these time stamps embedded with the time so what i can do is i can go ahead here and do a split column by delimiter now i know that there is a time delimiter t so let me split by that and now i have my time which also shows that
in a date time format you have end time which is also having a timestamp so first is Let's clear this off let's get rid of this column and now the end time i can basically here again do a splitting of this by delimiter and this time my delimiter will be eight custom and then let's choose a dot here and let's split it based on the dot so that gives me the timestamp which is automatically formatted which looks good Although we have to take care if it is in our or 12 hours or 24 hours format
so now we don't need this we can get rid of this and that's the simplest way and then basically i can do a merge of this and this let's do a merging with a space as the delimiter so let's call it space and let's call it date And let's do a merging in simple way we have the data here now the time and everything can be formatted but that gives me some information it tells me packets in packets out by its bytes bytes in bytes out and we can basically club this information so i can
basically say your acknowledgement packets so if you see here you have acknowledgement packets in So these are the only values which you have and we can get rid of all these values which says accept and accept so we don't we are not interested in this we are interested in acknowledgement packets in and out and that looks good so bytes we can look at the filters and it basically gives me all the bytes value let's keep that so you have bytes in bytes out Now these we could have basically filtered out and given column names so
like we did earlier so we can just do a rename and let's say acknowledgement packets in that's going to be my column name and then let's just replace the values here which is basically going to search for ack underscore packet underscore in Colon should be replaced or should be basically gone so let's get rid of that so it's still working on it it might be huge data and similarly we can work on this one to do a replace and let's call it acknowledge pack underscore out let's choose this column let's do a replace values and
we want acknowledge packet Out colon should be replaced with space so just the values there and we have given the fields right then that should be fine so let's get rid of this overall bytes we would be more interested in looking at bytes in and bytes out so let's go in here and let's rename this to bytes underscore in and then Basically replace the values or you could keep that with a key value pair if that's what you would want to keep so bytes in with a colon should be replaced so that works fine so
this one is still taking time let's see we did a replace and we said acknowledgement packets out that was the pattern Replace it with nothing yeah so now it's working and then you basically do a replace you have to be careful with the case sensitiveness and let's replace this oh doesn't look good so let me again do a replace and i want the semicolon to be gone yeah and bytes in similarly you have bytes out so let's say Bytes underscore out and replace this bytes underscore out and then you basically have your client ip which
shows up here now do you want to go for caching no do you want to go for capture host name not exactly client rtt client packets client sum let's get rid of these so that's gone so connection type which Basically has you can always look at the values which says connection type close or keep alive not interested this version not interested so basically we can if there is a lot of information which you might be using later so you have some data packets in data packets out and let's see we already had here bytes in
bytes out Yeah so let's go in here and let me do this thing so before i work on the client ip let me take this take this take this all this information here and let's basically merge these and we can keep comma as separator and let's call it info so that's Merged and then you have data packets in and data packets out so let's quickly rename this so before doing that just check the values here so you have data center time now we have the time factor already and it talks about data packets in and
out and that's basically in values or out values so we don't need the data center values so let's go ahead And basically get rid of this so now the data has been transformed i have basically replaced the client types and all the other data which would be better if we keep as one so this remains because this has embedded information and we don't want to lose any data so it would be good to keep it here and then we can do a content search on this So this is the data which has been modified now
i already had these data sets so i can basically choose enable load i will remove this i will basically go for this one which is enable load and then i am only interested in this one so let's do a save close and apply so the changes have been made now these changes will be applied now if you see my older data sets are already here and I really did not want to go through the whole process of reloading them so i have just worked on this stream http data and i am just loading this one
so this shouldn't take much time and we should have the data loaded now once we have this now similarly you can work on all the data sets so i do have the source source type you have the dates and if you closely see here All the dates is basically beyond and it's only 8 28. so i do have information but here i am looking at the date field and that basically shows me all the fields here so looks like we have to filter out the date because that can again be whose data it tells me
there is 21 758 rows there are columns with these many distinct values so it gives me this but let's do a last level of filtering So i am going to work on transforming this so [Music] let's go in and transform this one again and here you have the date and we were interested only in 8 20 onwards so let's make sure that this is the date we have okay so best option would be first basically splitting this So let's go ahead for split this by a particular delimiter and here my delimiter will be space and
then we can re-merge the data so this is being split date one and day two now i can go here and it does show me only these dates but let's make sure so i'll say after and we will look into Oh i'm sorry so what we are doing here is we are removing this let's not split this this was actually fine because i was looking into the event data which is fine we have to focus on this one so this is where my date has it looks to me in a date string format which is
not good so let's do a split by a delimiter And let's say the delimiter be space and let's say okay so i know it will basically have these two so it basically has split the data and now what we will do is we will go in here it shows me yeah so it looks shows me all the dates which we are not interested in we are interested in only these dates well i could have said after and that would be an easier approach Yeah so this is fine now we have the dates now we have
applied this filter so let's take this column and this column again let's merge the columns let's have space as the delimiter let's call it date and let's say so we have all these values now this Column which was also extracted from here could not be merged so let me remove this so we have to spend some time in doing this data wrangling stuff and now let's do a close and apply only for this http data and now we only see the stream data set which is available here first let's confirm so we have Successfully transformed
our three bigger data sets one is http related and two are traffic and events now this is how the as of now there is no relationship between them if we would want to visualize the data which comes in from one source or joins with other source we will have to create relationship between them however we can look at the fields and we Can try to understand so let's look into the data set quickly now if we look into the event data so we have our source source type we basically have the host we also have
the date and time which is there in each of the data sets so you have basically the date here which we can see in traffic data so we have the date we have event that also Has the date however the format is little different and what we can do is we can basically look at the data we can we can see that it is in a text format and if we would want to change we can do that however date is not the concern the other fields have been transformed so we look at total number
of sessions we look at the type of information what kind of information we have what is The kind of device id so this is what we are seeing in event now in traffic i have my host name i have the date i have device name device id and these device names and device ids if we look at the other one that is fgd event so these would be same and Then you have other information which is related to traffic here so you look at the source ip you look at the type of information and then
if you look in stream http you have packets in packets out bytes and bytes out so let's basically now create a visualization taking the information from all these three now we can either explicitly define relationship or when we are creating the visualization We can go ahead with the relationship so let's go here and let me first choose your stream http so i have the client ip i have the source and source type so what i will do is i will basically say for example let's start with your event and traffic data so let's have a
merger between these so let's select event And here let's select the date column so let me bring the date here now that basically gives me the date and the time and that basically looks fine now you also have your device id so let's bring the device id which shows me the device id let's bring the device name So this is the information i want now i can get the source so that i know where all the data is coming from so let's take the source and drop it here so that basically tells me the source
i also have the source type so let's choose the source type which tells me event and then we basically have Say for example type info that is the field i have so for example let me select type 1 bring it here and that tells me what is the kind of information i have either it is a count or basically it's an action which we can basically then create some filters to filter out the data let's look at type 2 info and that basically gives me type 2 info which is Either talking about cpu or total
count so let me just get rid of type 2 info that doesn't look so interesting let's look at type 3 info and that basically gives me some total session and dh dhcp statistics so we will just keep type one info here and now i will choose the traffic traffic and here i will choose the destination ip So let's bring it here now when i do this it says cannot display the visual fix this let's go ahead and fix this it says do you want to do a auto detection of the result let's do that so
it basically says there were no relationships which were detected let's go to manage relationships and since there is huge data it has to basically you have to give the control to power bi fill up the field so it is basically Showing me the from table name and to table name and if we have some relationships which can be created so i can click on new and here let's choose event which basically has the host device name device type and so on and Here let's choose traffic now i have basically the device name and that basically
can be chosen and device name can be chosen here and i can say this shows as many to many relationship and if you see this relationship has cardinality many to many this should only be used if it is expected that neither column that is device name and device name Contains unique values so if it has unique values then you can go for one to many so we can basically go ahead here and say one to one for example but it says it is invalid let's go to one too many and again it says so the
only which is expected is many to many and choose this so it basically says there is a relationship Established between device name and device name i can also say new again choose and here choose traffic so we have device name also so let's select this our device name is already done so device id and then device id here and let's make this active i could have just said okay so let's say okay And now you have device id and device name let's also see something else so let's look at new and i will choose event
so i have all this information which is giving me the type of information what we have total number of sessions what is the performance statistics and all that but then these might not have the same columns here so what are the same columns we have So we have traffic we have source ip we have source port and then we have information which we would want to pull out but let's basically go in here and we can define a relationship between source ip and here we have the host ip so if we know that this is
the host where we are looking at So for example if i choose host and if i choose source ip now i can say okay so these are some of the relationships i'm creating and then i can you can't create a direct active relationship between event traffic because an active set of indirect Relationships already exists between these tables to make this relationship active set the cross filter direction to single delete or deactivate any of the indirect relationships first so we have direct and indirect relationships which we can choose now we have if for example i remove
this and then if i select this so i'm saying let the host and the source ip be my relationship let's click on close And now let's see let the data get populated so based on the columns which we have chosen and now we are interested in the information here so let's look at the model meanwhile so you see the kind of relationships you have created so there is basically your destination so you have the star symbolizes many to Many so we basically have many to many relationship and that basically depends on the column names which
we have mapped now if i go back here and this is where i can be seeing so let's go into traffic and let's drag and drop the type one info here and we will have to give it some time because now it is trying to detect based on the device id device names it is trying to match The value of your source which we have chosen here with the host information and those values have to be same because that's the relationship we have made active and then we will see the result because it has to
basically filter out the host name here and You have the source which we chose here so let me go back to the relationships and that's your device name device name this is your device id device id this is your source ip and host let's go back to visualization so since we have established the relationship i can select this i can delete this and i can go for visualization again so Let's now go ahead and start selecting say for example date field now i will choose the device id let's go for device name device name let's
make this bigger and then let's go for source i would want to keep the source so it tells me what is the source type Right we can get rid of source for now source type is fine and let's also go for host that basically gives me my host values and we can just to check since we have linked our host with the source ip in the relationship let's also choose destination ip source ip And finally your type info now this is basically huge data what we are looking at so it is basically saying filters on
these visuals which we can basically control so here if you see you can do a sorting you can add some list so right now we have added these filters and we will have to give it some time Where it can populate so meanwhile you can either do a show as table you can go in here and then scroll down and you have data fields here filters on the page which we can apply now let's go to the drill through so let's go to the formatting and let's go to the grid and you want to have
vertical grid so let's Switch it to on let's make it black and now i have basically your horizontal grid color so let's create that also as black now we can go for font size so let's increase that that's your text size depending on your screen and image height that's fine now column headers you can look at the font color what's The background color text size let's make it bigger and then you have your values so this is fine and now you have your totals if you have field formatting so we can choose the date field
which we have chosen and we can choose this which basically says do you want to auto align it or you want to change something you want to give a title so these are all the options which you can use for Formatting and let's go in here and let's go to the filter here so remember it is going for my when you look at the filter it is telling me these are the host ips which it will be looking for this is the source types it will be looking for this is the source ips which it
is looking for and we can either select One of the source ip depending on the count what we have here to filter out the data or it's going to be trying to match all the entries here now we are looking at a bigger data set so let me choose here a particular value for example there are three entries for this particular ip being the source ip and we have type 1 info we can see what kind of information It contains it talks about traffic now that's what we wanted based on our host and source ips
so this looks good we just need to make sure that the host field was connected to source ip so let's go in here and select let's search for something so there is a 250 entry here okay we can come back to the visual let's go back to the table here and Let's look at some data so we are looking at event let's look at the host value which is 192.168.250.1 that's my host and here let's look at in traffic let's look at the source ips sorry the source and then you basically have the host which
has the same values so host and source ib so what we created As a relationship might be we have to basically check that so now that uh using the relationship what i also did was earlier we were creating multiple relationships and that can also slow down the process so what you can always do is you can go back here and if you see i have created a relationship between host to host because i know the values can be sync in sync or same across these so if you would want to work on a relationship you
Can just go ahead and delete this and that's basically gone so your relationship is gone and now your visual report if you go back will show that there is some error because there is no relationship established now let's look at the fields again so we have this particular information which is saying that We have our data set so let's look into the stream http data set now this is where we have basically packets in packets out so we have the source and source type which basically are giving us the same information so we can choose
one of these in http and then you also have your date you have packets in packets out bytes in so you have total bytes now this is what we Can focus on or we can be looking at what is the total number of bytes bytes in bytes out so this is the information coming from http now again you have the client ip here so your client ip has 192 168 250 100 so basically let's try to match that here now when you look at the http traffic and if you look at destination ip now that's
the Basically server so you can always see what are the kind of values you have so you have different values here and this is where the connections have gone you have your source id which is basically showing up different values again so you have different source ips you have different destination ips and you have the host name which is 250w that's your only host name in this one In the traffic now if we look at type 1 info then we are looking at these columns now since the data is huge you don't see these other
columns but then we can obviously refresh and we can see if these columns are showing up so you have more number of columns which are here which will be used so you have source ib you have destination ib and so on and if we look at the information From your event you basically have your source you have your host so let's take host device device id from here now we have the level let's see how many values you have so you have alert information notice warning so we can then filter out only warning messages if
we are interested in so i could be just saying warning so we can choose level from here we have your log description which talks About kind of statistics what is the info so is it performance statistics and then you have your cpu total session so now for example let's go to visual and if i would have to create a relationship i will have to choose different fields now the only one thing which we need to understand is in stream http you have your client ip now let's look at Those values here stream http which basically
has your client ip let's look at the source and also we can work on the date field here so this is in am or pm what values we are seeing and let's have the date field in event that's also showing am or pm so let's first create a relationship Between hgt and stream http and what we can do is let's keep it here let's bring it here so what i can do is i can have from stream http a relationship with the date here so there can be date now there are these formats which we
can change if that is giving a problem let's say okay however it is advisable let me just Delete this let's go back here okay so we want information from all these three data sets and we do not want to really go with the join condition we will basically want to join them either on the date field or basically your other fields which have common values So since there were many relationships created and then we had to look into the fields which had date time format in a different way what i did was i did some
cleanup i removed the relationships as of now and we i reloaded the data so just let's look and understand that so this one starting from our three different data sets first let's look into the event by clicking on this now it shows me Source type it shows me the host that is from where the request is originating it shows me the date look at that format here and then you have device name device id what is the type of message and then you have some log information based on which we can filter out or pull
out some specific information now what we notice here is host name is 250.1 and we have only one Host field so that's perfectly fine now let's look into the other data set that's traffic which will give me some traffic information now here again if you look at the second column the host is 251 which basically means i can create a relationship between event and traffic based on host field now notice the date format has also been changed we have Device name device ids so that also should be the same values and you have the type
info so you can look into what kind of information you have and this is traffic information it looks at the sub type and that tells me either it is forward or local on which we can create filters now you have the traffic going to the source ip and you have the source port so source Ip basically has different fields and we will see what is the source ip so you have a host and then you have source ip from which the connection would be going to say destination ip so you have destination ip which have
multiple fields and then obviously you have info wherein you can say for example select one of the fields or just place your Cursor here and tells you what kind of information it has it has an action it has policy id it has destination country source country and everything is separated by comma so if you would want you can split this complete information into comma into different fields so that's your second data set and the third data set is your stream http which basically has your source type it has the date again format converted Packets and
packets out and here you have client ip which is basically showing let's look at the values and it has various values now the source ip in the previous data set and the client id here from where the request is originating would be the same one and then obviously you have the information so now we can create a visualization using these so we have The model here now what i can do is i can start creating relationships between this one so here i have host and i can have host connected to host here so basically this
has now what does it say this should only be used if it is expected that both the columns do not have unique values but we know that there is unique value which is 192 168 250.1 so if i say one two one it basically says the cardinality you selected is invalid for this relationship if i basically go for apply security filter in both the directions it does not still work and you can look at the cross filter which says single so you can have a relationship between this and this so you can say but the
thing here is there Are various combinations for these particular values and that's why it is saying this cardinality does not work so let's go for many too many that's fine and let's go for okay so you should have a relationship now between host and your host now what we can also do is we can go for device name or device id so I can again create one more between device name and device id in case there are different values i can say okay so this is one more relationship i am creating between these although i
am not making this active so we can see when we look at the star it tells me that it is many too many now what we can also do is as i explained so you have your traffic Which basically has your source ip and here you have client ip so let's create a relationship between client ip and source ip and let's go for ok so that's again a relationship between these now these relationships should be enough for me to pull out the information from all these three data sets Which can be related on the same
date or which could be based on the values so we do have date what i have done is i have filtered out the data as i explained earlier which was 20 onwards 8 20 onwards but then i have changed that to make the data set a little smaller and i have chosen anything beyond 8 23 and then up to 8 28. So now this is done let's go to visualization and let's pull out the information so let's say it is talking about a previous field which we have let's close this so i can say fix
this and here i can close this one so we don't have any data fields right now so now let's start selecting so let's first go to event i will be Interested in the date field and let's get the date now it is broken down into your year quarter month and day now we can change that format so here we have your date field which is basically being broken down now i can just say date and i don't want the date hierarchy so date is fine which gives me the time you see the starting time is
23 onwards Now what we are interested in is basically the device name so we have created a relationship and it is good to choose the fields on which you have created the relationship now we have the host field so let's select that now there is one entry for that and that shows me the host field you have level which had two values so let's select Ho level now you can always check here when you are looking at these particular fields you can sorry check here which will tell me what are the different values and if
you want only a selected value say for example we want warning information basically alert information which is a lesser number i can select that or i can add that as a filter so i can do that so let's for example choose this level so that's done now Let's go to the traffic field so we have date we have device id we have device name which we have already taken so there is no point in taking device name again we can look at the destination ip so that's available from this data set let's take the destination
id now host is something which we have already created a relationship we have info we have source type we have source ip So let me go for source ip from here and i'm adding source ip now i have the info field which basically has the overall text which has useful information which we can pull out so we have chosen the destination ip we have chosen the source id which we can do a count on and then basically we have say type one info which basically has some specific fields so let's try adding This and we
can see what kind of data it contains and that might be a larger field so it might take sometimes time but then that's okay and [Music] that's your traffic that's your event and now we have our http data so this one basically has your client ip which would be same as host ip as i mentioned earlier so let's select client ip It got selected twice that's fine and then you have your info as the column you have bytes and bytes out you have acknowledged packets in packets out and you basically have your source type so
we can select source type just to keep in track of the data is coming in from which source but as of now i can just choose bytes in which might be interesting field to look at If there are bytes coming in and then you look at bytes out so let's for now cancel this type 1 info and this is the data which we are creating the visualization now as i said when you are selecting these particular fields it is going to look for the host ip it is going to look at my destination ip now
we can always go back to the data set and check if what appears in host ip does that Appear in say source ip or client ip in a particular data set so for example if i go in here and if you see i have client ip which is basically 1 92 1 168 250 100 that's what i have filtered for in this particular stream http data set so if you go back to client ip That's the value which is showing up and if you look in traffic so here we have our host or we basically
have our destination ip or source ip so let us look at the source ip and here i can search for the ip which we see as client ip so let's see 192 168 250 and then let's search for hundred And that shows me that there are entries for this so it basically is correct where we have created a relationship between source ip and client ip we have pulled out this information now let's go back to the visualization it is still working on it based on the data what we have now what we can do is
the level which we were seeing here so level which basically had four values and we see there is a Least count of alert so let's choose this and that should basically faster or make my query faster because now i am selecting for your filtering and i'm saying level is alert so it has to not look at all the information but it has to pull out level being alert and if you see we already have these entries which basically tells me host ip And then you have source ip and then you have client ip which is
same so source ip and client ip are same what was the bytes in what was the bytes out right and now you have the alert level so this was the alert where we were saying we also look at the destination ip and it pretty much looks the same except the one which we see here so This one where we are looking at the information on 23rd august it tells me alert where host is 251 you have source ip which is basically 2.50 we have client ip which is matching and then you basically have a destination
ip wherein bytes in is 0 and bytes out is huge and this is something which we can look at to see if there is any problem with that so this is a simple report which we have created And what we have is we have these different levels what we are seeing i mean we have chosen alert as the level now what i could do is i can add a filter so or slicer so it says the entities that columns in the values bucket belong to are not hierarchically related because then we can look at the
details here so it says Value bucket or not so we can send something or for example we can get rid of the filter as of now let's just go to the table and we can basically say okay this is my level field so we have selected just this particular data but what we would be interested in is not information but might be notice or warning messages so let's also select warning and then obviously we can do a count we Can find out on this information what we are pulling out so i would want to look
at my alert and warning messages when your source ip and client ib was same request was originating from host and we are looking at bytes and bytes out but i can now look at specific other information so if you go back here and if you look Into your data set so we have basically our data set which shows the source ip because there that was the filter which has been applied now i can basically go ahead and say clear filter here and that shows me all the entries it saves me it shows me what is
the action which says accept or information so we can do a text filtering here where we can be looking at different values so let's see what Kind of values we have here and if you carefully see it tells me that there is this destination country which is canada and your destination country is hong kong source country something else so we can be looking for a particular country we can be looking at if you look at the dns apps what is the app here is it a dns is it a net bios is it something else
What kind of risk we are talking about is it elevated risk are we talking about duration so we can filter out this information to reduce our results because as of now we have everything so say for example i have my destination country as netherlands so let's go ahead here and i will basically say let's go for a filter and let's say text filter let's say Contains and now let's say i'm interested only in netherlands data so let's say okay so the filter is applied and now what you're looking at is just the netherlands data for
your particular data set come back to your visualization so we see the information getting populated here and we have alert we should have the [Music] warning messages also as we have chosen so we are seeing alert as of now as the level and we look at a lot of destination ips now similarly what i can be doing is i have this information i am looking at the level which is alert now as i said we can be choosing warning like we chose earlier now what we can also do is we can pull out The information
which is based on the total bytes if we would want to see so let's basically bring total bytes field and that should get added to your visual and now you see you have the total bytes values which are showing up for all your entries here now that's my symbol report which we have created based on the fields we can be Just looking for your source ip and client ip being same so we have chosen host because we were interested in getting the data from our respective data sets that's your event which basically has some login
for so now i would be interested in getting the bytes in or bytes out so let's get rid Of bytes in that's not what i'm concerned about i would be interested in looking at the log info which is basically a consolidation what we can also do is we already know what is the destination what is the source ip what is the client ip which we are looking at and we know that source ibm client ip will be matched so let's reduce the burden by getting rid of your Client ip here now if you see we
are already seeing some information which has come in here which talks about your log info which talks about configuration was changed who was the user what what was the ip and we are basically filtering out the information i am still seeing the source ip i am looking at the client type i am looking at the values where they are basically matching so you look at the new data which is Host name you have alerts you basically have your destination ips source ips so we can always see what is the destination ip what is the source
ip source ip same as your client ip remember the bytes in byte out information what we are extracting is coming in from your stream http data and these are if you just look at the message it Clearly tells me that this is a alert message and that's why we are seeing configuration changed now that's the kind of information we are seeing and there was a alert generated which was coming in from source and on this particular destination server so this was and there was some bytes in bytes outgoing and you can look at the total
number of bytes which is a total Of bytes in and bytes out so you can also calculate what was the bytes in if there was some kind of acknowledgement which was sent and this is good information so we can get rid of alert and let me say just warning so i would want to select warning now we are talking about count of 400 and we will have to give some time and then we can start saving this or publishing this report what we can also do is once we Have published the report we can ask
questions to this one right so it will always be good to publish the report with all the levels rather than a particular level because then it gives you a wide variety of asking different questions different kind of log information messages what we are seeing at so date can be important device name what we are looking at can Tell me where the data is coming in from so technically speaking we have bytes in bytes out that's the kind of message which we are seeing and we are seeing what is the device name now device name is
basically coming in from this particular event field and that's why it is showing up the values here we don't have any device name so we can keep the device name or we can Filter it out so we know that there is a relationship between host of your photogate event and fortigate traffic and that's good enough now i have taken up this example which looks complex but then it's very useful in real time machine data where you can create visualization where you can work on multiple data sets where you can do data modeling which basically means
That you can have relationships between different data sets so that you can create your visualization you can create your reports and then basically you can save or publish those reports so once this report is generated based on our these simple data sets we can continuously improve our data modeling so right now we just have this information but what i can do is i can go for The modeling option here and then i can basically mark as date table i can manage the relationships here i can go in for a new table new measure so remember
measure is something which you can create here so these are your dimensions or values coming in from dimension tables so new measure is basically if you would want to calculate something If you would want to calculate something so for example you want to calculate how many different destination ips are existing or if you would want to go for a quick measure so choose from a list of common calculations and add the results to the selected table so we can do that so for example let's go for quick measure and it says okay what is the
calculation you would Want so it says you can get a average per category variance per category you can basically do a count you can get max so max and minimum would not work might be we can work on bytes data so we can do that we can say basically your quarter to date total month to date total so you can just go for total for category so filter supplied And you can basically go for cat totals you can do some mathematical operations if you are interested in you can concatenate list of values so for example
we can go for total for category now calculate the total across all values in a category applying filters in your report so we can basically say what is the data field you would want to work on so for example let's say the destination ip So let me add that here now this one is category over which do you want to calculate the total total so i have destination ip and let's say source ip or client ip so that's the category and i'll say ok now this is where you are doing a quick measure where there
are list of measures which we can add so measures if you remember dimension tables are something which Contains the actual data and your measures are basically what is stored in the fact table right so fact table has fields or columns which are already in your dimension table so your dimension table has the columns as the primary key and facts table has the columns as the foreign key plus your fax table will have measures And basically those measures is what you are trying to calculate which can be added to your table that is as your report
and then you can publish the report so this is where we chose a quick measure we are doing it now i can add a new column i can create a new measure depending on the value so what i'm trying to do here is i'm trying to say let's find out the count of your source ips And the category which i am choosing is destination ips so i would want to get a count of what are the different source ips what are the counts of those and then we can basically tabulate that so let this report
run and we will have a view at it and we will then publish this so now if you look at this messages so we are looking at our report might be quite big in a format So i can basically choose the format by going in here and we have the general and background and let's look into general so it basically gives all text we can give some details here but let's look at the grid so first let me it is still working so sometimes you have to wait so for example i choose and then i
look into the value so i can go into the Style and i can change the formatting so the report which we are running is on huge data set and that's something which we need to remember to basically look at the result or to look at the count of whatever we are doing it might take some time but then once it is done we can easily publish this so after sorting the data and reducing The data because data was really huge so it was taking time to generate the report and publish it so basically here the
report has been created now we can apply measures to this if you closely see here i have applied filters which is alert which basically tells me just 12 alerts because we have run a quick measure so i am looking only for alert level information and date i have chosen Everything beyond 27 754 because what i know is that in my traffic related data so if you would basically see here in the traffic related data so we have date which has been filtered and if i look into my other data such as http [Music] i can
see the date which exists here shows 26 because now we have Filtered the data so you have to filter the data otherwise you might fall short of memory now here if you see the data starts from 28 23 51 and then that's the last one so you can obviously see in a reverse order or you can sort this by doing this and that should show you the starting data and here if i closely see there are all the fields which are showing up but then you can basically choose how much data you are Pushing in
there so the data here is basically having huge amount of data and that will affect your visualization so you have to be careful in what data you select and how much would go into your visualization so in my visualization based on the fields which we have selected i have basically limited the amount of data which can show me in the report however When we have a bigger server we can basically create a report with all the data or the suggestion would be to break the data sets into smaller chunks and then go for reports and
visualization now this report was published to my bi service and if you see here this is my bi service which has the data i have applied the similar kind of filters here and now i can start asking questions Which can then be added to my report so here i'm saying show me the first total of this cp total from your s source ip so i can look into something like this now if i'm not interested in this i can delete this i can ask different questions here so for example count i can say count destination
eyepiece and that shows me there are different 13.44 destination ips and i can say for each source ip the resource ip or the client ip now you can give a query like this which will basically try to do a count of destiny destination ips for your source ips and it can give you a count so here it gives me what is the Destination ip for each source ib and this one has the highest count and then you can look at the other values and if you would want to save this question or the answer to
this question let's put it here so we can basically make our report layout a little smaller or change the format here so that we can push in more data here or ask more questions now once this is done I have my report created with different kind of filters i can just go ahead and save this report remember i have filtered out the data and i have selected the data fields with date being just for two days instead of for two years now that basically affects my overall data but what we have seen here is we
are looking at our report now what we can do is We can look for other information here so we have the visuals on the canvas we can duplicate this we can share this we can look at the view and we can change this we have the file and we basically have our reports which is shared now if i go back to my workspace that shows me the dashboards which i have i have some reports now this is the report here And this is basically you can look at the usage metrics you can share the information
you can get some quick insights which power bi is very powerful in looking at your data and gathering some insights however again remember the amount of data which is selected will affect the time consumed in generating these insights so while this is running i can go back to my power bi desktop and I can basically have a look at this i can look at the data models now these were the relationships which we created so if you see this was basically host and host this was device name and device name and here i had the
client ip and the source ip and this was basically my data model now i could have a facts table separately created which has these some of the columns and then the measures which we can calculate and then add it To our facts table now this is basically a simple example of data modeling you can play around with the data as i mentioned you can obviously go to power bi and if you would want to look at this data as i mentioned earlier you can just search for bot sv1 data set generally these data sets are
used for threat hunting but then this has a lot of data sets with different sources and you Can get the data from here you can trim it and then you can basically use for your power bi or you can always find data sets and you can look into kaggle or other sources where you can get different kind of data which can be used now if you see here it basically gives me some insights and we can choose which insights we would be interested in so it says count of the source ports and basically it gives
me that these ips or which i know these are dns Servers have noticeably more source ports it gives me count of total bytes and count of bytes so this is a correlation between total bytes and bytes it gives me count of info so what kind of information we have on packets in so it says that there is a lot of information with packets in being three now i can scroll down i can see count of source report and count of info so you can basically look at count of Total bytes count of info so power
bi has generated all these insights for us and we have this information now i can obviously download this so i can basically go in here and look at this particular insight i can open it in a focused mode and look for more information and we can choose what we would want to do with this insights so if you see here it gives me when you look at the info what kind of Messages are more that also gives you information total bytes count of your destination ips and i can basically click on this one it opens
up in a bigger window it tells me this is count of this type is or sorry destination ips based on your source ips and this is a great insight so you can always look into the insight and then basically work continue working on this So i can just do a exit focus mode i'm back to my insight i can go back to my workspace i can look into the reports now remember when you publish your report your report comes in here and that basically gives you an option to create a report you can schedule it
to refresh and get the newer data you can basically view related information of this And so on so this is how you can use modeling with power bi and this is a simple example well we can have more complicated modeling scenarios and we can look at different data sets hi there if you like this video subscribe to the simply learn youtube channel and click here to watch similar videos to nerd up and get certified click here


![Data Modeling for Power BI [Full Course] 📊](https://img.youtube.com/vi/MrLnibFTtbA/maxresdefault.jpg)

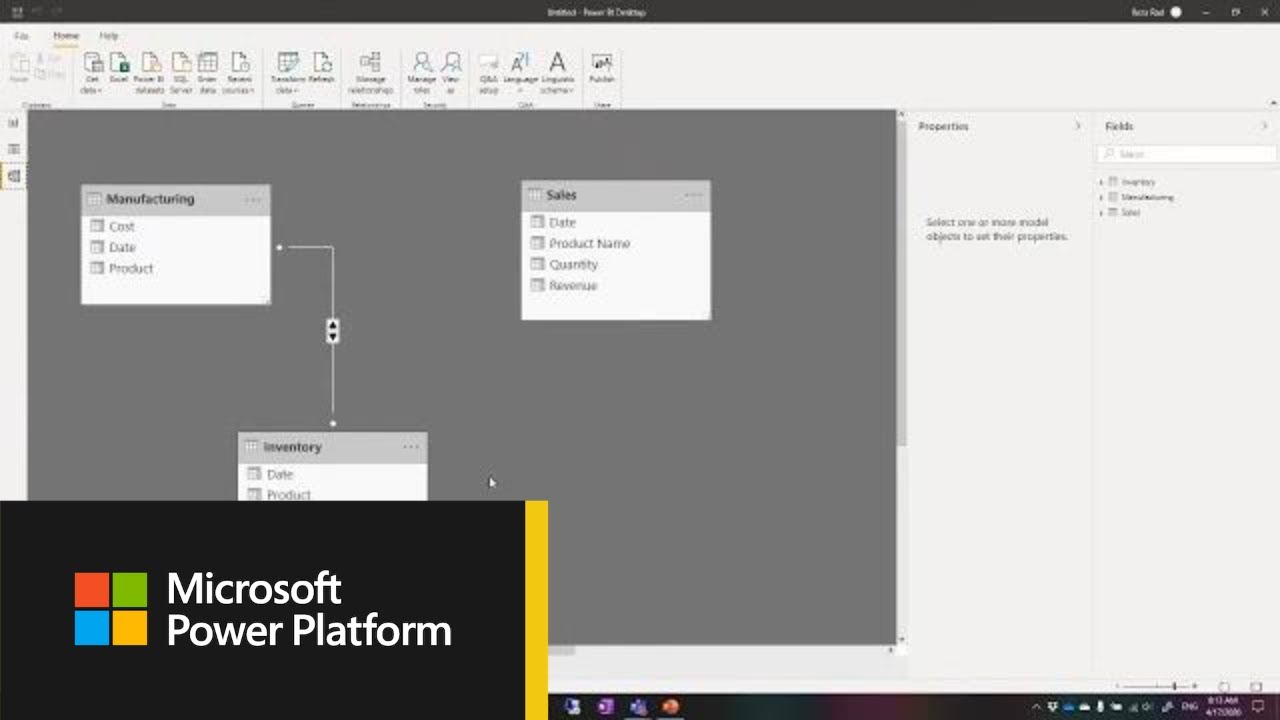

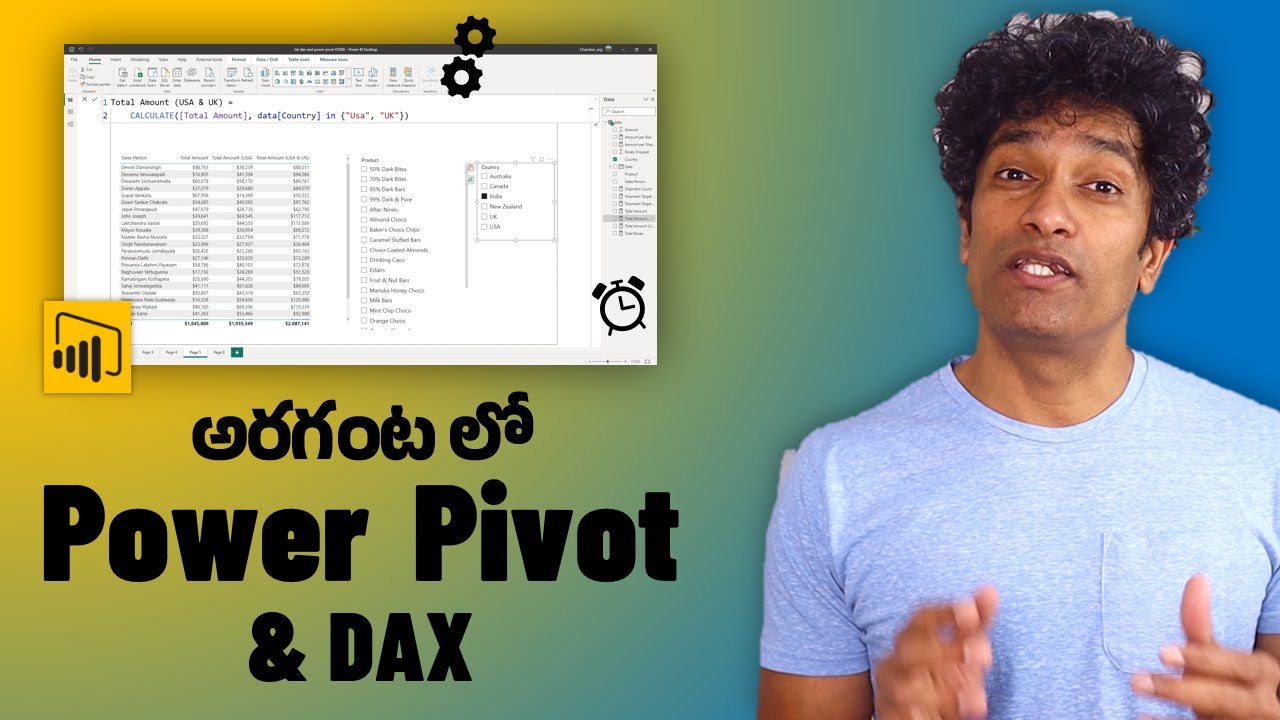

![Hands-On Power BI Tutorial 📊 Beginner to Pro [Full Course] 2023 Edition⚡](https://img.youtube.com/vi/77jIzgvCIYY/maxresdefault.jpg)
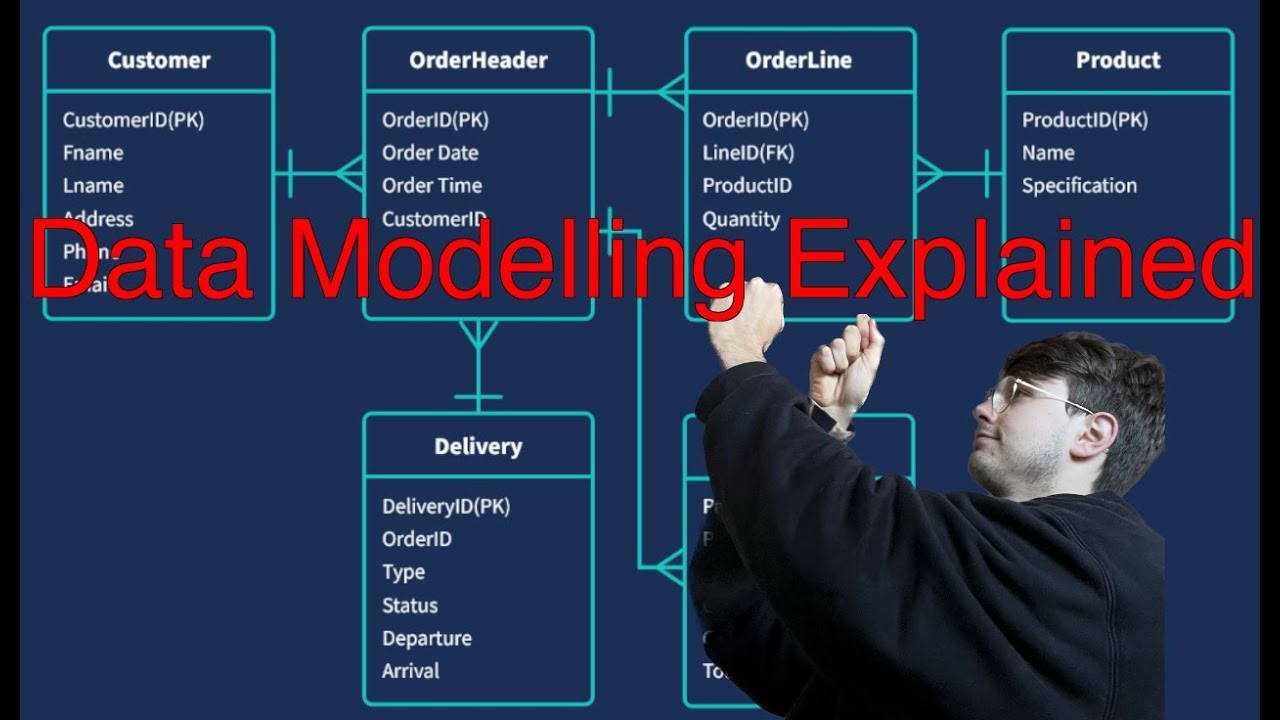
![Business Analyst Full Course [2024] | Business Analyst Tutorial For Beginners | Edureka](https://img.youtube.com/vi/czymrnQV2p4/maxresdefault.jpg)
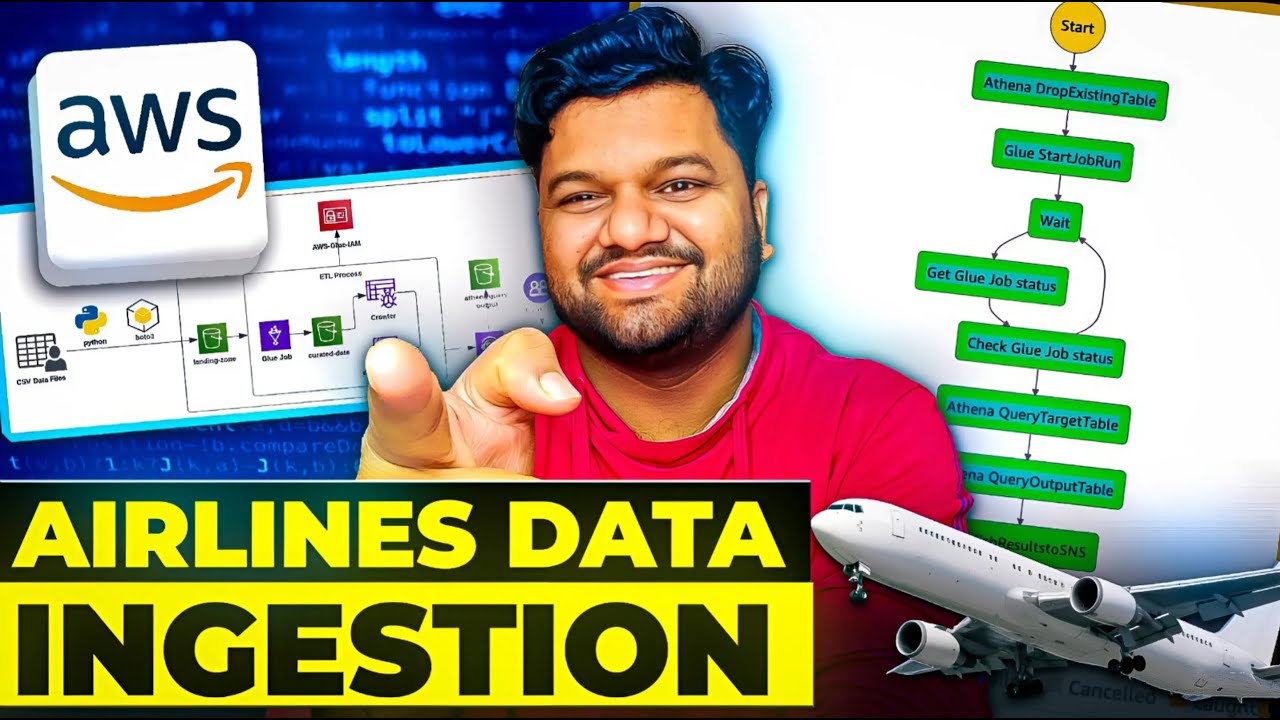

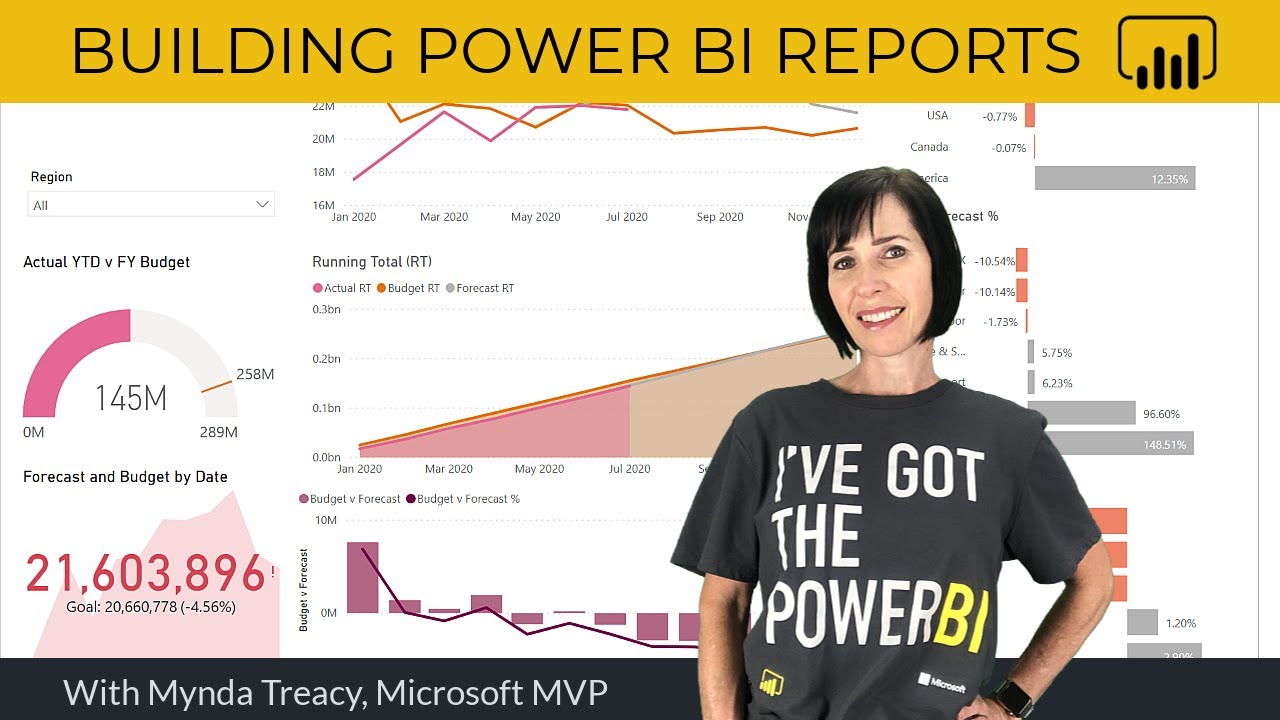
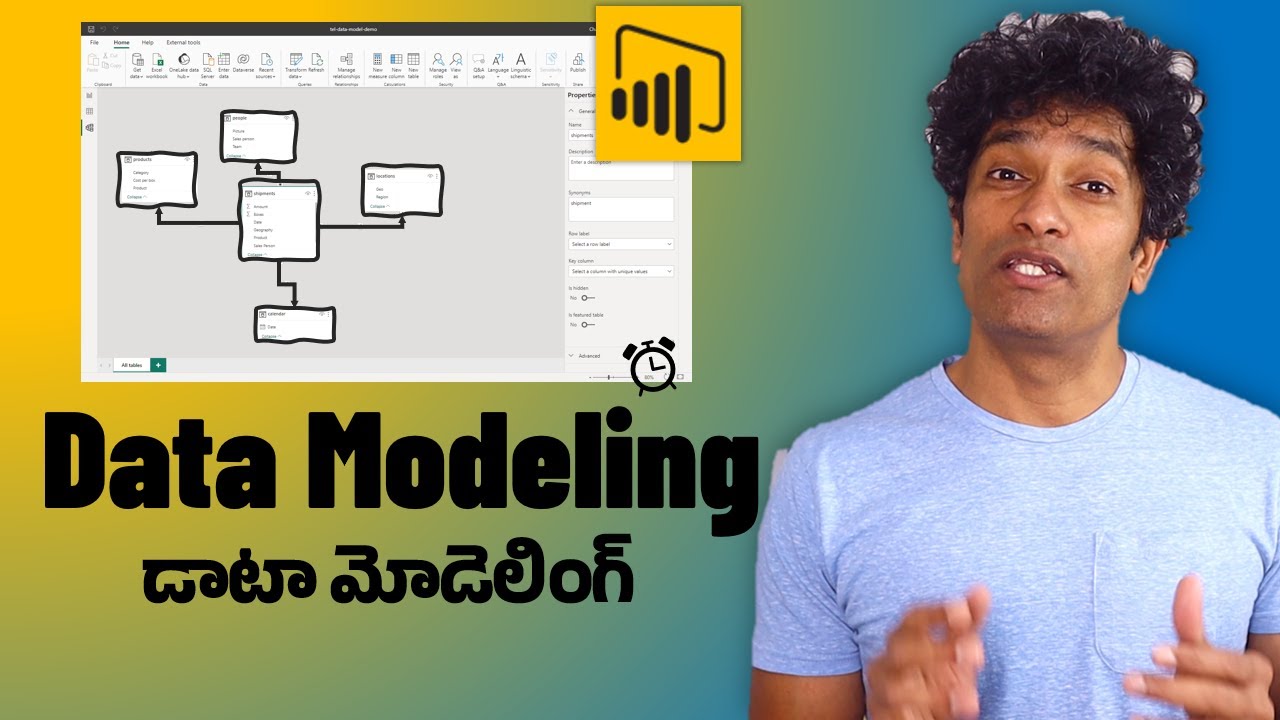
![End to End Project- Power BI | [HINDI]-90 MIN | Dashboard | Beginners | Complete project - 2023](https://img.youtube.com/vi/et8tAUTwcvY/maxresdefault.jpg)