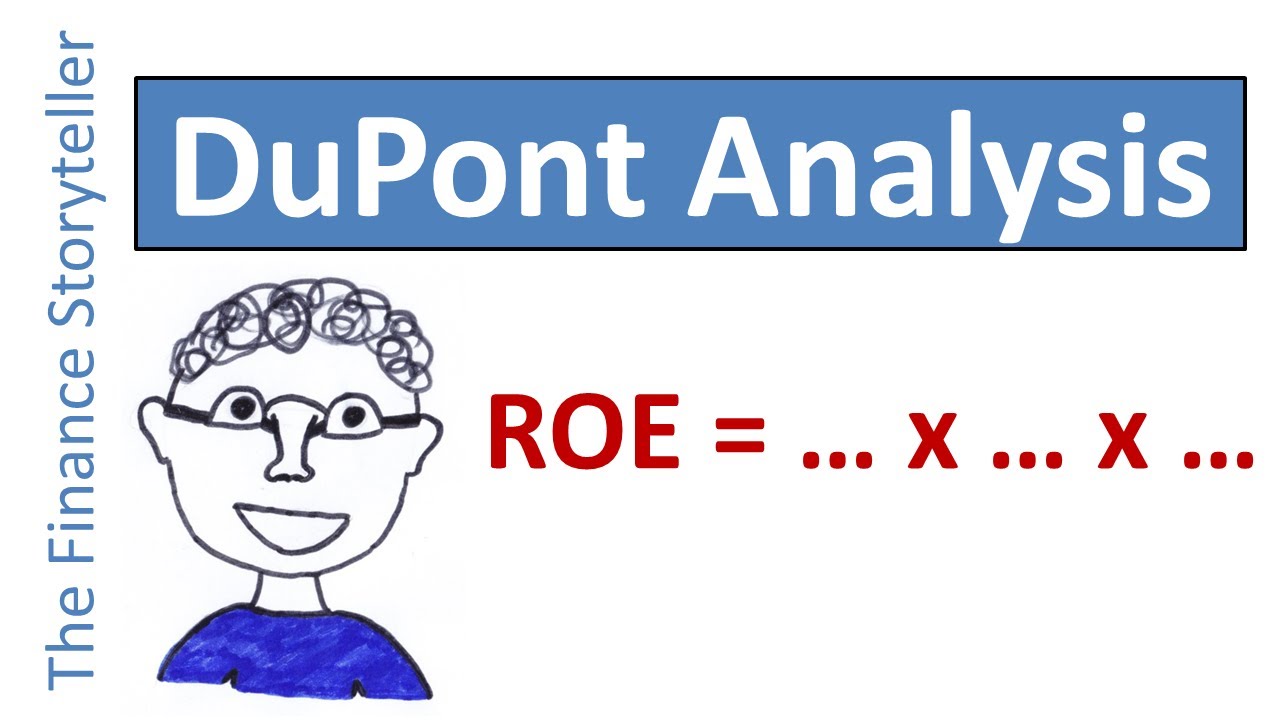
[Music] [Music] welcome students so in the journey of this ratio analysis we have almost say completed the larger part of discussion but some two sets of ratios are left to be talked about so in my previous lecture I was talking to you about the dew point analysis and in the DuPont analysis I discussed with you that there are the three ratios which are identified by the DuPont that if you want to really draw some meaningful conclusion before going for the detailed ratio analysis about a company if you calculate these three important ratios then we can find out that in which direction the company is going but is the performance of the company and how this company is doing so these ratios were DuPont company or the DuPont analysis DuPont analysis and the first ratio which I discussed with you at that time was return on net worth which I said the function of this is is equal to net profit margin net profit margin and multiplied by the net worth turnover ratio so this is a function of the net profit margin as the net worths turnover so if you look at we have already calculated this ratio that ratio can be calculated and as a first ratio can say that the ROI ratios in the first ratio was 26. 97 this ratio was 26. 97 percent you have already calculated this ratio so you can check whether it is 26.
97 as a function of net profit and bada say this net was the turnover or not so if you calculate the net profit here net profit will come out as what is a net profit of the company that was 1 5 1 1 0. 7 divided by 7 0 divided by 8 6 0 3 so it is multiplied by 100 if you calculate if you check this this works out as 17. 5 7% 17.
5% is the say net profit margin ratio and if you calculate we have already calculated I think the net force the turnover ratio and the net worths turnover issue was 1. 3 that is eight six zero three that is a net sales point five nine dividing it by the net worth and the net worth taken for this was five six zero six point zero six so if you take this this works out as one point five three times and if you calculate if you multiply this by this you will get the same ratio this is the twenty six point nine seven times so we have already calculated the net worth turnover ratio but we want you to be sure that it's whether it's a function of net profit margin and the net worth or turnover and we see that yes net worth net profit margin and the net worths turnover is that our data are the basis on which this net worth return on net worth can be calculated so if we want to improve this net profit margin we have to improve this particular thing that is the numerator sales if you are able to sell maximum in the market or you increase your sales other things will have the backtracking effect multiplier effect your profit will improve and finally the return on the net worth will improve right so this we have already done but we are just reconsidering it for the current discussion this is one next thing is the Ruta return on total assets so when you call me Howard the return on the total assets will see that what was the basis of the return on the total asses we have taken that is that it is a function of net profit margin net profit margin and multiplied by the return on return on total assets in retirement wrote lessers or the total assets turnover it is not not return on total assets but their total assets turnover it is a net worths turnover and it is the total assets turnover it is the total assets turn over so for calculating road table we have calculated the router for the two years and similarly we just go back return on net worths for the previous year was eighteen point four mine percent and if you calculate the same net profit margin for the previous it is 12. 94 percent and it was the net worths turnover times was one point four three one point four three times for the previous year that is two thousand five and six so if you multiply this by this you will get the same ratio so it means it is a function of the net profit margin and the net worth turnover ratio so both the ears so we are able to find it out that return on net worth is improving from 19 percent in the previous year in that two thousand six and seven it has become 27 percent so it is on the growth path and it is evident from the profit and loss account also so now we talk about the rota that is a return on total assets again I told you it is a function of net profit margin and that total assets turnover and for this we have to calculate this ratio that is the net profit margin and the total assets turnover so let's check for this how much is the rotor for here if you take that what is the formula for the rotor first we will see formula for the rotor was Pat divided by the total assets so Pat divided by the total assets is how much that was profit after tax was fifteen one hundred and eleven point seven zero divided by the total assets was six seven seven zero point two nine seven and this works out as twenty two point three three percent multiplying it by 100 so this works out s twenty two point three three percent and if you take the net profit margin again this ratio so it is one thousand five hundred and eleven point seven zero divided by the net sales and the net surge is how much eight six zero three point five nine and here it is eight six zero three point five nine so if you take this into account how much it works out five nine eight six zero three point five nine and then multiplied by same sales six zero three point five nine dividing it by the what is the denominator denominator is the total assets if you take the total essence figure so total asset in this case are six seven seven zero point nine seven so if you this is strike two off by this so if you calculate this ratio this works out as again the same thing that is the one five one one point seven zero divided by the six seven seven zero so finally the ratio will work out as the same thing and here if we have already calculated this ratio this is seventeen point five seven percent multiplied by this and if you take this this is one point two seven times so this ratio is finally coming out as twenty two point three three percent this is for the year two thousand seven and now we will calculate that for the year two thousand six so if you'd is two thousand seven and now we will calculate for that two thousand six so we see that trend how the trend is going on and for this we have the rota for this year is eight zero eight six zero 0.
53 and then the total assets are one-fifth six one 14. 12 multiplying it by 100 so this works out is how much 14 point zero seven percent and if you calculate this part this part works out as four point nine four and x one point zero eight support fourteen point zero seven percent here so this is nineteen twelve point nine four percent and this is in x so if you multiply that twelve point nine four percent with the one point zero eight times you walk out to the same thing that is the fourteen point zero seven percent is the fourteen point zero zero seven percent is the say return on total assets so what was the previous here mister in two thousand five and six it is about fourteen percent and in the currently at two thousand six and seven it has become twenty two percent it means it's on the growth path and it has improved by more than eight percent return on the total assets has improved by more than eight percent and similarly now we can flow is Aruna return on net assets so if we take the return on net assets we are going to find out that is a Pat divided by the net assets so if you calculate the Pat divided by the current tester so it is profit after tax 1 5 1 1 point 7 0 divided by 3 3 9 0 this is that net assets after depreciation so this is 3 3 9 0 point 4 4 and here net profit margin is 1 5 1 1 0. 7 0 divided by of this is 'la 1 point 7 0 and this is going to be same that is a net profit margin and multiply it by 8 6 0 3 point 5 9 and divided by three three nine zero three three nine zero point four 4 so this works out as this and this so finally the ratio feet or talk about their owner for this works out as forty four point five nine percent and here you talk about this is seventeen point five seven percent and it is two point five four times so it means their owner for the 2007 this is a for the 2007 is forty four point five nine percent forty four point five nine percent is a return on the net assets because the denominator has gone small has become small because we are not counting for depreciation so the performance has improved and when you take the gross assets that is not subtracting the depreciation so naturally the return will come down so but it's a significant improvement so let's check for the previous here that is two thousand five six if you take into account the 2006 information then the ratios we have already calculated and the rona for this is the twenty five point twenty five point three eight percent and here it is twelve point nine four percent multiplied by one point nine six times so this is the Rona for 2006 and this is for 2007 so if you look at this change from in the in the two years so it means if you talk about the six and seven ratios it means there is significant improvement so the this ratio was twenty five point three eight and this has become forty four point five nine percent it means there is a significant we can say that about 75% improvement is there as far as the this ratio is gone up by 75 percent as far as this 2006-2007 comparison is there so it means the return on net SS was twenty five percent it is become forty four percent now it means in every say even call it as indicator in all ratios this form is showing as the very good performance so it means in the nutshell the purpose of this discussion was that when you talk about the total ratio analysis before going for the detailed ratio analysis if you calculate these three DuPont ratios then that they are not net worth return on the total assets and return on net assets you can miss draw a conclusion that in which direction the wind is going to blow and what is going to be the overall financial performance of the company when you will calculate the ROI ratios solvency ratios liquidity ratios the knower issues then the resource efficiency and turnover ratios and the say capital market ratios so it means you can get an idea just by calculating these three ratios which are given to us by the DuPont company this is called as the DuPont ratios or the DuPont analysis now next thing I'll take up today in this lecture is that is the last set of ratios that is the capital market ratios capital market ratios that is the last set of the ratios I'll discuss with you and there interesting and apart from many things they are quite important also because under these ratios under these ratios under the capital market ratios when we talk about the capital market ratios or the mistake other name of the capital market ratios is the valuation ratio also valuation of the firm or that capital market position of the firm so we'll be talking about those ratios now there is a last set and we'll be talking about five-six ratios about the capital market or the valuation ratios some of the ratios we have already calculated so we'll be using them in the passing reference and some ratios we'll be calculating here from the information given so here when you talk about the information now this information is going to be off very safe good use for us especially this part that is the closing market price of the share then it is in between market price then the Sensex and all this this information is going to be very very useful for us and at the same time we are going to use the information with regard to the dividend and the other related aspects so now the valuation issues of the capital market ratios when you calculate the say capital market ratios see that we are going to make a comparison of the form in terms of Book value of the firm and the market value of the form Book value of the firm and the market value of the form if you look at even the sheer price of this form we have seen that the share price of this firm is how much it is that is nine point one six one seven corrode shears and one shear prices what is the book value of the shear it is ten rupees and what is the market price of the share it is 2091 and previous eight adverse 2057 or fifty eight in between it has arisen up to two thousand seven hundred and seventy nine also or seventy eight point six zero also that is in the January 2007 so it means how many times the difference is 10 rupees and two thousand Opie's or three thousand rupees that is the market value of the phone and market value of the form is built up on the basis of the people's perceptions what people perceive about Grasim industries what how people rate Grasim industries and market value is of much use when there is a question of takeover of the form say you can call it as mergers of the form or restructuring of the forms if this form has to be sold to other forms it's not only that this form is going to get the price that is only for here there your book value the book value of this form is if you look at is how much here it is the book value of the form the total liabilities of the form are or you talk about the total assets of the former how much nine seven six four so nine thousand seven hundred and six four sixty four corrodes and previously it was this seven thousand five hundred and forty six cores so form is not only going to get nine thousand seven hundred and sixty four corrodes if this we want to be sold to the other company form is going to get something for the goodwill also and at that time the valuation is important at that time the capital market ratios are important so in this case the valuation ratios and the capital market ratios are important because they make how the how people perceive that company in the market capital market ratios are important in the many situations they are important for that all kind of the shareholders present shareholders and the potential shareholders they are important for the lenders they are important for the suppliers they are important for the people maybe anybody in the general public or maybe des that the government also how the forms are performing who is a leader in the textile industry who is the laberd in the textile industry so for everybody that the the market value or the capitalization or market capitalization or the valuation related ratios are important so on the basis of these certain ratios we will draw the conclusions about that what are the different ratios how they are how this company is doing and what we can see it that how people perceive in the market as far as the gaseum industries i limited is concerned how people perceive this company in the market and what is the overall performance and the position of this company in the market so because there are the two values one is the historical or the book value of the company which is means physically available and other is the perception of value market value of the firm which people perceive and there the difference in the two values if there is a high capitalization rate or the market value of the firm and how the market capitalization rate is very high maybe the book where is true it means the company has done very well in the past they're spies that's why the people have a very good opinion about the company and people are ready to buy the shares of this company or the share of this companies trading in the market in the stock exchange at a very high price right so I'll discuss quickly with you what are the different ratios which can be calculated to know the market position of the form or the to say capital market ratios what are the important capital market ratios which can help the firm in the orbit can help in the evaluation of the firm so firstly should we are we have normally six ratios which are of use and importance as far as the say valuation of the firm is concerned and the capital market ratios are concerned so first ratio is the earning per share I mean per share as a capital market these perceptions about the forms in the capital market are built on the basis of how much earning people are having or the shareholders are having and this ratio we have already calculated but we'll be using here in the passing reference then we'll be interpreting the other ratios calculated here especially for the capital market valuation purpose second ratio is important ratio is the valuation ratio of the capital market ratio second is p/e ratio price to earnings ratio price to earnings ratio and this ratio how it is calculated closing market price / earning per share so for calculating p/e ratio you need the EPS so this ratio will be taking the closing market price which is given to us we have already calculated the earning per share we will be able to calculate the ratio and then we will interpret this ratio as this information we find it out then third ratio is net asset value nav ratio NAB net asset value we have already calculated this ratio but NAB is also equally important for us for the present analysis in the present context the NAB is equally important for us and we will be using the NAB also net asset value also and with the help of the net asset value will be able to draw some meaningful conclusions as far as the market capitalization of the blessum Industries is concerned then next is a market price - net market price - Gnabry show why we need NAB because we need to calculate the market price - nav ratio net asset value ratio for calculating this market price to NAB we will have to take the closing market price again the same closing market price of the form divided by the net asset value NAB closing market price and the net asset value that is NAB will be taking so NAB is of importance to us and of the very good use to us and the second-last ratio in this category is the market capitalisation market market capitalization ratio market capitalization ratio and when you talk about the market capitalization ratio here it is the how it is to be calculated again same closing market price off share multiplied by the number of equity shares outstanding grossing market price of the share multiplied by the number of equity shares so it is you can say if you want to find out the capitalization of this form closing market price is that is in 2007 31st March 2009 t 1.