One more quick pass through the Dow. It's falling out of bed. ES.
It's mixed. NQ. And these are continuous contracts.
So it's not the delivery contract month of September. So now we're going to go into NQU 2026. that high here on the 15-minut time frame.
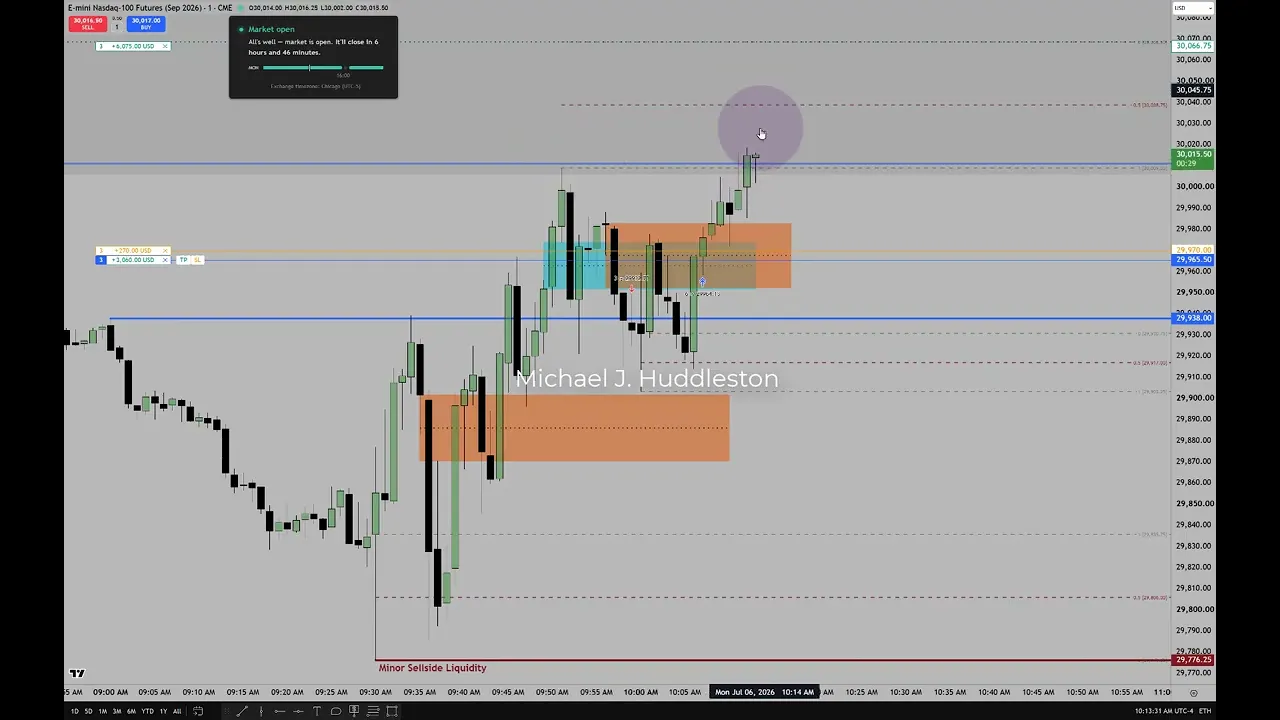
I I posted this is the old high. I want to see if it can get above that because it got real close to it here and it gave like a like a a move like it wanted to go lower. So, anyone that's already shortened here that has a stop loss there, they might get they going to get banged and then then another drop below this area here could act as inversion fair.
Still favored these lows here on top of the higher run from just bumping that high here. The holiday was on Saturday. Usually Mondays after that, it's very very trashy.
It means you're going to have a whole lot of false signals. It's going to have a whole lot of just what you're seeing here. Just because it went higher from the low of 930's candle to here doesn't warrant, you know, any real part any real participation on our part as a trader.
But seeing that that this coupling between the three averages, they all should be moving higher. If they were all moving this like this, then it's a no-brainer. This is going to become a bullish fair value.
got the same prices higher. But while I think it still could just bump this high, I would like to see it fail harder than it did here once it takes out that high. Now, if it breaks aggressively lower and then uses the consequent corrosion of this wick, that might be a short and I'm just missing the better fill up here.
10:00 news has been consideration this morning proposed at uh on X rather that we would be looking for 10:00 news to give us a little bit more intel or bias reading all of this in here there are several things that I would have done that would have yielded a loss so we have two more minutes to get to uh the 10:00 news. Now, if if the 10:00 news had already happened and say like this is 10:01, I would be shorting right there. But because we have 10 o'clock news still in the offing and watch they'll they'll dump it down here and I won't I won't be able to capture it at all.
Watch this candlesticks halfway point where consequent level this first value got. So, this is going to act as an inversion fair gap, I believe, now because of where we're at, what we've done the first 30 minutes. So, let's watch it hit here.
Watching this candlesticks close risk is the high of that candlestick that went completely through the inversion fair value gap. I want to see it now on the news. I want them to use the news to to send it lower and attack the sell side that's resting below today's intraday low.
Got 10:00 news out right now. took this low out there and it took it out there and it didn't even touch the first value gap at all here. So, this is all tantamount to uh what I was saying earlier and what I posted about it's trashy conditions.
Technicals don't give you that real pristine precision that you're looking for. We have small little gap inside this inversion fair gap. So, we'll see if that wants to with the volume and bounce here to that candlestick's high.
If it's going to go lower, it needs to start really mounting a a heaviness campaign. Go lower. Any more consolidation in here sends us up into this high.
I've lost more money trading after holidays like this than in any other thing. Always holiday volume always. You can see it here.
Says stop again placed above this candlestick's high. Difficult warning. Quick peek at the ES contract for delivery September mark.
It's trashy. Y MU2026. Really bad.
And then back to NQ. So it would have to be on this candle or the very next one. Get very heavy, take out that low and start to really build momentum.
I'm going to bring the stop down just a little bit to that candlesticks high right there. Let me see the sub substandard uh execution on the part of Trading View. Can you imagine if you were saying, "Okay, I'm going to use the paper trading application of Trading View to test their uh platform out, see if I'm going to allow them to host my interface with my live brokers account.
" And this is the this is the service that you get. Think about that. ugly price action Again, it's because we're right in the middle of a 15-minute range, like dead center in the middle where either side of the uh the range could be explored, the the higher end or the lower end.
And you know, just based on the fact that we had news at 10:00 and we opened up on 9:30 here. We opened went straight down and then closed higher on the candlestick. Then we went down didn't take out this low, but look what it did do.
This is what I teach that consequent encroachment. It closed below it usually, but this could be not not true today because of the holiday volume because the holiday occurred on Saturday. Monday's trading can be sloppy price action as is as it's showing here, just really unruly.
Not really pristine delivery, but normal procedures is if I see a wick like that and it closes below it, it just warrants the likelihood. It's more likely that they'll come back for that low because we closed below its halfway point. Okay, so that consequent croch is a tip off to me.
That's why I like this. I like the fact that we couldn't even bump that high. Got real close to it.
So they at the at the at the immediate we have at least seen them protect this high. Now that doesn't mean they can't come back for it right now. It just means that they didn't have enough interest to send it there.
Not the buyers. The fact that the market participants are forced to engage with market price like right now this is where we're trading at. They can't short it to make it go lower and buyers can't buy it to make it go higher.
And the fact that we were unable to take that high out here that I showed on that 15-minut time frame on the the chart on X. Try to catch it before it moved away. Where is it?
Lay the land. So this chart here, this is what we we got drawn towards, but we couldn't even bump that high. So that's where that 30,00011 and a quarter came came from and we weren't able to do that.
So this here because look look how sharp this is and then we went down and then the blunt relative equal lows there. So the jaggedness has been on the upside. We already had this big retracement.
So now even if it just takes out this which is reasonable and then goes higher it's okay. So, I think that the trail stop losses for here that are placed right below there. That's that's that's the the mark, the draw, too.
And meanwhile, while I'm talking to you, it's failing to go lower. So, they're going to come back for those highs right there. Now, because of that, I know I'm possibly wrong.
So, I'm going to close the trade, save the stop loss, reverse, and treat this as the the initial utilization, which is bullish right. I think they're going to bump this high, I'll ride it as long as it'll allow me to, and then if it gives the short that sets up a run down to these lows, I'll try to participate in that as well. But these are very very hard market conditions.
Like they're very difficult. I'm using the candlesticks open here one tick below it as a stop. And I'm going to try to reach for event horizon between that fair value gap I showed on the 15-minut time frame.
That's that midpoint here from the high of it consequent encroachment and this old high. So, I'm going to look for kind of like a a halfway point between these two these reference points there. So, it's fleshed out like this here to there.
So, that's a good target right there to reach for. There it is at the level. I'm going to go back a little bit.
And there you go. You generally don't want to be taking any trades on a day like today. So you're sitting you're watching the the difficulty of the market providing any uh actually this is now this is the there's that and this is a version Go.
So standard bullish fair got this is reclaimed because it went below here and then we have this sellside imbalance buy side efficiency with the volume imbalance there. Usually that's bearish but look what it did. It failed to take out that low.
It failed to trade and close below its consequent encroachment of that level there. And I'll show you what I mean. Watch.
Take this fib, put it here so you can measure there. See, I didn't close below it. There's the halfway point, which is indicating that this is not going to be bearish.
Why I closed the trade when I was uh short. I bailed on it. Protected the stop loss.
That would have clearly gotten a larger stop out. And then now this high here, we want to see it use this inversion fair value. Stay in the upper half.
That's the this line right here to the high end of it here. So anywhere in here it's permissible to trade back down to but it can trade down to and touch the fairway gap there which is a standard bullish fair gap inversion fair gap. So it can trade down into that and halfway point of this but it needs to only do so on a wick not leave a body laying down there.
If it does that and turns into a wick next candle if it opens inside Anything above this range here to this candlestick's high, it should immediately draw higher. I'm going to take a partial. If it goes here, I'm actually going to draw this up to just below the consequent encroachment level.
And I'll just prepare myself in the event it goes to this level. I'll just peel one off. And I'll take one off in halfway here between that level and that level.
And then I'll let the the the bounce run its course. See what it did here? It created as a wick and we closed above it and we open right side.
It should open above this area. So it needs to really rip and run here and not fail. I got to peel I got to peel some of this risk off.
All right. So trading with a discount broker, your your commission costs and fees are definitely covered in that. Now watch, you're watching this line right here.
Right there. It's just event horizon. That's a halfway point between an old high and the middle of a 15-minute fair value got consequent corion level.
See how reluctant it is to continue? It just it goes there and then that's it. There's no need for it to come back down into this wick at all.
It should just be going higher. If it's going to be bullish, it should just keep on going higher. I'm going to see it try to hold on to this area here and go higher.
Like to see a series of nice big green candles come in and just obliterate that little line I have drawn on the chart. I see this is now three times we had we spent one minute here, two minute, and we're on the third minute above this high. So, it needs to really find legs and start running.
Go. I'm going to take two of them off. See if I can squeeze out a little bit of a better exit.
Where you're sitting at. You got the microphone hiding the screen. And I'm I just realized I'm a little bit further away that my my voice may not be as loud as it needs to be.
They're always going to complain. Get a better microphone. It is It's a high-end microphone.
I'm going to take two off there. And I'm going to roll the stop underneath that wick low. If it goes there, I don't want to be a part of it anymore.
Run. It's It's done enough that to go above here, but I would have preferred it for it to really try to tear off and go higher. Now since I only have one contract left the target of here for me to manage that I have to do either lower the takerit or manually close the position or strangle it with the stop loss.
And I'm going to elect to use a stop loss. I'm going to let this be the best case scenario exit for the final contract. Everything have to be managed through the stop loss if it if it doesn't stop me out here or the next candle because it's just looks like it's trying several little candles here and only a little bit of movement above it.
So about 15 handles of a run above this high. We're at the high of the session today so far from 9:30 candlestick low. Let's see this thing turn into a really big bold beefy green candle or this one we just traded and went start another candle here.
See, too much too much wanting to fold and roll over once we're above it on high. So, it makes it very difficult. If it was like any other day, I wouldn't be worried about it so much because it's it's typical.
But because it's a holiday weekend and we're trading on the first day back, this is the kind of warning signs I was talking about when I posted on X and before I even did that and talking to you, I said, "Look, you got to be careful because these days can be rather fickle. price could be lethargic and give you failures to launch. Now, if this candlestick can get above here, I'm going to roll a stop loss right below its wick.
Lock in a little bit more. Just going to do it now because it shouldn't come back down there if it's good. Okay.
So, that should have filled the full. Remember, I had all the all the position exiting just below here. Then I took out two of them, left one for a runner.
So, we're going to see if I can get a little bit more juice out of this lemon or get stopped out. And it's okay. If I'm stopped out, it's fine.
The the loss I had on an initial position here is completely mitigated already. So, it's there's no no harm. No fail.
Can you see based on what you've seen with with trading and watching price action yourself and also sitting with that can you see the difference between how today's price delivery is by contrast where I tell you it's low resistance liquidity runs where it's going to be a nice day it's going to be really nice technicals price going to be moving around really freely can you see the difference between that and what we're seeing today >> absolutely See if we can get that rip above there. See how it's struggling right there at that halfway point. Ain't that interesting?
Nobody else talks about that kind of stuff. I mean, part of me wants to see my stop loss get hit and be done. Just to say, see how strong these levels are.
Ask and you shall receive apparently. There it is. Now tell me, look at the sensitivity on that level right there.
GAN doesn't talk about that. Whitecott doesn't talk about that. Supply and demand doesn't talk about that.
Any other school of thought would never never have that level there. It wouldn't be there. Okay.
So what it really is is this this halfway point to its low half of that which is the lower quadrant. So right there. Okay.
So it's not bad. And for disclosure sake, you know, as I talk about, you shouldn't be trading today with live funds. I I posted this on X.
uh they know I had some guys complain me about can you show us a loss where it doesn't work and how you have to deal with all that stuff. Well, being in marketing conditions where it's crummy is is a real good scenario for that to happen. I try to do something organically and it fails and I'm even I'm even dealing with Trading View's substandard, you know, service for delaying your executions.
Let's show it here. So having initial loss $1,800 and then mitigated it. So we had $220 to the plus there and then another th00and.
So and was wrong about getting here but was right so far with the term. See that? So you know show me show me where you do it wrong.
Show me that, you know, show me what it means to know why it's going to be problematic for the day versus when it's going to be really easy. So, if you go out to a 15-minute time frame, they'll see the chart I shared where I said it was a lay of the land. So, we drew up into this area here, just shallow bump above that.
So, now I'm going to I'm going to grade this and then we'll close this session out. So here to there and then we'll add all of the optins. There's your quadrants.
And here's the opt. This is the halfway point between the quadrants. Okay.
And that's that. So now we'll look on the one minute chart again and we'll zoom in. So there's that level right there.
Okay. And I'm going to take this event horizon measurement which was by hand and just, you know, very very loosely determined. We're going to zoom in here.
Look at the look at the position of that level. 30,37 was the price. And that's where the body stops and then rolls over.
we have a little bit of retracement. So that's enough for me to to justify why I do what I do and what I teach. But most most importantly, the the lecture today was focused on knowing the difficulty that we're up against because it's a day after a weekend holiday.
And one could argue like for instance, I get a lot of the foreign folks that outside the United States that say, "What difference does it make? The market doesn't care because it's a US holiday. " And actually, if you look at some of the Americans, they hate our country.
So they're like, you know, why would this have any bearing on it? It's a it's a matter of participation. So they know that the volume is going to be light because there's going to be continuation of people being away because they're either hung over, they're away, it's the summer months, so there's no need for them to start spreading the the market higher or lower on a great big range because there isn't enough interest to make it reasonable to assume why the market went that high.
It basically slaps in the face the buying and selling myth or buying and selling pressure myth. So because there isn't going to be any large participation and they won't be able to engineer uh participation because there's a the vacuum of interest because everybody's tied up with being elsewhere. So there's no need for them to make the ranges big and they don't need to have the market to be that precise.
So knowing these things going in, it helps you preserve capital. It it preserves your ability to be in control of yourself and not go on tilt and wreck yourself and be content with enough. Enough is not trading at all on a day like today.
That's the that's the right answer. Do you understand? >> Yes.
>> All right. I think that's going to be it for today and next time I'll talk to you all. I don't know when it'll be, but be safe.