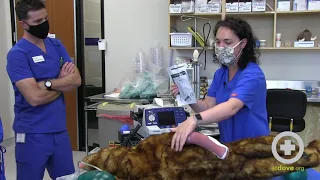
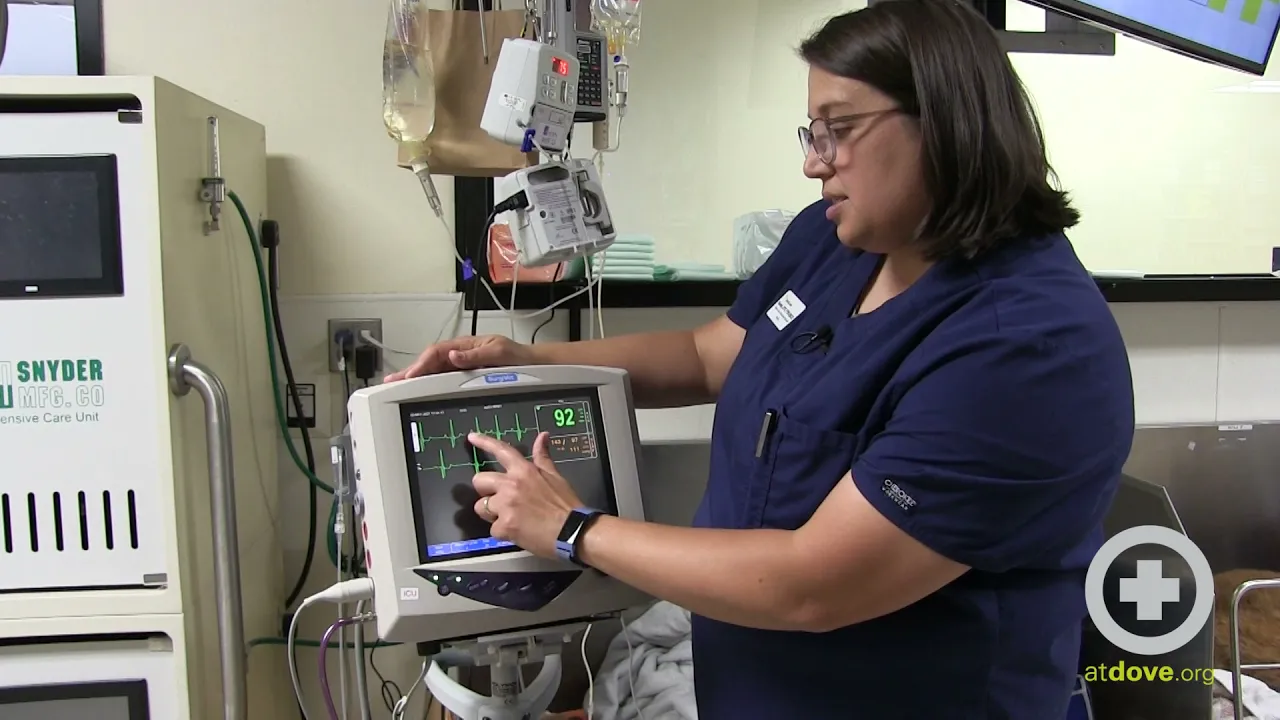
hi my name is sarah and i am a vts in emergency and critical care at dove lewis and i want to talk to you real quick about troubleshooting ecgs so we run ecgs all the time in veterinary medicine and it's actually one of the things that i know i was most intimidated about when i left school and i i think i see the same in some of our newer graduates and just want to give you some of the tips that i've learned along the way that may help you figure out the difference between normal and
abnormal on our pets so when i'm looking at an ecg one of the first things i'm looking for is to see if there is a p wave for every qrs and a qrs for every p wave sometimes that can be a little bit challenging to see the other thing that i'm looking for is that the intervals between these complexes are regular and that can help us determine if this rhythm is normal or not and you may not always be able to see that early on or you may see something like i see a little bit
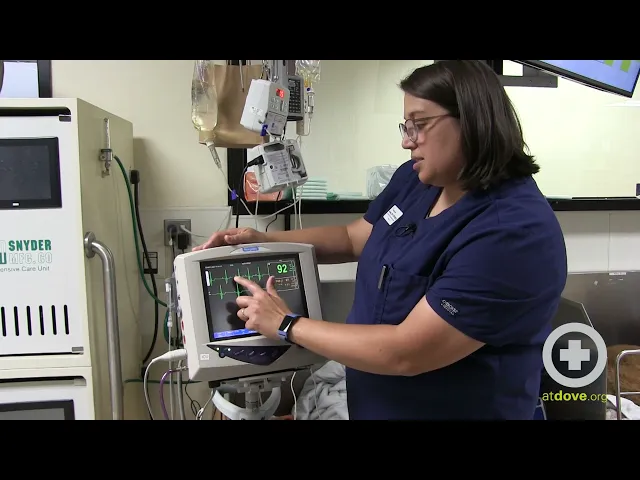
of a wave in him every once in a while and it's a little bit hard for me to tell if those are p waves or if that's motion or something else so if you're not sure with what you're seeing on the screen if that's normal or not you do have the ability to look at different views and that's one thing i think is really good to be comfortable with so i like to start on lead two so for most of our like really basic monitoring parameters we're using a lead three um but these can go
all the way up to lead 12 if you're going into the cardiology department and getting really fancy but we normally do lead three ecgs or three lead ecg's with and i like to keep it on lead too because it gives you the biggest complex that's easiest to interpret but sometimes you may see things on one on one view but not on the other so if i want to confirm that something i'm seeing exists on other things each monitoring parameter device is going to be multiple parameter devices a little bit different but you can usually click
and go to different leads so if i want to switch him to lead one you can see that that looks a little bit different and actually here i can't see p waves much at all every once in a while i think i see them so i may want to see what it looks like on lead three as well and there i can actually see a pretty clear p wave on each one of those p q r s t p q r s t p q s t so it's really nice so actually that leave three
gave me a good view but generally speaking start with lead two the other thing you can change is the size of your qrs like if you um you know are having if it's really small you're not getting a good image you can change the size of this i have this dog on uh 0.5 but you can go up quite a bit higher let me see so you can go and change that make that really really big so in here you can really see p q r s t p q r s t and those p
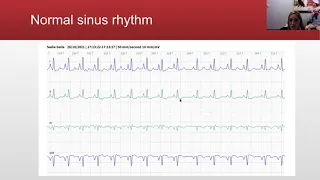
waves are a lot more visible on this waveform but they can get a little bit too big and then stack on each other a little bit so find something that you're comfortable interpreting and so when you understand normal it's easier to understand abnormal so if any reason this to me looks like a normal sinus um he does have like a sinus arrhythmia where you can see he has some closer qrs's and then they get a little wider apart and that's probably associated with his breathing but if i really want to confirm that printing a strip
is the absolute best way to interpret a waveform because if you're looking at a pqrs and you're trying to figure something out it disappears right a new one comes in or and it's really difficult to actually measure to see if those intervals are regular so if you have a device that prints a strip always try to do interpretations off of a strip to see to recognize if it's truly normal or abnormal so i'm going to print a strip here for us to look at i can tell the intervals by counting the number of squares between
are fairly regular every once in a while they get a little wider and you know that's probably a sinus arrhythmia on him which can be normal in dogs but it's really easy for me to identify that he has a p qrs and t with each waveform helping me rule out any arrhythmias so um you know kind of the big things the takeaways here are switch um from between lead one two and three if you're seeing something see if it's replicated on the other ones if it's replicated on each one it might be real but it
could be artifactual if it doesn't stay persistent on each one identify whether there's a p wave for every qrs and a qrs for every p wave and then identify if your intervals are regular or irregular and that's a great place to start with one other tip i like to share with people is that having getting a good signal can be hard in some animals if they have really dense coats so alcohol is really the best way to wet the fur and get conduction but if you are worried about hypothermia ultrasound gel works really really well
um to create a you know give you a good waveform and the thing i like about ultrasound gel one it doesn't you know contribute as much to hypothermia as some of the other you know alcohol does but it also doesn't dry as quickly so if you have an ecg like this on a patient for many hours ultrasound jaw will give you a good qrs for a longer period of time so that is the basics of interpreting an ecg