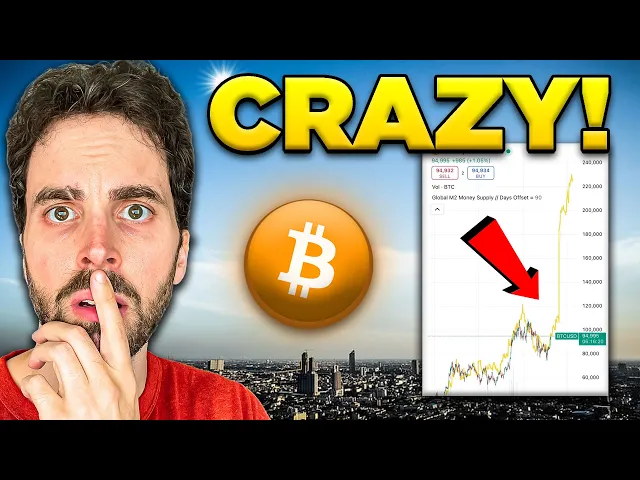
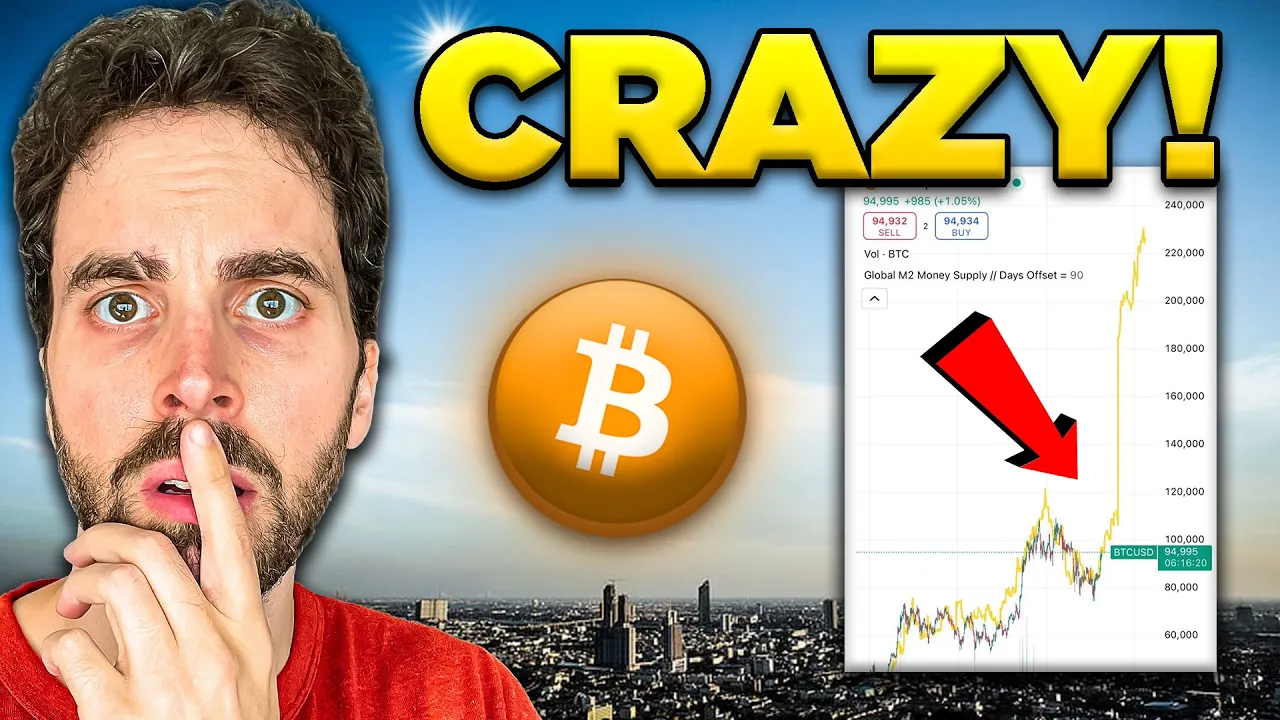
This is the craziest chart in all of crypto. This is the Bitcoin price compared to the global M2 money supply, aka the amount of money in the global system, the global economy, of which throughout Bitcoin's history, Bitcoin has had an over 80% correlation to the M2. Meaning, when more money gets printed or gets put into the global system, Bitcoin absorbs some of that money.
When the global economy contracts, Bitcoin's price contracts. Bitcoin has had an over 80% correlation. And per the latest data, if true, if the correlation remains, Bitcoin to hit over $220,000 by July because global liquidity is exploding.
That's a fact. Yet, most people are reading this data wrong. Do not be fooled.
Watch today's entire video to truly understand what's next with Bitcoin. And just to get everybody on the same page, global M2 money supply refers to the worldwide amount of money in an economy encompassing cash and deposits across major economies like the US, Eurozone, and China. And when looking at this chart, and keep in mind right now it's set for an 84day lag, which is about a 12week lag because when money goes into the system, it doesn't hit the assets immediately.
We can input the amount of days that we think is the most accurate. If you think there's no lag, which is not proven to be true. You see how that adjusts.
But it is commonly accepted that just based on the data, Bitcoin tracks M2 global liquidity almost exactly if you add about a 90-day lag period. So why did global liquidity just explode? And how is there more money in the system when we have the trade war when we have tariffs suppressing all markets, suppressing trade around the world?
How come there's more liquidity in the system? Well, keep in mind that this is global. It's not just one country.
It's definitely not just the United States, right? The Federal Reserve is still suppressing. The economy is strong overall and has made significant progress toward our goals over the past 2 years.
They have not cut rates this year. They're not quantitative easing. But that's why this is global.
Other countries around the world are printing, are lowering rates to try and deal with what they expect this global trade war to be. And let's switch this back to the day chart. And let's actually go back to when Trump was first elected.
Keep in mind, oh, let's actually put the lag back on. Or yeah, the let's go 84, 12 weeks. Even though some say it's a little longer, some say it's a little shorter.
And if we go back to the end of November, a little after Trump first took office, and we see the M2 global liquidity start to go down, even though everybody said, "Wow, Trump is great for the economy. Markets are going so much higher. We're not going to have time to talk about it if I'm elected.
" Global liquidity said otherwise for the short term. In fact, we can check back in on dated tweets around that time, end of November, end of last year. People were warning Bitcoin has tracked global M2 with about a 70-day lag since September of 2023.
I don't want to alarm anyone, but if it continues, Bitcoin could be in for a 20 to 25% correction. Again, even though Bitcoin price at the time was rallying, the M2 painted a pretty clear picture. And as we know, as we entered the Trump inauguration, as we entered 2025, the M2 correlation held up.
We saw about a 30% correction at the time. And looking where we are today, the yellow is everything that has already happened. The orange is also what has already happened for the M2.
The M2 has already done this, but based on the lag, this is what's in the future for Bitcoin based on this lag. And M2 today says Bitcoin is going much higher. And in fact, there's two people that I know of that really popularized the Bitcoin and global M2 liquidity correlation.
To me, I first found out about it through Raul Pal, Real Vision, him putting out the data. Other people say that Colin talks crypto really popularized this for the first time. Either way, you subscribe to Altcoin Daily for many different perspectives so you have all the information so you can make the best decision for you.
But for weeks now, global liquidity was pointing to Bitcoin hitting around $150,000 per coin by the summer. Many different analysts confirm this. Of course, some people use longer lags or shorter lags than others, but it was all headed in one direction.
Well, the news as of just probably the last 24 hours is that M2 absolutely exploded again and now showing Bitcoin to hit over $220,000 per coin by July. What caused this? Here's what just happened.
You may have noticed an enormous retroactive spike in global M2 chart data. See chart number one. And too long didn't read.
The massive pump in global M2 remains solid. And with BTC's climb over $95,000 recently, we are more on track than ever. But what about this outrageous spike in just the last 24 hours?
Well, to figure out what was causing this global M2 chart spike, I went one by one through all the countries that make up the global M2 data and discovered this spike was caused by a change to a single country's M2 data, India specifically. So, every other country appears normal. India is the only country that has this glitch change to its M2, meaning $220,000 per coin by July.
Not confirmed yet. This may have just been a little glitch in the matrix. I'm not sure if it is a Trading View bug or their data source or a change that India made specifically to the calculation of their M2.
I can't find much data on this being some kind of official change which suggests it could be a data bug of some kind. See chart two and we can see India's M2 money supply, something changed. So unless they printed an outrageous amount in under a day, which didn't really make a lot of headlines, there's nothing to confirm this.
There may have just been a change in how they calculate the data or just a short-term error. Upon casual observation, it looks like India's M2 increased by about 10x, almost a perfect 10x. Kind of like the decimal place was just moved right by one, which seems suspicious in itself.
And what does this mean for you? And seeing chart three, should we invalidate the whole broader trend? Do we throw everything out?
Quick fix. I removed India from the global M2 group until we learn more about why India's M2 changed so drastically. See chart three for the corrected M2 chart with India's M2 data removed.
The blastoff is still a go. Even taking out India's data many other global countries are printing or stimulating or cutting rates and Bitcoin to $150,000 at least by really the end of July still happening. Again, if the correlation remains and the correlation from this is an 84day lag was pretty exact on the day it was supposed to start and the day Bitcoin started its recent rally.
We are going to revisit this chart in the next few weeks. So, click subscribe to Altcoin Daily for an edge investing in crypto because we keep you informed. And if you subscribe, I mean, we're about to hit 1.
6 million subscribers for the first time in history. you might want to get in before that so you can brag. Hey, I got in before the 1.
6. Of course, completely free. Cost you nothing to subscribe.
So, try it out. Check it out and learn something every day about crypto. Now, keep in mind, this is my opinion on this.
Things that could invalidate this correlation in the short term is any big macro event which scares the market short term. sort of like Trump's liberation day, which was a self-inflicted wound in a sense. Other examples are just hypothetically if China were to attack Taiwan, if we had some other global macro sudden sudden uncertainty, that would derail any correlation in the short term.
But even with tariffs, even with an unknown 2025, keep in mind the reason that M2 is going up is sort of because there's global uncertainty in the world and other countries are cutting and printing. And for example, we can look back at 2020, the pandemic crash of 2020. And even though M2 had started to and continued to go up, that was the general trend back in 2020, short-term events did break the correlation in the short term, did not invalidate the trend long-term.
Now, my brother and I will be speaking at the largest Bitcoin conference in the world. Use code altcoin daily for 10% off your ticket. Link down below.
Like always, see you tomorrow.