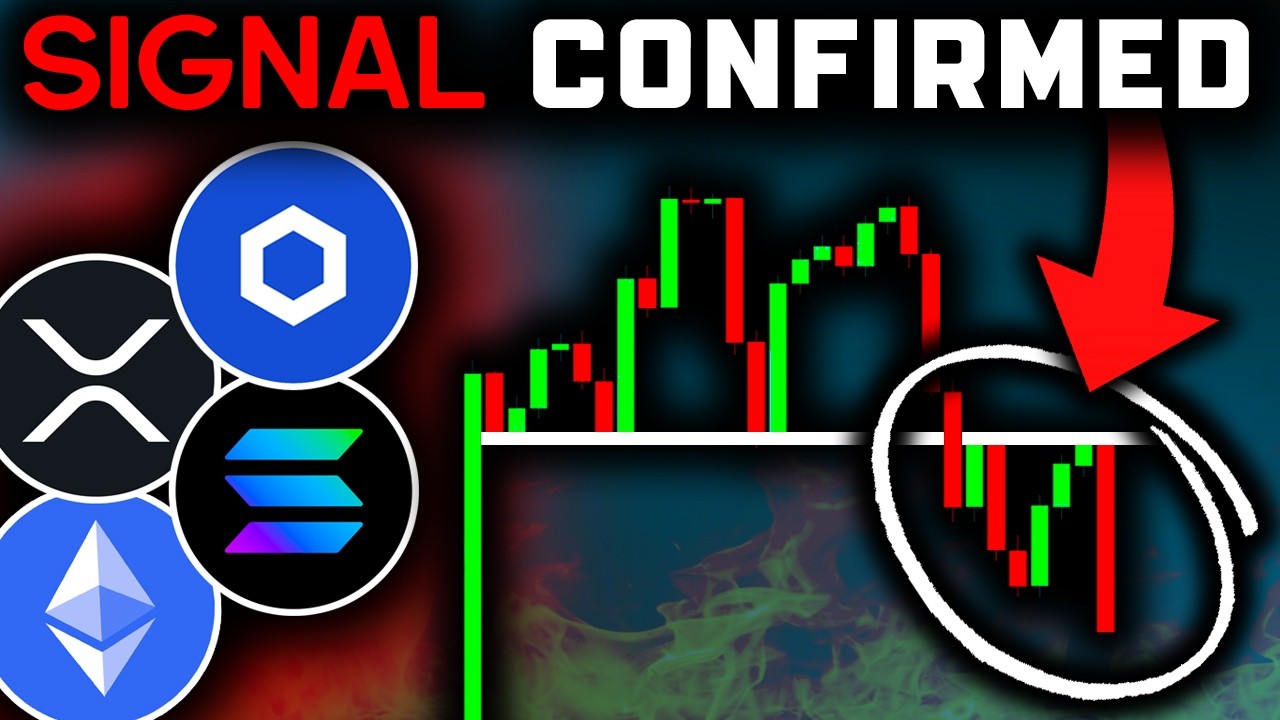
welcome back to the cryto channel of yourone my name is Josh and right now ethereum is actually bouncing from this important line of support while the price of salana is also continuing the short-term bounce but is now starting to run into this major area of resistance in the short term while the price of chain link is right now forming a new pattern that we need to pay attention to so I'll be talking about all of that and more later in the video so definitely watch to the end first of all starting off on the weekly ethereum chart and right now the price V is technically still within the multi-year bull market that we've been in since basically the middle of 2022 as we could see we're still forming higher lows and higher highs on these larger time frames but of course we have run into major resistance at close to 4. 1k as we can see on the 3-day time frame major resistance at 4. 1k as I've been saying for a while now on the channel and of course that's really an area of resistance if we're looking at the daily time frame based on these two previous highs sitting in between around 3.
9k to 4. 1k so if the price gets back up there continue to expect the price to struggle in that area because that is still acting a strong resistance as we can see here and we also have a bit of short-term resistance right here sitting in between around 3430 to 3560 after recently bouncing from this area of support sitting in between around $3,000 to 3. 1k but before that level of support zooming back out to the 3-day time frame we also have this fibon level right here which was previous resistance and is now acting as new support based on these 3-day candle closes and that's sitting at around 3240 to 3250 so just above 3.
2k acting as important support here on the 3-day ethereum chart but if we were to see a confirmed break below around 3. 2k and especially below this area of support So breaking below $3,000 in that case we have this area of previous resistance and also previous support once again acting as new support if we break below 3,000 sitting in between around 2. 7k to 2.
8k at least on The Daily time frame and if we're looking at this 3-day time frame we have a lot of support right here based on this Fibonacci level sitting right at around 2. 8k and now if the price of eth actually bounces from where we are right now and continues a bullish recovery in the coming weeks in that case we could possibly form a massive inverse Head and Shoulders pattern right here even if we were to see another little break to the downside here and then a bounce in the coming weeks that could still potentially form an inverse Head and Shoulders pattern on the weekly ethereum charts because as I've said recently here on the channel right now we have a possible left shoulder a possible head and right now we're potentially forming a right shoulder all we need to see in order to complete the formation stage of this pattern is a recovery in the price of e at some point in the next few weeks or so back up towards this resistance at around 4. 1k and then we need to actually break out above 4.
1k with ideally a weekly candle close above that level in order to confirm that breakout and confirm this pattern so right now that possible inverse Head and Shoulders pattern is not confirmed right now is just possibly forming but what is confirmed and has already been playing out over the last couple of weeks is of course this bearish Divergence on the daily ethereum chart and technically speaking as of record in this video the bearish Divergence is still currently active for the price of eth on The Daily time frame so as I've been saying since all the way back up here expect a bit of a short-term pullback or at the very least some choppy sideways price action as the most likely outcomes after a bearish Divergence and once again right now this is technically still active so in the immediate short term here in the coming days I'd not be surprised if the price just chops around a little bit maybe even sees another slight little pullback like that for example but remember when we're zooming out looking at the bigger picture that's just a minor pullback within a multi-year bull market which we've seen multiple larger pullbacks during that bull market as we can see when we're zooming out looking at the bigger picture and if we're taking a look at the chain link chart on the weekly time frame right now the price of chain link is still bouncing from this golden pocket area of previous resistance now acting his new support in between around $21 to $23 so of course this is good news here in the short term now that we're actually holding that level and flipping it into new support that is good news for the price of chain link because if we actually see a weekly candle close confirming below around $21 in that case of course in the short to midterm as in talking about the coming weeks or possibly months that would be bad news for chain link and likely Point towards a drop at least down towards $18 and below that we have this major level of support sitting at around $16 and below that we also have significant support at closer towards just above 122 to $13 right around there acting as major support but remember before all of those levels of course we still have a lot of support at this golden pocket right here which is currently acting as support as we can see the price bouncing from that area once again in between $21 to $23 but of course we still have resistance to the upside so if we continue this bounce to the upside continue to expect a lot of resistance at close to $31 because that's pretty much exactly where we rejected from as we can see right here this local high is sitting at pretty much exactly $31 very close to this Fibonacci level right at around $31 and we also have some resistance based on these previous Highs at closer towards $34 so overall on the larger time frames the price of chain leag has not really changed all that much over the last few days here on the larger time frames and if we're taking a look at the shorter term looking at the 8h hour time frame right now the price of chain link is actually playing out this bearish Divergence on the 8 hour time frame between these two different highs and so obviously if you've been watching my recent altcoin videos here on the channel you'll know about two different bearish divergences I was talking about right here so one right here as you can see and one right here as you can see and obviously they played out very well here in the short term but right now that is is potentially forming a larger bearish Divergence and technically already confirmed right now on the 8h hour time frame with higher highs between these two highs and lower highs between these two highs and as of right now the RSI on the 80 hour time frame has come back up towards this line of resistance and we've actually tested that line of resistance but we've not yet confirmed a breakout above that line so technically speaking we still need to see a breakout ideally here on the 8 hour time frame in order to start flipping a little bit more bullish again in terms of the trend but on top of all of that we have to also be aware of the fact that there's a possible Head and Shoulders pattern forming for the price of chain link here on the 8 hour time frame because right now we have a possible left shoulder a possible head and right now we're potentially forming a right shoulder for this head and shoulders pattern but as of right now it is not confirmed it's just potentially forming so in order to actually confirm this possible Head and Shoulders pattern we need to either see either a little bit more of a bounce and then a pullback or simply just a pullback in the coming days in the price of chain link back down towards this neckline and this neckline by the way is sitting at around $21. 30 approximately and so essentially confirming a break below $21 that would be bad news for two reasons obviously that possible Head and Shoulders pattern and of course breaking below the golden pocket because if we break below $21 with confirmation that would mean breaking below this golden pocket below important support which would be a bearish signal on its own and so that $21 level would definitely be an important level to watch out for for the price of chain link because if we actually come back down and then break below that $21 level to confirm this head and shoulders pattern then in that case looking at the bearish price target for that potential Head and Shoulders pattern if we confirm the break below the neckline then in that case that will set up a price Target at just above $15 at around $15.









![[LIVE] Pre-Market Prep –Mixed Markets With TSLA, AMD, AMZN Opening Near Lows](https://img.youtube.com/vi/2jsKFjGuIQo/maxresdefault.jpg)