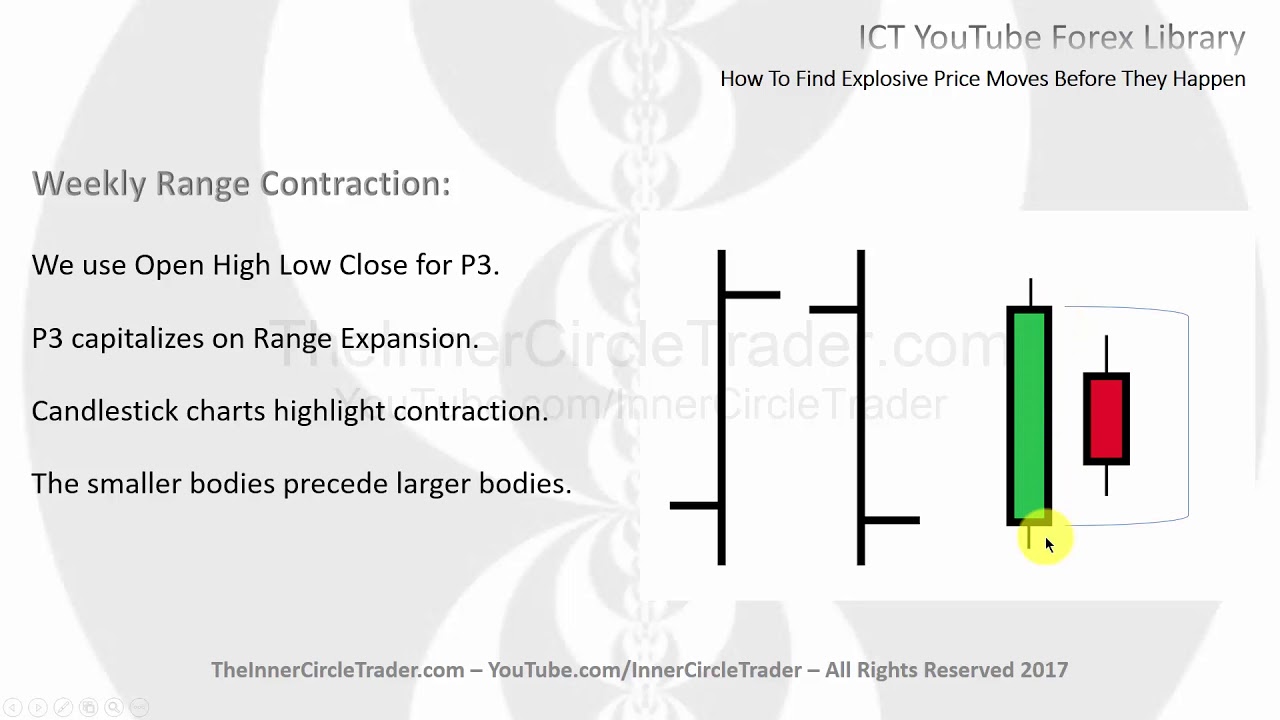
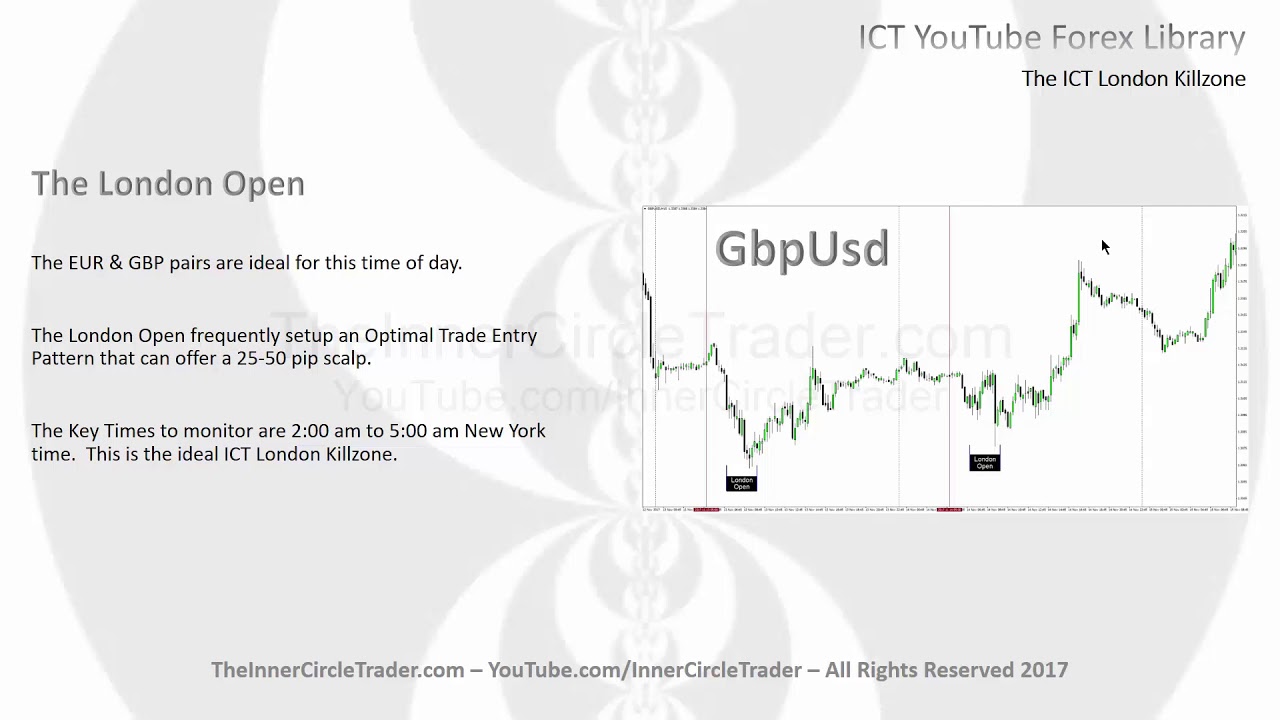
okay folks welcome back this teaching is going to be on the commitment of traders report insights for effective price action analysis okay commitment to traders report in graph format point to focus for this module how to locate Co T data loading commitment of traders graph insights from the commercials and how commercial hedgers can aid in your analysis okay folks we are on bar chart calm case is a website I use to illustrate commitment to change reports in graph form and we just click on this little toggle box up here to go to a commodity and
we're going to look at the Canadian dollar and right now the largest open interest is on the March contract of 2018 so we'll click on that and then we'll click on technical chart now we're going to scrub down into this area here we're going to go to candlestick turn the volume off I don't want to see this little box that it's very distracting to me personally but click on weekly contract we're going to go to three years is about a good enough timeframe to see and then we're going to go to commitment of traders now
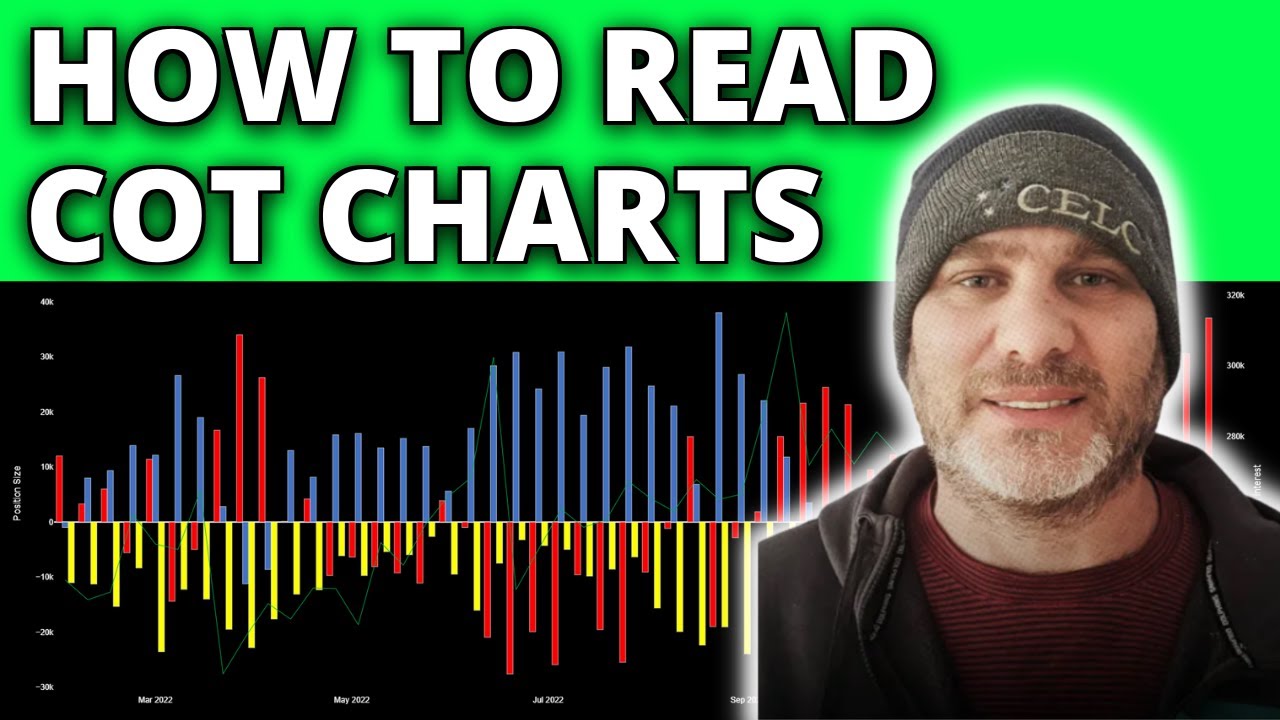
there's several here there's commitment of traders just aggregated then we have commitment of traders financial traders report and commitment of traders we just want this one okay click on that and we want to maximize that to large and we're going to click on draw chart will pop up here again thicker volume off and redraw that so that way we have our chart with the commitment a traders report slotted now you'll notice that there is a red line which is commercial speculators there's a dark blue line which is small speculators and there's a green line it's
large speculators now a large speculators are like large funds large private traders small specks are like anyone else in the retail world generally they're wrong about everything they're doing and the commercial speculators are many times diametrically opposed to this group over here at the large specs so what we want to be looking at is this red group because when they get a very large position no notice there's a zero line right here ok draw that out across the entire graph and I'll put that on the chart so you can see it by having that anything
above the line would be deemed bullish and anything below it or at it would be neutral to bearish all this in here you see the big run-up in their positions this is they're buying a case of commercials are large hedgers the people that really know what's going on banks institutions insurance companies large speculators are traders okay they're they're large fund managers or private traders so when we see these big build ups this would be a net long position a very large net long position and you can see eventually price does in fact have a large
rally up now during all this consolidation here you can see even though the commercials were below the zero line which will be net short they went back above the zero nine and you can see now they have a little bit of a move higher and they dip back below the zero line they started selling off and then watch what happens when these equal lows have been taken out right here huge buildup of net long positions and look at the reaction in price on the Canadian dollar as a result huge extrapolate a move on the upside
what's it reach for a run above this old high back here okay so now we're in an area where we're heavily net short buy the commercials and you've seen their nice big drop down in the Canadian dollar as a result which is a bullish move for foreign exchange or Forex the pair is the dollar cad so if this is the futures contract is what we're looking at if this is bearish it's going to be bullish for the dollar cad pair if this currency in the futures market is bullish it's going to be bearish in the
dollar cad pair so what i like to look for is a significant net long position to justify my long entry and or a heavy net short position to justified my short position so if we go back and look at historical data we can see that there's major key turning points but the commercials or the red line indicate a very strong willingness to be a buyer or seller and by using this information we can glean insight and also build confidence behind our trades because we know that we have smart money entities behind us we'll show you
one more example and we'll probably have seen enough all right so we're going to use euro just changing that first letter to an e gives us the Euro on a weekly nothing else needs to be changed down here so we have again the Euro and consolidation every time there's a big buildup there was a small little rally in here big buildup in there Commission commercial Holdings late rallies and as price starts to drop below these equal lows look closely okay we have equal lows here price dips down below that on a weekly capacity and we
are in a net long position so commercials are accumulating those positions long and notice what happens we get above these equal highs here we have this high we have this high draw that out in time that's the 120 big figure their net short at that time okay so we have seen liquidation from 120 down to 117 and now we're consolidating again so the benefit of having this tool is to well gauge the maximum saturation in terms of buyers and sellers because if you haven't noticed already the red line they will put the top in the
bottom in the marketplace when everything gets to an extreme whether it be net long or net short they usually make the higher low the entire move because their pockets are played deeper than ours ever will be and they are the market notice also that just because they swung below the zero line like they did here that is in no way indicative of a directional change in other words if they're bullish up here and they swing down below there's your line that does not mean that they're gonna expect this thing to start going lower all this
means is they started doing a transition from a heavy long position to now that of a heavy north net short position okay so they were selling in this rally the problem is when I learned this concept from Larry Williams I felt that this was going to be the top as soon as this happened this would be the top and it should drop down I did not understand institution order flow where the orders need to be tagged first so there has to be some measure of liquidity ran out which we see here then a net short
position by the commercials would be significant or noteworthy so again this is just an introductory lesson to get you acclimated to the commitment rays report if you want to learn more about this subject matter these two books here are in my opinion the two best individual books on the topic you can see it's the rather inexpensive and it's also a book by Larry Williams how I made a million dollars trading commodities last year where he basically introduced it to the trading community and it took off like a wildfire problem is folks just simply looked at
the net short or net long position and Larry himself even mentioned sometimes got him in trouble but there are enormous benefits to understanding this information when you have also understanding of institutional order flow and how to read price action when you blend these two things together you get really amazing results and it's not limited just currencies it's in stock indices and it's in bonds and it's in commodity futures I hope you enjoyed this presentation if you'd like to find more can visit my website at the inner circle trader.com