Foreign I know many of you have seen a lot of videos on chat patterns on YouTube and how to trade them but most of these videos don't tell you why you should trade them and in fact why these chat patterns actually work in the market so this is going to be one of the most comprehensive courses on chart patterns out there many professional Traders even sell paid courses on chart patterns that Are worth thousands of rupees with very little content but guess what this course is completely free of cost and is exclusively for educational purposes
only so share it with all your fellow Traders and friends and if you are new to the channel consider subscribing to the channel and also enable the Bell icon so that you won't miss out on any upcoming videos now the working of these chart patterns are quite simple chart patterns work by representing the Market's supply and demand this causes a trend to move in a particular way on a trading chart forming a particular pattern so when a Trader looks at the price chart of a stock or an index it can often appear to be completely
random price movements this is often true yet within those price movements are patterns so chart patterns are geometric shapes found in the price data which can help a Trader understand the price action as well as make predictions about Where the price is likely to go however chart pattern movements are not guaranteed and simply trading the chart patterns is not a sure short way to success in the markets and it is better used alongside with other methods of market analysis so in general there are three types of chart patterns there are continuation chart patterns reversal chat
patterns and neutral chart patterns the topic of discussion in this video are continuation chart patterns I will Talk about 5 most common continuation chart patterns and why and how they are formed and how to trade them with the proper entry stop loss and Target setups so if you don't know what continuation chart patterns are as the name suggests these patterns signal that the existing Trend in the market will most probably continue or in simple terms it predicts that the market will continue in the same direction after the end of the pattern now most of these
continuation Patterns are formed as consultations in between Trends so it's like Market taking a tea break because of exertion and getting back to work after refreshment we will be discussing five patterns and their subcategories we will start off our discussion with flag patterns followed by Penance then we will talk about the ascending and descending triangles further we will discuss about the rectangle patterns and finally we will wind up with cop and Handle and inverted cup and handle patterns before moving on to the patterns let me make something clear up front it's none other than time
frames all these patterns that I am going to talk about forms in almost all the time frames from intraday to swing to positional time frames all these patterns work better as the time frame increases because it takes more time to form and therefore more people are aware of them moreover the time frame to trade These patterns will depend on your trading style the duration you want to hold positions and your expectations so I have already made a video on how to select the appropriate time frames to trade so you can watch that video to know
which time frame to choose depending on your trading style okay then let's get started the bullish flag or the bull flag as the name suggests forms during a bullish Trend the bull flag starts with a strong Almost vertical bullish trending move which then stabilizes and turns into a minor bearish correction with parallel tops and bottoms which are important levels of supports and resistance now there are three components to any flag patterns that make it so I am going to give you a few hints to correctly identify the bull flag we have to look for a
preceding up move or an uptrend which makes a flagpole as we know that the bull flag pattern forms during a Bullish Trend this means that the candles range is more bullish than usual and they tend to close near the highs so it is a strong indication of buying interest in the market and it also signals that the Bulls are dominating the market now after the strong move higher the market needs to take a break now this can be seen as a profit booking phase where the initial buyers are looking to book some of their profits
so here's where you can expect a potential Bull flag to form as the market does a pullback now the type of price action that is exhibited in the pullback is what separates a flag pattern from a normal pullback now what you are looking for is a shallow pullback that consists of small ranged candles compared to the earlier strong bullish move or it can be seen as a group of indecision candles after a strong bullish move now this tells you that the sellers are struggling to bring the price down and That the buyers are still in
control now if you see a steep pullback with large range of candles then it's probably not a bull flag pattern generally this retracement ends below the 38 percentage threshold of the original Trend as indicated by the Fibonacci so in general it may not be considered as a flag pattern if the retracement goes below 50 percentage of the pole now the tighter this range the more likely the market will break out higher now that we have Learned how to identify a bull flag we can discuss how to trade the flag pattern so I will discuss the
entry methods where to place the stop loss and how to set the targets now starting off with the entry criteria as it is a bullish continuation pattern we are only interested in the break above the resistance line so you can take a long entry following a breakout of the level that is you can enter at the moment when the price breaks above the resistance Trend line or you can look to buy a body high price of the breakout candle after it closes now the second method is to wait for a pullback or a retest back
to the breakout level and then take a long entry when the price moves higher or when the price moves above the breakout candle high now you may be probably wondering which one is a better method well there's no best approach let's say if you enter the trade as and when the breakout happens it could potentially Result in a force breakout also but if it is a real Breakout out it's the best possible price you can get alternatively if you wait for a close above the highs you will reduce your chances of a fast breakout but
if the breakout is too strong you will end up entering at a much higher price the same is the case with waiting for a pullback or a retest which may not happen often if the market is trending strongly and as a matter of fact you will miss out on the trade Completely so it is up to you to decide your entry strategy and continue practicing it over a large number of Trades and above all it is always recommended to confirm the validity of a breakout using volumes and other indicators so a higher than average volume
can validate a breakout most of the time as it shows the interest of the market participants and low volume breakouts are most likely to fail using momentum indicators like macd and RSI Can also help you identify your true breakout I have already made videos on all these topics so if you want you can check them out let us now focus on the criteria for setting stop losses so how to set your stop loss when trading the bull flag pattern now you don't want to set your stop loss at obvious levels like supports and resistances swing
highs or loss Etc and why is that because you can get your stop loss 100 easily it is as obvious a level to you As it is for others including the smart money so how do you get a proper stop-loss setup it's simple your stop loss should be at a level that if crossed invalidates your trading setup so what are we trading here we are trading a bull flag and the pattern becomes invalid when the price breaks and closes below the bottom trend line support so you have to keep your stop loss below this particular
support level but there are still chances of long Wicks which can take out your stop loss and then move higher in the desired Direction which can be pretty annoying so to be extra safe you can give your trades more breathing space by setting your stop loss a particular distance away from the market structure using an indicator like ATR so once you identify the swing low of the bull flag pattern set your stop loss one ATR below the swing low level and now let's learn how to set Target for bull flag patterns now There are many
ways you can cash in your winners and one of the most common approaches is to have a predetermined profit Target based on the length of the flagpole this method is also known as the price projection method let's measure the length of the flagpole from the bottom of the bullish price move to the top of the resistance level and then project this length from the breakout point above the resistance trend line and this will be your profit Target in The future an alternate method is to choose to Trail your stop loss until the market takes you
out of the trade why is this a better option think about this the bull flag pattern usually appears in a strong trending Market but just after it breaks out of a range in such market conditions there is a lot of potential for the trend to continue and the only way to ride it is to Trail your stop losses now the question is how to Trail your stop loss in the best possible Manner well you can use a tool like moving averages or Channeler stock to Trail your stop loss and only exit the trade the market
closes Beyond it moreover it is much better if you use a combination of both the projection method and the trailing stop loss method so that you can predict the future move beforehand using the price projection method so as to lock in part of your profits there and then write the rest of the position using the trailing stop Loss and thereby not impacting your psychology and avoiding any potential losses now moving on in the market there are numerous opportunities that are available for trading bull Flags but if you were to ask me to select a few
I would choose 4 different scenarios to trade with the bull flag so that my risk to reward is satisfactory now these four scenarios includes number one the formation of bull flag during a level Breakout which is followed by a primary Pullback the second scenario is when the flag formation occurs during an uptrending Market which further signals a trend continuation the third scenario is when bull Flags occurs inside a range market and the final case is when the full flag occurs in a downtrend signaling a trend reversal now the entry Target and stop loss criteria are
the same for all these cases so I won't be discussing them individually for each case let us take a look at the first Case this happens when the market breaks out of a range and then does a pullback for the first time this is one of the best times to trade the bull flag pattern and why is that because when the market is in a Range it will eventually have to break out and besides the longer it stays in a Range the harder it will break so what we are concerned about here is a resistance
breakout where we can expect a bull flag to form so when the market finally breaks out the Traders who miss the breakout move can wait to enter the market at the first indication of a pullback these primary pullbacks usually have a shallow retracement as not many Traders want to trade against the strong momentum and this presents a pullback trade with a very high probability so if I were to explain the process in a rather simple fashion it would go something like this first of all you have to identify a range Market or a market testing
a Resistance level for quite a while now let the market break out of the resistance level now you have to wait for a bull flag pattern to form in the form of a primary pullback now once you find such a formation you can look to take a long entry on the break above the heist has it ever occurred to you that you think the price is too high and it would be better to wait for the price to retrace to the support or back to the Breakout level before you go long but the next thing
you know the market continues to break new highs and you are left on the sidelines regretting your decision so have you learned something from this to put it simply in a strong trending Market it's far easier to buy breakouts than to wait for the price to pull back which rarely occurs in such a market you can use the bull flag pattern as an entry trigger here's how you can trade bull Flags in a trending market Now the first step obviously is to find the market Trend you can look for strong trending market with the use
of moving averages for example for short-term trades you can make use of 20 simple moving average and for swing or positional trading purposes you can make use of 50 or 200 period moving averages now for this case let us consider a 20 moving average when the price trades above the 20 moving average predominantly and is sloping higher we Can conclude that the market trend is strongly bullish in a short-term scenario now you have to wait for a bull flag formation to develop in the form of a pullback now once you identify your pattern you can
look to take a long entry now as I have mentioned earlier the same entries stop loss and targets can be used for this purpose predominantly you can expect a bull flag to form after a breakout or during a strong Trend however there are times When a bull flag pattern can form when the market is in a range and at a resistance level so in one of my price action videos I have talked about the concept of breakouts with build up era resistance or support level you can find the video on the I button if you
want to learn more about it afterwards now the same concept applies here a build up near a resistance level happens because there are no sellers stepping in or the buyers are willing to buy at higher Prices now whatever is the case this is a sign of strength and the market could break out higher so how do you identify such an opportunity primarily you have to identify a market which is in range then you have to wait for a flag pattern to form near the resistance level in the form of a build up now as always
you can trade the brake above the build up or wait for the market to close above the resistance level there is no change in the entry stop loss and Target criteria For this case also now if you are probably thinking what the hell this dude is talking about just a few minutes ago you said that bull flag is a trend continuation pattern now why are we looking for it in a downtrend yes there is no denying that the bull flag is indeed a trend continuation pattern but what if I tell you that there is a
way you can profit by using the bull flag as a trend continuation pattern even on a downtrend now this Method has to do with the market structure so if you don't know about the market structure you can watch it from my price action playlist it's a rather simple method you have to look for a few things before you proceed first of all the price must close above the downward trend line resistance now we are talking about a break in the downtrend structure then if the price forms a bull flag above this trend line resistance hola
you have got a jackpot trade what you're Doing here is trading between an ending downtrend and a potential starting uptrend you can benefit tremendously if you are able to catch the uptrend from the beginning itself now the entry stop loss and Target conditions will remain the same but I suggest you use a trailing stop loss such as a 20 period moving average since we are taking sort of a contrarian position just to be safe now a beer flag pattern is just the opposite of a bull flag pattern it is Yet another continuation chart pattern but
the beer flag signals that the market is likely to move lower so I will be quick with this one or else the length of the video will be too long and if you are able to understand everything associated with trading a bull flag then trading a beer flag is just a walk in the park you just have to flip everything you learned with the bull flag at 180 degrees and there you have it you now know beer flag pattern now Here's how to identify a beer flag first you have to look for a strong trending
move lower this means the range of the candles is more bearish than usual and they tend to close near the lows after the strong bearish move over the market takes a break in the form of a pullback now the pullback should consist of smaller range candles compared to the earlier bearish move and the more tighter the range the more likely the market will break out lower now the Strong bearish move represents the port of the flag and the price console rotation during the pullback forms the flag of the pattern the flag retracement should not move
Beyond 50 percentage of the poor length or else it is not considered a bare flag pattern now the entry criteria are also similar except for the fact that you will now be looking for shorting opportunities only being a bearish continuation pattern now you can look to sell when the price Breaks below the support trend line but it is usually prone to fake outs so the better option is to wait for the breakdown candle to close and then enter below its low but sometimes if the breakout candle is very large you'll be entering at a very
low price and the risk to reward will be affected so you can either wait for a pullback or rate US back to the breakdown trend line and then take a short entry when the prices start to move lower now the issue with This entry technique is that during a strong downtrending Market the price won't pull back often enough and you will miss out on most of the opportunities so it is up to you to decide your entry strategy and continue practicing it over a large number of Trades also make sure to validate if the breakout
is Real by using volumes and momentum indicators like mac drsi Etc when it comes to protecting your positions you can place your stop loss At a level that invalidates your trading setup so a beer flag pattern becomes invalid if the price breaks above the resistance trend line with that idea in mind you have to keep the stop loss above the resistance trend line or to be even safer you can give the price some breathing space by keeping one ATR buffer above the swing high level depending upon your risk appetite now finally the target can be
based on the price projection method or trailing stop Loss method in case of price projection method you have to measure the length of the flagpole and then project it from the breakdown point below the support trend line this will give you your projected future Target price for the trailing stop loss method you can make use of moving averages like 20 or 50 period moving average depending upon your trading style or you can use an indicator like Chandler stop to ride your positions in case of a range Breakdown or strong downtrend now it is a deadly
combination if you make use of both these techniques to execute your winners now the most important thing to figure out is where to find these flag patterns you can find a beer flag during a support line breakdown which is followed by a primary pullback now the breakout candles represents the flag while the primary pullback forms the flag consolidation of the pattern now you can take a short entry as per the Entry criteria of your choice and the price breaks below the flag consultation now the most common place where you will encounter a beer flag is
during a strong downtrend as we have discussed earlier we can identify the market Trend using moving averages now the selection of moving averages will depend upon the trade duration or your trading style for example the 20 moving average is good enough to determine the short-term Trend the 50 moving average is suitable to Identify the medium term Trend and the 200 moving average can gauge the long term Market Trend but the most important thing is to make sure that the price stays below the moving average and is sloping downwards now yet another occasion to look for
beer Flags is in a Range Market especially those where there is a built up happening near a support level now this buildup can sometimes be in the form of a flag consolidation and you can enter a short Position when the price breaks the build up and the support level now the entry criteria stop loss and targets will all be the same as in the other cases but make sure that the breakout is a valid one you can also find a bare flag at the end of an uptrend when there is a break in the uptrend
structure which is accompanied by a flag pattern consolidation now this will help you enter a trend reversal even before it happens Penance are a class of chart patterns that closely resemble the flag patterns and symmetrical triangle patterns in the way they form and give breakouts but if you were to consider a pennant and a flag as two brothers then the pennant is the more aggressive brother due to the explosive breakouts it provides and the reward for risk it generates now there are two types of penance bullish Penance and bearish patterns let us focus on the
bull Penance first now the bull pennant Is a chart pattern that forms a triangle during the pullback it would consist of two pods the impulse move which forms the leg or the ball of the pattern and the correction move which is formed as a result of the pullback now you may ask what is the difference between a bull pennant and a symmetrical triangle because they both look similar now the answer is quite simple the difference is in the duration of their formation with a symmetrical triangle you can clearly See the swings of the pattern however
the candles of the bull pennant are too crowded and two volatile for you to see the swings regardless a bullpenin is more similar to a bull flag pattern now as I have cited earlier bull Penance creates a more explosive breakout than bull flag pattern now let me explain the reason why I hope you have seen videos in which a Coca-Cola bottle is shaken and then thrown onto the ground now the cap explodes and the boat till flies off I don't want to go deeper into the physics of this but one of the factors that triggered
this event is actually the shape of the cork bottle itself if you try the same experiment with a Coke can you may not get the same result now the bottle is shaped similar to a nozzle with a width of the bottle becoming narrower towards the top in comparison to a can where the width is almost equal throughout so what's the deal once you shake and throw the bottle the gas Pressure builds up and the coke wants to get out and the easiest exit is through the cap but as they head towards the Gap the width
starts getting narrower the pressurized gases inside the bottle would go into rage mode and blast open the Gap please don't blame me for this terrible physics lesson but the point that I am trying to prove is that the same thing happens with buyers and sellers in a Bull Pen and pattern the shrinking prices from left to right of a Pen and pattern is a sign of impending volatility as both the buyers and sellers are itching to get out of the pullback now this can result in a rather explosive breakout but since the bullpen and pattern
is not a trend reversal pattern instead it is a trend continuation pattern we will only look for buying opportunities this means that you are better of trying to use this pattern to ride on the existing trainers rather than catching the bottoms now let Us talk about the entry stop loss and Target criteria for this pattern now starting off with the trade entry criteria one of the most costly mistakes that Traders make while trading the Penance is entering a bullpen and too early as you know ranging markets or even pool bags can be challenging to enter
for two main reasons the range can overshoot or the range can undershoot now overshooting happens when the market is highly volatile and the prices will Move beyond the trend line more often forming false breakouts now undershooting is the opposite that is the price fails to test the trend line every time in case of a bull pennant we should be more cautious about overshooting due to the tight range so what would happen if you buy as soon as the breakout above the trend line happens or if you place a buy limit order above the swing High
more often than not the price could easily touch Your buy order and reverse back into the range forming a fake out or overshoot now this can be annoying and can result in losses so what is the key here now the ideal thing to do is to wait for the bullish breakout candle to close above the pen and line if the price makes this kind of a move it's clear that the buyers who got squeezed finally managed to break out strongly similar to the case of a exploding Coke bottle so you can look to to buy
Above the breakout Candle's high price but sometimes the breakout candle will be too large and you will be buying at a very high price thereby affecting your robot tourist ratio the best move in such a situation is not to take the trade at all or you can wait for a pullback or retest back to the breakout level and then take an entry when the price starts to move higher but because of the explosive nature of breakouts from the Penance the chances for a pullback or retest are Fairly dim so the best possible entry could be
above the breakout candle high now validating the breakouts using volumes and other momentum based indicators can be a good practice during the pen and consultation the volume has to decrease due to the evidence shrink in volatility and the breakout has to be supported by higher than average volumes which could indicate a rise in the buying interest now that you have learned how the bullpen and works and How to enter it let's talk about how and where to set the stop losses when trading the bullpen and pattern as I have already discussed you don't want to
set your stop loss at obvious levels like support and resistance swing highs or laws Etc because you can get stop loss 100 easily so your stop loss should be at a level that if crossed invalidates your trading setup now we are trading a bullpen in here and the pattern is deemed invalid when the price Breaks and closes below the bottom trend line support so you have to keep your stop loss level below this trendline support or below the swing low level to be precise now there are still chances of long bicks due to the overshooting
issues which can take out your stop loss if you keep it very tight and then the price can move higher in the desired Direction which can be really frustrating so to be extra safe you can give your trades more breathing space or Buffer by setting the stop loss some distance away from the pen and Market structure using the ATR indicator now once you identify the swing low of the bullish pen and pattern you can set the stop loss 180r below the swing low level and finally let's learn how to set a target for the pull
pen and patterns now there are many ways that you can exit your windows and one of the standard approaches is to have a predetermined profit Target based on the length of the Leg or the pole of the pattern this is called the price projection method and here you have to first measure the length of the pen and leg then project this length from the breakout point above the resistance trend line now this will be your profit Target you can also choose to Trail your stop loss until the market takes you out of the trade now
is this a better option think about this the bullpen and pattern usually appears in a strong trending Market or just After the price breaks out of a range so in such market conditions there is a lot of potential for the trend to continue higher and the only way to ride it is to Trail your stop losses now to Trail your stop loss in the best possible manner you can use the indicators like moving averages or Chandler stop and only exit the trade if the market closes below it moreover it is a much better option if
you use a combination of both the price projection method and the trailing stop Loss method so that you can gauge the potential of the move beforehand using the projection method so as to lock in part of your profits there and then write the rest of the position using the trading stop loss method thereby not impacting your psychology and avoiding any big losses due to price reversals now that you have learned what a pennant is and how to trade one it is essential to make a note of where to find one so what are the different
types of Market Condition where you can find a Bull Pen and pattern now pull pens can be found almost anywhere be it in uptrend range or downtrend the only thing to remember is that whenever it forms in the market the bullpen end is a bullish continuation pattern and our bias should always be looking for long trades only with that in mind let's talk about each case separately first you need to Define what an uptrend is in terms of your trading style and Time frame you trade because if you can't Define a trend objectively based on
your requirements then it is difficult to spot a bullpen and setup that satisfies your trading style now the easiest way to define a trend is by using a trend filter such as a moving average now you can use any moving average like 20 period 50 period or 200 period Etc to identify the trend based on a short term medium term or long term perspective let's say I have a medium Term Outlook or I am a swing Trader and I make use of the 50 period simple moving average to define the trend now if the price
is above the 50 period moving average it means the trend is bullish for me then I will look for bull pennant opportunities and if a bullpen and pattern is spotted then you can look to take a long entry above the breakout candle and since we don't know how long the trend last you can even use the 50 moving average as your trailing stop Loss and we would exit only when the price crosses below the 50 moving average so here not only do we use the 50 moving average to filter Trends but we can also use
it to book our profits since the bullpen and Laser Trend continuation pattern you might have the idea that this type of setup is unfavorable so how exactly are we planning to trade the range Market literally speaking we are not trading the range Market what am I suggesting Now it means that instead of trying to buy the highs and lows within the range we wait for the range to potentially end that is we look for tight consolidations or build ups in the form of a Bull Pen and pattern which is forming near the resistance level so
the moment you see a bull pennant forming at the resistance it tells you that the buyers are starting to dominate and an explosive breakout is imminent you can look to enter above the breakout candle or when The price closes above the resistance and maybe you will even get a retest if you are lucky enough now the stop loss and the targets are same as we have discussed earlier and since there is no valid Trend you can use a title moving average such as a 20 period moving average if you wish to trade your stop loss
even though the bull pennant is a trend continuation pattern there is still a way you can profit by using the bull Pennant as a trend continuation pattern even on a downtrend now this method has to do with the market structure here you have to look for a few things before you proceed first of all the price must close above the downward trend line resistance now we are talking about a break in the downtrend structure then if the price forms a bull pennant Above This trendline resistance you have a jackpot rate what you're doing here is
trading between an ending downtrend and A potential starting uptrend so you can benefit tremendously if you are able to catch the uptrend from the start now the entry stop loss and Target conditions will be the same and similar to the range Market strategy I still suggest you use a tight trailing stop loss such as a 20 period moving average since we are taking sort of a contrarian position I won't go into all the details of a beer pennant this is exactly the opposite to Bull pennants now it is a Bearish continuation chart pattern it has
a leg comprising of impulse candles with a strong bearish body followed by a tight consolidation associated with smaller candles and a contraction in volatility we expect the price to break out explosively below the trendline support level and continue with the trend even though this pattern is usually found in a downtrending market we can also spot it when the price is about to break down from a range below a Support level where a buildup IS set up in the form of a beer pen and pattern you can even find it at the end of an uptrend
where the break of the structure is accompanied by a beer pen and pattern now if I were to discuss the entry criteria we will only look for shorting opportunities since the breakdown is expected to be explosive in nature we can look to enter when the breakout candle gives a close below the trendline support you can then short below the low Of the breakout candle in case if the breakout candle is too large and is affecting your reward to risk it is better to drop the trade or wait for a pullback to the breakout level which
happens less often in the case of a pennant so it is up to you to decide where you want to enter now make sure to validate the breakdown every time using volumes or momentum indicators or both now the volume generally declines during the pen and formation and it increases Above average when the breakout happens now the stop loss can be kept above the swing high level of the pennant and providing 180r buffer above the swing high can deal with the unexpected overshoots and stop loss handling now the target can be kept by using the price
projection method where the length of the leg is set as the Target by projecting it below the breakdown point or you can adopt the trailing stop loss method by making use of suitable moving Averages when you are planning to ride the trend and you only exit when the price closes above the moving average now moving on we will focus on the triangle patterns namely the ascending triangle and the descending triangle chart patterns so let's start with the ascending triangle patterns the ascending triangle is a bullish chart pattern that signals the market is about to head
higher now as you can notice the ascendant triangle has a Series of higher lows that approach a resistance line now this is a sign of bullish strength and for a few possible reasons now the higher lows are an indication that the buyers are willing to buy at higher prices now think about it if the buyers were not willing to buy at higher prices you won't see higher lows coming into the resistance now the fact that the market forms a series of higher lows tells you that there is demand even as the price continues Higher the
second point is that there is a lack of selling pressure so if there was actually a strong selling pressure the price would not remain at the resistance for a long period instead it would rather move lower very quickly but since the price is hovering near the resistance it means there is a lack of selling pressure even though it's an alluring level to sell yet another point to keep in mind is that there are a lot of buy stop loss orders that are Clustered above the resistance because as the price retests the resistance every time more
Traders will look to short the market and they will place their stop loss above the resistance level in such a situation think about what will happen if the market breaks out higher well all these by stop loss orders will be triggered and this will fuel further price advances towards the upside so don't make this common mistake when trading ascending triangle pattern Because most trading books will tell you to go short and the price is at the resistance level but not every resistance is meant for shorting instead you must watch how the price approaches it since
you have learned that higher lows coming into the resistance is a sign of bullish strength this means the market is likely to break out higher from the resistance and the last thing you want to do is to go short and trade against it I hope things are making Sense now we will talk about the entry criteria so how to better time your entry well there are a few ways to do it the first approach is to go along when the price breaks above the highs of the ascending triangle or above the resistance level now all
you need to do is to place a limit by order above the resistance level and you will be immediately long when the price breaks above the highs if the breakout is real This is one of the best prices to render but this method is very risky and chances are it might be a false breakout the next method is similar to the previous approach the only difference is that you wait for the price to break and close above the highs of the ascending triangle pattern you can under long above the breakout candle highs once the candle
closes this method reduces the likelihood of a false breakout but if the breakout momentum is quite strong You will be entering at a very higher price so if you are an experienced Trader then you can even enter the market as the price pulls back or retest to the resistance line of the triangle pattern now this can help you enter the trade even if you miss out of the breakout move and it offers a better entry price than waiting for the close of the breakout candle but the issue with this approach is that the market may
not give a pullback or retest every Time so it is up to you to choose the Android type that you like based on whether you are a conservative or aggressive Trader with your approach now make sure to validate the breakout with volumes and other momentum indicators to see if there is actually an interest in the market participants to take the prices higher now we will learn how to set a proper stop loss so that you don't get stopped out too early now it doesn't matter whether you are trading the Ascending triangle breakouts pull bags Etc
because the concept is the same your stop loss must be at a location that if reached will invalidate your trading setup this means if the market hits the stop loss you will automatically know you are wrong so a stop loss below the resistance level is not a very good idea so where else will you place it think about it what is the ideal place to set a stop loss so that if the market reaches it you know the ascending Triangle pattern is invalidated since the pattern forms higher swing lows and if the price moves below
the recent swing low and forms a lower low then we can be sure that our analysis has gone wrong so it is exactly the place where you need to keep your stop loss that is just below the recent swing low level you can give the price some breathing space by adding one ATR buffer below the recent swing low I hope it is clear now the third and most important point when And where to exit your winning trades for maximum profits now as always there are two techniques you can consider the trailing stop loss method and
the price projection method the idea of a trailing stop loss is that we have no idea how long a particular Trend will last so we Trail our stop loss to write the trend as far as possible to lock in your gains as the market moves in our favor so how do you Trail your stop loss well as I have mentioned a number of times you can Use an indicator like moving average for example you can Trail your stop loss using 50 period moving average for a swing trading strategy this means you will hold your position
until the market breaks and closes below the 50 moving average now some of you might be wondering why 50 moving average always actually there is nothing special about 50 moving average a much better question to ask is what type of Trends do you want to capture and what is your trading Style now for a long term trade you can use the 200 period average for short-term Trends you can use the 20 period moving average and so on the second method the price projection method is a classical charting technique to project where the price will exhaust
itself so here's how it works for an ascending triangle pattern you have to calculate the width of the ascending triangle from the highest point which is the resistance level to the lowest point Now add this amount to the breakout level and that's your price projection or expected Target level one of the issues with price projection is that the market can almost hit your target profit only to make a sudden reversal and sometimes it can reverse all the way back and hit your stop loss so what would you do to avoid something like that happening the
best idea is to combine both the techniques that is make a trailing stop loss and price Projection combo this means if the market moves in your favor but it hasn't reached your price projection level you can utilize the moving average to log into your profits so even if there is a sudden reversal you still protect what you have and do not give everything back to the market now the descending triangle is yet another logical pattern and if traded correctly it allows you to catch explosive breakout trades about to occur This is a bearish chart pattern
that shows the sellers are in control and it signals a bearish trend continuation now the descending triangle looks like a series of lower Highs coming into an area of support the pattern signals strong selling pressure and a lack of buying pressure usually when the price drops lower more demand comes in to push the price higher but that is not the case for descending triangle because as the price drops lower there is still a Lack of buying pressure instead the sellers are willing to sell at even lower prices that's why you get a series of lower
highs we attending the point to consider is that sell stop loss orders are clustered below the support level this is because many Traders will buy because the price is at the support and they will set their stop losses below the support level since that's what most textbooks teach them now as more Traders do it the cluster of stop losses below The support level builds up our time and since the market moves from one area of liquidity to the other the price is likely to break below the support and Trigger all these clusters of stop losses
which will increase the selling pressure and pushes the price downwards now being a bearish continuation pattern the most common way to trade a descending triangle is to go short when the price breaks below the support level still there are important things to Consider if you want to find the highest probability breakout rates the breakdown should occur near the apex of the descending triangle Apex refers to the tip of the triangle pattern where both the trend lines meet now the reason you want to short near the Apex is that it is where the volatility is the
lowest and the prices are squeezed now when the volatility decreases chances are the price will explode out of the descending triangle and quickly move in your favor On top of that the more times the support level is tested the better this is simply because when the price tests the support level multiple times it will attract more buyers and thereby increase the number of stop loss orders below the support level now this is great for a breakout Trader because if the price breaks below the support all these clusters of self stop loss orders would be triggered
thereby increasing the selling pressure towards the downside Now moving on we will focus on how to trade this pattern so how to time your entry and set your stop loss I don't know if you have observed whenever the price Falls it moves quicker than when it rises so if you wait for the breakout candle to close below the support level chances are the price might drop a lot and you end up chasing the market thus in this case it is preferred to use a limit sell order and enter the trade when the price just breaks
below the Support level now if you are a more conservative Trader and you do not want to blindly place a sell limit order at the breakout point because the price could give a false breakout and Rise higher so it is ideal to wait for the price to confirm your bias before shorting the markets after the breakout candle closes below the support level but there can be occurrences when you can miss the breakout altogether what happens then so if such a thing happens The last thing you want to do is Chase the market after a breakdown
of the pattern instead a better option is to wait for the price to retest the breakdown point now if you wait for the retest you are entering a favorable trade location where previous support is likely to act as a resistance level this means you have a tighter stop loss on your trade which offers a better reward to risk ratio but sadly pullbacks or retest don't happen very often with this Pattern also making use of volumes for the breakout validation is a good practice now what about the stop losses straight away ask yourself the point where
the descending triangle pattern gets invalidated is when the price moves and closes about the most recent swing high level so a good stop loss would be above the most recent swing high level and if you would like to be even safer give it some buffer like 180r and set it above the recent swing high now finally How to exit your winners for maximum profits now similar to every other pattern there are two ways to exit the winning trades price projection method and trailing stop loss method in the price projection method calculate the distance between the
highest and lowest point of the descending triangle now take this distance and project it downwards from the breakdown point this projected future price point is where you exit your trade after you enter a Breakdown of the descending triangle pattern you can also use the price projection technique to decide whether it's too late to enter a trade or not that is if the price is close to reaching its projection there's probably not much reward left in the move and you might want to skip the trade now the second method is using trailing stop losses and unlike
the price projection technique a trailing stop loss does not have a fixed profit Target instead you Trail your stop loss as the price moves in a favor so you can write the entire Trend now you have to decide on the type of trend you want to capture whether it's a short term medium term or long-term Trend and you trade your stop loss with the appropriate moving averages for example a 20 moving average can be used for a short term 50 period moving average for a medium term and 200 period moving average for long term Trends
then exit your trades when the Price closes Beyond or above the moving average so if you want to capture a price ring in the market the price projection technique makes sense and if you want to write Trends in the market then trailing stop loss works best now moving to our fourth category of patterns the rectangle patterns the rectangle formation is a classical chat pattern established by horizontal lines which represents the important support and assistance now this is a Continuation pattern that forms a trading range during a pause in the current market Trend it is quite
easy to identify the pattern because it has at least two comparable highs and two comparable laws these highs and lows can be joined to make two parallel lines that form the top and the bottom of the rectangle now a rectangle formation shows a period of indecision between sellers and buyers as they take turn throwing punches at each other but Neither of them have the dominance over one another so the rectangle patterns are also known as trading ranges or concession areas or consolidation zones in this case we are talking about continuation patterns so we expect the
price to break out and continue with the original Trend so in that sense there are two types of rectangles the top rectangle which is formed during an upward price move it signals the continuation of the uptrend the next Rectangle is formed during a downtrend and is called as a bottom rectangle which signals that the down move will continue after the breakout now the rectangle patterns can also reverse the trend so these reversal patterns are given specific names like double top and triple top when the price tests the resistance twice and Thrice respectively and then moves
lower the other category is double bottom and triple bottom where the price test the support level twice And thrives respectively and reverses upwards so in order to clearly understand what the pattern is about to do we have to wait till the breakout happens so it is essentially a confusing piece of price action if you try to learn this pattern by heart what I recommend is to wait for the price to give a real breakout and then decide if you want to trade with the trend or against it so in short in order to identify the
rectangle pattern we will Need to locate a trending stock that is having a period of consolidation and there should be minimum two tops and two bottoms that are horizontal to one another which will act as the rest distance and support levels as I have mentioned the top rectangle is seen during an uptrend you would need to notice a breakout through the upper level of the pattern now this will confirm that the bullish move is coming back and Traders can look to under long Positions when the pattern forms a break up with the resistance level to
continue with the bullish Trend while the bottom rectangle pattern is the total opposite of its bullish counterpart this pattern occurs during a downtrend and the price would need to break the lower support level of the pattern to confirm its presence and Traders can look to under short positions when the price breaks the bottom of the range to continue with the bearish trend now how to trade when You see a rectangle pattern for a top rectangle pattern you can enter a long trade when the price breaks above the resistance level if you are an aggressive Trader
looking for the best price to take an entry the downside is that it could be a false breakout and you can get stopped out the next approach is more conservative where we will be paid for the breakout candle to close above the resistance level most often this method will reduce the Chances of getting trapped in a fake out but the only limitation is when the price breaks out with huge momentum and you will now be buying at higher prices and finally what if you miss out of the breakout completely then the only option available is
to wait for a pullback or retest back to the resistance turn support level and take an entry from there and if the rateest doesn't happen don't chase the price just avoid trading it all together you'll find even better Trades make sure that the volume Rises during the breakout indicating a higher buying interest you can also use indicators like macd RSI Etc to do the same and for a bottom rectangle pattern with a bearish breakdown our primary Instinct should be to sell now here are the three entries possible the most aggressive is entering as and when
the breakout happens the more conservative approach is to wait for the confirmation after to the close of the breakdown Candle below the support level the final option is to wait for a rate test in case you missed the breakdown so I leave it up to you to decide make sure you validate the breakout with volumes and momentum based indicator each and every time now we will learn to set up proper stop loss we don't want the stop loss to affect our risk management so when you notice a rectangle breakout you have to measure the distance
between the support and resistance and then place your stop Loss in the middle of this length this is applicable to both top and bottom rectangles now your trade will be secured by doing this and you will be aware that the maximum you can lose from this trade is equal to half the size of the pattern now after buying or selling on the rectangle breakout pattern the stop loss should be placed at the midpoint because the breakout will likely to have shakeouts before continuing with the trend thus if you Put your stop loss at or just
below the breakout Point smart money will probably your stop loss before beginning to run with the trend now how to exit a profitable trade when trading the rectangle pattern there is a clearly stated rule about the minimum Target you should remain in your trade for a minimum price move which is equal to the size or the width of the pattern this implies that the distance between the support and resistance of the triangle Should be placed on the chart beginning from the breakout moment now since the stop loss is at the midpoint of the rectangle range
it means that the target is twice the size of the stop loss this enables a reward to risk of 2e's to 1 from the offset you can also use the railing stop loss method if you want to write the trend until it's exhausted there is yet another way in which Traders can successfully trade rectangles and that is by buying at the Support and selling at the resistance levels if the width of the rectangle pattern is very high now this can be used as an intraday or swing trading strategy if it provides a sufficient reward to
risk ratio so for a top rectangle pad button you can take along and read from the bottom support level and place your stop loss below the lowest Wick or candle formed during the consolidation and the target will obviously be the next resistance level Similarly for a bottom rectangle pattern you can look too short when the price reverses down from the top resistance level and place your stop loss above the highest Wick or candle that is formed during the consolidation the target is obviously the lower support level now let's jump into the final category of patterns
first of all I will talk about the cup and handle pattern the reason why I have kept the cup and handle pattern for the last is that there is Still an ongoing debate as to whether the cup and handle pattern is more of a continuation pattern or a reversal pattern in my opinion the cup and handle pattern can be both a continuation and a reversal pattern now it depends on where it is formed in the chart if it is formed during an uptrend then this pattern indicates a bullish continuation like likewise if it gets formed
during a downtrend the pattern will indicate a bullish reversal now I am not actually Curious about where the pattern forms but I'm more interested in the fact that the breakout always occurs towards the upside that is the cup and handle pattern is expected to give a bullish breakout now let's dive into the finer details the pattern comprises of two parts as the name suggests a cup and a handle and also a neckline which will act as the resistance the cup forms after a bearish price decline which is followed by a period of consolidation With smaller
or weaker candles that shows signs of the market bottoming after which the price makes a higher high towards the resistance which indicates that the Bulls are taking over from the beers gradually now it looks like a bowl or an object with a round bottom and the volume should decrease towards the middle of the pattern which is during the consolidation and then rise towards the up which indicates an increase in the Buying pressure how the price reacts at the resistance is important because it tells you whether there is still selling pressure available at the resistance now
a cup and handle pattern becomes invalid if you see a large sell-off from the resistance level as it tells you that the selling pressure is still available there and the market is not ready to head higher but if you notice that the price is holding up nicely at the resistance then it is a sign of strength As it tells you that the buyers are willing to buy at higher prices so the handle has to form a tight consolidation or build up under the resistance level at this point many Traders would do what they have learned
from many trading books that is price is at the resistance and it is time to go short now that's fine if the price has made a strong momentum move into the resistance and it got rejected strongly from there but if the price approaches the resistance and Forms a build up or even if it makes higher lows into the resistance then you have to to be very careful because this is a sign of strength which is telling you that the buyers are willing to buy at these higher prices and the last thing you want to do
is to short the market because it's likely to break out higher so the handle has to give a tight consolidation which can be in the form of either a bull flag pattern or a bull pen and pattern which by themselves are Bullish continuation patterns now moreover the volumes should decline during the consolidation indicating a lack of selling pressure also keep in mind that the handle has to be smaller than the cup and it should not drop into the lower half of the cup and ideally it should stay in the upper third of the cup the
deeper the handle moves down the less likely the market will break out higher now the handle is the last bearish attempt to push the prices lower And when it fails and the prices breaks above the handle we can expect the market to rise now let us take a look at the entry stop loss and Target criterias the first cup and hand confirmation comes when the price breaks above the tight consultation range so this is the most aggressive and cheapest entry price that you can find but since there is a resistance level above it the price
could just reverse and hit your stop loss so an alternative entry is to go Long on the breakout above the neckline this is the second best price you can get an entry end but there is still a danger of a false breakout in this method and if you are more conservative you can wait for the breakout candle to close above the neckline and then take a long entry on the next candle above the breakout candle Heist however sometimes the market closes much higher and you will have a poor reward to risk ratio now this will
result in a wide stop loss And a smaller position sizing on your trade and in such instances you can wait for the price to do a ShakeOut in the form of a pullback or retest pack to the neckline and you can plan to enter when the price reverses higher now make sure to validate if the breakout is Real by use using volumes and other momentum indicators another point to note is that the cups that have longer and more u-shaped bottoms gives a better signal and it is better to avoid the cups with A sharp v-shaped
Bottom now the second question is where should I set my stop losses now whenever you place a stop loss it should always follow this thumb rule your stop loss should be placed at a level where if the market reaches it your trading setup is invalidated now ask yourself when will a cup and handle pattern becomes invalid a cup and handle pattern invalidation comes when the price breaks below the handle of the pattern now this top loss setting is Same as in the case of a bull flag or a bull pen and pattern now you don't
want to put the stop loss at the exact low of the handle because the market could trade into that area of value and then reverse higher so instead give it some buffer below the handle like 180r below it and finally how to exit your windows the first method is obviously the classic price projection method here we measure the height of the cup from the bottom of the cup to the neckline and Then project it from the breakout point above the neckline this will be your future profit Target now the second method is to use moving
averages to Trail your stop loss and write big trends so in a trending Market the price can remain above the moving average for a long period of time and you will only exit when the price closes below the moving average moving on to the final pattern of this video the inverted cup and handle pattern if you flip a cup and Handle pattern upside down you will get an inverted cup and handle pattern this is a pattern that gives a bearish breakdown depending on where it is formed in a trend it can be a bearish continuation
pattern or a bearish reversal pattern but we are least interested in where it forms but we are more interested in the bearish breakdown that it provides the formation of the inverted cup shows a depleting demand and a lack of buying pressure which can Be validated by using the volumes now the handle should be a tight consolidation in form of a beer flag or a beer pennant which also comes with Contracting volumes now if the handle moves way higher beyond the 50 percentage of the cup then it is better not to consider it as a valid
pattern since there is enough buying pressure still available at the neckline or the support level which is pushing the prices higher the entry criteria are to Either take a short trade when the price breaks below the handle of the consolidation or when the price breaks below the neckline and a more conservative entry would be below the low of the breakdown candle after the breakdown candle closes below the support level and if you have missed out on an entry you can wait for a price pullback or retest back to the neckline and then go short when
the price reverses lower now the stop loss can be Placed with 180r buffer above the handle of the pattern and finally the target can be set equal to the height of the inverted cup from the neckline to the top of the cup and project it below the neckline from the breakout Point yet another way is to write the whole Trend using a trailing stop loss method using moving averages and exit only when the price moves above the average now that is all the major continuation patterns in a single video Now in the last part we
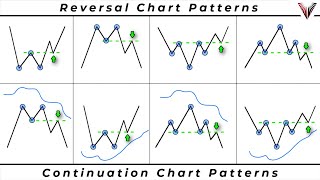
talked about five different types of continuation chart patterns however in this video we will talk about reversal chart patterns and we will not just talk about it we will examine why these patterns work in the market and why you should trade them we will discuss the four most common and most profitable reversal patterns along with their entry stop loss and Target criteria and if you don't know what reversal patterns are as the name Suggests these patterns signal that the existing Trend in the market will most probably reverse or in simple terms they predict that the
market will take a U-turn in the opposite direction of the existing Trend after the end of the pattern now most of these reversal patterns are formed as consultation in between the trends so it's like the market telling us that it is tired of going in a particular direction and is looking to move in the completely Opposite direction after taking some rest so in this video I'll be discussing four reversal chart patterns and there counter patterns starting with the head and shoulders and inverted Head and Shoulder patterns followed by double top and double bottoms then triple
top and triple bottoms and finally we will wind up with the rising and falling benches so without wasting any time let's begin The Head and Shoulders pattern is one of the most popular reversal jar patterns Out there and because it is popular the chances of making a mistake is also high now let us understand what this pattern really implies actually the pattern consists of four different parts the left shoulder the head the right shoulder and the neckline overall the pattern look simple right but what does it actually mean and why does it matter let's Analyze
This in Greater detail we will start from the left shoulder the initial Trend in the market is an Uptrend where the prices rally is higher and then the market does a pullback or a corruption and the left shoulder is formed as the market does a pullback and at this point there is no way to tell if the market will reverse because a pullback occurs regularly in a trending market and it may just be another swing low from which the prices can move higher the market then trades above the previous swing High forming a higher high
however the sellers take control or Resist the upward rally and push the price lower towards the previously formed swing low now the swing High formed as a result of this price action is the head of the pattern also the line connecting both the swing lows forms a support level called as the neckline now what we can observe here is that the uptrend structure of higher highs and higher lows is violated but still we cannot guarantee that a reversal will happen because the price might even Trade sideways now once again from the neckline the buyers make
a final attempt to push the prices higher but they fail to even break above the previous high or the head of the pattern and yet again the sellers take control and push the price towards the neckline this forms a lower high in compared to the previous High which indicates a shift in the sentiment towards bear us now the only level that stands in favor of the Bulls is the neckline which is also a support Level or in other words the neckline is the last line of defense for the buyers and if the price breaks below
it the market could head lower and begin the start of a new downtrend so basically the head and shoulder pattern signals a possible Trend reversal as the buyers fail to push the prices higher are all Head and Shoulder patterns worth trading actually there are a few things that you must seriously look at before you train The Head and Shoulder chart pattern These things are associated with how reliable is the head and shoulder pattern found now what you need to understand is that not all Head and Shoulder patterns are created equal because how the right shoulder
forms is a key Criterion to whether you want to trade the breakout or not for example if you have a head and shoulder pattern that has a very long right shoulder then you want to avoid buying the breakout and why is it slow because the price has Moved a very long distance from the highs of the right shoulder to the neckline of the support area which will attract more sellers on the way so the market is likely to face a buying pressure due to the profit booking by the sellers and also from the traders who
want to buy from the support level now this creates a strong buying pressure which will lead to an increase in the price and the pattern will fail so make sure that the right shoulder is Shallow and ideally it should stay below 50 percentage of the head other than this there are two more things you must pay attention to while selecting the best Head and Shoulder patterns first one is the market structure and the second one is the duration of the pattern let me explain each one of them it is true that head and shoulders is
a reversal chat pattern but if the market is in a very strong uptrend it is very unlikely that a simple chart pattern can Reverse the entire up move instead the market is likely to continue higher maybe the pattern can generate a short-term retracement but not entirely a reversal so make sure that you don't bet against a very strong trending Market just because you have seen a head and shoulder pattern now the second factor is the duration of the pattern a typical head and shoulder pattern can take 200 days 20 days or even 20 minutes to
form depending on the chart time Frames that you follow but with some common sense it is very obvious that the pattern that takes 200 days to form is more significant than a head and shoulders that takes 20 days to form which is more relevant than a pattern formed in 20 minutes and why you may ask because if the market breaks the 200-day pattern neckline there will be more Traders or buyers who bought at the support and most of them will keep their self stop loss orders just below the Neckline now these buyers will get trapped
and they will rush for exit or their sell stop loss orders will be triggered on breakdown which will further increase the selling pressure now when you take the case of the pattern formed in 20 minutes this may not always hold true because only very few people are aware of it and the pattern may not give you the desired result so a head and shoulder pattern on a higher time frame and one that took More time to form has a higher chance of success now this does not mean you go short immediately when the price breaks
the neckline there are a few ways to train the head and show the chart pattern in the best possible manner now I will start off with the trade entry techniques and there are four possible entry methods for this pattern the first and most aggressive entry is when the price break down the neckline now the idea is to wait for the Breakdown candle to close below the neckline and then take a short entry below the floors or the lower price of the breakout candle now the advantage of this technique is that you will be able to
enter into a train very early and perhaps you will get the best possible entry price but the drawback is that the price could reverse and give a false breakout and might even hit your stop loss so the second entry technique is associated with a breakout following a Buildup of prices now build up means a tight consolidation of prices near an area of value prominently near a support or resistance level you can learn more about this concept in the secrets of support and resistance in my price action course in this case we will pay it for
the market to form a tight consultation near the neckline or support level and if the market breaks down you can reference your trade entry just below the close or the low of the Breakdown candle now the advantage of this method is obviously the tight placement of stop loss and an improved reward to risk ratio which we will discuss in the next section and it also provides a good entry price but the drawback is that the breakdown candle can be huge and you will be selling at a much lower price now you might be wondering what
if I miss the breakout or what if the market doesn't form a build up and still continues to head lower Won't I miss out on the trade now this is a relevant question because buildups don't actually happen every now and then so another common method is waiting for a primary pullback in prices this technique lets you catch the price more even after a breakdown now here is how it works so if the market breaks down without forming a build up then we will wait for a primary pullback to occur which is a temporary up move
of prices with B candles which generally resembles A flag or panel pattern which you may obviously know how to great and eventually if the market does a pullback then you can look to go short on the break of the previous swing lows or enter right away when the price start moving lower and as I have mentioned the best pullbacks are those with shallow retracement and small Body candles but what if we get a steep pullback and with large potted candles what will we do then now if the pullback is deep then we Will wait for
the price to retest the neckline or the previous support turn resistance level as per the principle of polarity we have to observe the price retest the neckline and then wait for a price rejection from the neckline in form of bearish reversal candlesticks like shooting star bearish engulfing pattern Evening Star Etc you can learn more about reversal trading using candlesticks in my price action course and if you find there is a price Rejection then you can go short on the very next candle now the rate test technique lets you time your entry and even short the
market at better prices but the downside is that the market will not not always do a retest and you might miss out on the trade altogether another important point to keep in mind is that the volume should decrease during the formation of the left shoulder and the head indicating a loss in the buying interest and it should rise during the Formation of the right shoulder and also during the breakout and forming an interest in selling so make sure you use the right entry techniques at the right times now let us talk about the placement of
stop losses with respect to our entry criterians as I have discussed multiple times the stop loss should be at a level that if breached will invalidate your trading setup now since we are dealing with a head and shoulder pattern your stop loss should be at a Level that invalidates the pattern altogether to be fair if the price moves above the right shoulder the pattern will get invalidated so if your entry was aggressive as and when the price break down from the neckline then you should set your stop loss at or about the right shoulder of
the pattern now what if you took a short entry after built up near the neckline then you get the freedom to place a much tightest of loss preferably just above the build up Consolidation which will boost your water risk ratio by some margin now let's say you missed both these entries and you shortened the market after the prices formed a primary pullback then set your stop losses above the highest price in the group of the pullback handles or just place it above the neckline if the pullback is formed very close to the neckline and the
last method is if you have endured after a retest in this scenario the stop loss Can be placed just above the highest Wick of the group of retest candles or one can be more conservative and place the stop loss above the right shoulder of the pattern and finally we will take a look at how to exit from our trade for maximum profit well there are three popular techniques that you can use the price projection method that railing stop loss method and a combination of these methods now let me explain each one of them the price
projection is a Classical charting that determines where the move might end how it focuses on price exertion the idea is quite simple the prices will move a distance equal to the highest width of the pattern now in this case the highest width of the pattern is from the neckline to the head so all you have to do is to measure the width from the head to the neckline and then project this distance from the neckline towards the downside the second method is more like trailing your stop Loss to write big trends now if you have
followed me on my last video you know how to trade your stop loss to write massive Trends in the market one way you can do this is to Trail your stop loss with moving averages the selection of moving averages will depend on the time frame that you're trading on for short-term Trends a 20 moving average will do the job but for a medium term Trend a 50 moving average will be a good choice and for a long term Trend a 100 Or 200 moving average is the best possible option the idea is to ride the
trend and the price moves above the trailing stop loss where you can exit your position the last method uses a combination of both these techniques the idea is to exit half your positions at the price projection level and then write the rest using a trading stop loss by doing this you will be able to log into some good profits and not fall prey to the market reversals now I would like To add a few more points as to when and where to trade this pattern on the charts so when you think about it Head and
Shoulders is a reversal pattern but it is also a bearish breakout pattern with that idea in mind you can either trade this when the uptrend is weakening and you find a head and shoulder pattern that confirms the trend change or you can also trade this pattern when the market is in a downtrend and the pattern appears as a temporary pose in the Downward price Action Now by doing so you are taking a trade in the direction of the trend and not against the fault prices but make sure that you don't bet against a very strong
uptrend just because you part of this pattern and it may not work in your favor then moving on the inverse head and shoulders are inverted Head and Shoulders or a reverse Head and Shoulders pattern is a bullish reversal chart pattern that signals that the buyers are in control it is just Like a mirror reflection of The Head and Shoulders pattern so I won't be digging deep into the minute details of this pattern anyway let's find out what inverse head and shoulder pattern really means this pattern also has four parts the left shoulder is the result
of a pullback against the downtrend either because of a profit booking or eager buyer stepping into the market but the sellers are still in control as they push the prices lower however the buyers Are also stepping in which explains the stronger pullback to retest the previous Wing high level which forms the head of the batter from this we can assume that the sellers are getting weak as they couldn't push the price lower instead the buyers are getting stronger as they continue to push the prices higher retesting the resistance area previous swing High which forms the
neckline of the batter now the sellers tried to push the price down one last time but they Were met with the intense buying pressure thereby forming a higher swing low compared to the head of the pattern now this forms the right shoulder of the pattern and it tells us that this independent has changed from bearish to bullish and if the price manages to break above the resistance then the inverse head and shoulder pattern is confirmed and the market could continue higher now you might be thinking of buying when the price breaks out of the Inverse
head and shoulders and gain some profits but this is not easy because not all of them are reliable what matters is the strength of the market structure and the duration of the inverse Head and Shoulder formation so if the market trend is strongly bearish the chances of reversal are quite dim even if the pattern forms and could just be a short pause before the continuation of the trend now the other point is that the longer the inverted head and shoulder Pattern takes to form the more significant it is this also means that the shorter the
duration of the inverse head and shoulder pattern the more likely it will fail especially when you're trading in against the trend also keep in mind that how the right shoulder forms is also a key Criterion for whether you want to trade the breakout or not so let's say you have an inverse head and shoulder pattern that has a very long right shoulder then you might Want to avoid buying the breakout because the price has already moved a long distance from the lows of the right shoulder to the resistance area which attracts more bias along the
way so the market is likely to face a selling pressure from The Profit booking by the buyers and also from traders who want to sell at the resistance level now this will create a strong selling pressure which will lead to a price decline so a rule that you can follow is that the Right shoulder should be above 50 percentage of the head of the pattern now let's talk about when you trade the inverse head and shoulder pattern even though this is a reversal pattern the idea that inverse head and shoulder pattern is a bullish breakout
pattern is more prominent so it makes sense to trade this pattern when the market is in an uptrend and when you train the inverse head and shoulder pattern in an uptrend you just increase your odds of Winning because you are now trading with the trend and not against it another opportunity to trade this pattern is when you spot this pattern at the end of the downtrend and the inverse head and shoulder pattern acts as a confirmation that the existing downtrend is weakening and there's a possibility that the market might reverse and move higher but make
sure that you don't trade this pattern in a very strong downtrend because the possibility of trend change Is very low in such instances now let's move on to learning how to trade this pattern when your spot one we will discuss the entry criteria first the most aggressive entry is when the price breaks above the neckline or the resistance the idea is to wait for the breakout candle to close above the neckline and then take a long entry above the close price or the high price of the breakout candle the advantage of this technique is that
you will be able To enter into the trade very early and perhaps you will get the best possible entry price but the main drawback is that the price could reverse and give a false breakout and might even hit your stop loss the second entry technique is a breakout with build up now this happens when we observe a tight consolidation of prices near the resistance level or neckline so when you see a build up at the resistance it tells you that there is buying pressure Willing to buy at higher prices despite profit taking and short selling
from that level also the traders who went short at that resistance level are likely to have their buy stop loss orders above the resistance level so when the price breaks out of the resistance these clusters are stop losses will provide fuel to push the prices even higher and if the market breaks out above you can straight away enter into a long trade or you can wait For the candle to close and enter above the close or above the high of the breakout candle the advantage of using this method is obviously the tight placement of stop
losses and an improved reward to this ratio and also a very good entry price but the main drawback is when the range of the breakout candle is very huge and you will be buying at a much higher price now what if the market doesn't form a build up or it forms a huge breakout candle and still continues To head higher so if you miss both the above and race the other method is to wait for a primary pullback in prices to happen this technique helps you to catch the price more even after a breakout so
if the market break out without forming a build up then we will wait for a primary pullback to occur which is a temporary down low of prices with weak candles and if the marketing does form a pullback then you can look to go along on the break of the previous swing high Or end the right away and the prices starts rising and as I have mentioned the best pullbacks are the ones with shallow retracement and small boarded cameras but what if we get a steep pullback with large Body candles what will we do then so
if the pullback is very deep then we will wait for the price to retest the neckline of the previous resistance turn support level where we expect the buyers to come in we need to observe if the price retests the Neckline and if it does we will wait for a price rejection from the neckline in the form of bullish reversal candlesticks like bullish Hammer bullish engulfing pattern Morning Star Etc and if you find there is a rejection then you can go long on the very next candle now this retest technique lets you time your trade entry
and even take up positions at better prices but the downside is that there is no guarantee that the price will retest the level Especially if the market is in a strong uptrend and you might miss out out on the trade all together yet another important point to keep in mind is that the volume should decrease during the formation of the left shoulder and head indicating a loss of interest in selling and the volume should rise during the formation of the right shoulder and also during the breakout conforming an increase in the buying pressure so make
sure you use the right entry techniques At the right times this is exactly where you should reference your stop loss so if your entry was very aggressive as and when the price break out from the neckline then you should set your stop loss at or below the right shoulder of the pattern now what if you took along entry after a build up near the neckline then you have the convenience of placing a much tighter stop loss preferably just below the build up which will in turn improve Your reward to this ratio now let's say you
have missed both these entries and you entered a position in the market after the prices from the primary pullback then set your stop loss below the lowest price in the group of pullback handles including the evic or place it just above the neckline of the pullback home this very close to the neckline now the last method is if you are entering the trades after a rate test in this scenario the stop loss can Be placed just below the lowest week of the group of Rita scandals or you can be more conservative and place your stop
loss below the right shoulder of the pattern to save yourself from longx now we will take a look at how to exit from our trade for maximum profits and as previously mentioned there are three popular techniques that you can make use of the price projection method training stop loss method and a combination of both these methods the price projection Helps determine where the price move might possibly exhaust now here's how it works just calculate the distance between the head and the neckline then project this distance upwards from the breakout point or neckline this projected price
point is where you should exit your trade this price projection techniques helps decide whether it's too late to enter a trade or not and if the price is very close to reaching the price projection then There's probably not much juice left in the move and you might want to skip the trade but unlike the price projection technique a trailing stop loss method does not use a fixed Target profit instead you Trail your stop loss as the price moves in your favor so that you can write the entire Trend so in order to do that the
first step is to to decide on the type of trend you want to capture whether it's a short term medium term or long term Trend then you can Trail your stop loss with the appropriate moving averages like 20 period for short term 50 period for medium term and 200 period moving average for long term trades you will exit the trade only when the price closes below the moving average now the last method uses a combination of both these methods and you will exit half your positions at the price projection level and write the rest using
the trading stop loss by doing this you will Be able to lock in among the profits and not for pray to the market reversals let's move on to the third pattern which is the double top pattern now this is one of the most common chart patterns that you will encounter so this is a good thing because you will get a good number of Trades but this is also a bad thing because which trades to select will be a big concern so we will discuss the basics of what a double top pattern is how it works
and how you should go About trading it now a double top is a bearish reversal chart pattern and it consists of three parts the first Peak or the first price rejection the second Peak or the second price rejection and the swing low forms a neckline or an area of support now what does the double top chart pattern really mean the first Peak is formed as a result of the market doing a pullback at this point you can't tell for sure if it will be a reversal as pullbacks are very common in trending Markets from time
to time this is followed by a second Peak where the prices get rejected in the same area again indicating that the buyers are not very keen to buy at higher prices now this is the first time that the market could reverse lower and the break below the neckline will confirm our bias that the sellers are in control and the market could continue lower so in a sense the double top chart pattern signals a possible Trend reversal as the Market is unable to go higher but keep in mind that not all double top chart patterns are
created equally for example if you spotted a double top when the market is in a strong uptrend the chances are the market will continue heading higher and the last thing you want to do is to go short or trade against the trend just because you have spotted a double top chart pattern so there are two important things that you must pay attention to when trading a Double top chat pattern first of all you need to see where and how the pattern forms and secondly how long does it take to form or the duration it takes
to form the pattern as I have already mentioned you don't want to short a double top against a strong uptrend and in addition to this the space between the first and second Peaks is also an important factor worth considering this means you should probably avoid double tops with both their peaks very close to one another Instead we want to trade those double tops when the space is far apart from the first and second Peak and why does the space between the Peaks have to be so far apart the reason is quite simple when there is
more time and space between the first and second Peaks these swing levels or Peaks become more significant as more Traders will become aware of the price level and as you may have already guessed when a level receives more attention it attracts more Order flow as more Traders would want to trade around that area so when a large group of Traders gets it wrong with presence and opportunity that we can take advantage of so beware of trading double tops and double bottoms and trading on an indralay basis over a shorter time frame the higher the time
frame and the larger the space between the swing highs the greater the chances of a successful pattern now most trading gurus will tell you to short the double Top breakout and the price breaks below the neckline and they will ask you to set the stop loss above the ice however there are two issues with this approach first of all after a strong move lower a market could reverse higher proving to be of hours breakout and thereby hitting a stop loss secondly the stop loss is inherently very large and it does not offer a favorable reward
to risk ratio on your trade so there are a few ways that you can think of to fix this let's Start by discussing the trade entry criteria first now the most aggressive entry is when the price breaks below the neckline or the support level the idea is to wait for a breakout candle to close below the neckline and then take a short entry below the close or the low price of the breakout candle now waiting for the candle to close will ensure that the candle closes below the neckline and suggests that it is not a
fast breakout the other advantage of this technique is That you will be able to enter into a trade at a very early stage but the drawback is that the size of the breakout candle can be too large sometimes which can badly reduce your reward to restriction in some cases it is always beneficial to wait for a price build up to form near the neckline which acts as a support level in this pattern now we will take a short rate when the price breaks below the neckline after the buildup this will ensure a higher Probability of
success because the trader who are long near the neckline of the support will have their stop-loss orders placed below the support level and this will cut their losses if the market continues to head lower and once price breaks below the support level all the sell stop loss orders would be hit which will add further selling pressure thereby increasing the probability of success on top of that this trade will ensure a more favorable reward to risk Ratio as you will have a much tighter stop loss anyway problem with this approach is that the breakout candle can
be too large and also the fact that only a limited number of Trades are available now what if you miss the breakout trade This is the End not really you can still enter a trade if the prices form a primary pullback in the form of a flag or a pen and pattern a primary pullback is nothing but a temporary up move of prices with v candles most probably due To profit booking and a good pullback is always shallow and is associated with weak candles but what if we get a steep pullback with large bodied candles
what will we do then yet again we can look for a retest of prices back to the neckline which will now behave like a resistance level where we can expect to find the sellers to come in so if the price do the retest then we will wait for a price rejection from the neckline in the form of bearish reversal Candlesticks like shooting star bearish engulfing pattern Evening Star Etc and if you find there is a price rejection you can back yourself to take a short entry as the price begins to move lower the rateest entry
provides a better entry price than any other entry methods but the downside is that the prices don't always give a retest and especially in strong trending markets you don't expect pullbacks or retests a bowl make sure to confirm the breakouts With higher than average volumes and using other momentum indicators like RSI macd Etc your stop loss should be at a level that if breached will invalidate your trading setup since we are trading a double top pattern our stop loss should be at a level that invalidates the pattern altogether in that sense if the price moves
above the swing high of the pattern the pattern will be invalidated but there is a small twist number one if We do this the stop loss can be too large and so the reward tourists will be very low secondly the market can move up to the top of the resistance level and then reverse lower after hitting your stop loss just to form a triple top pattern and then move lower completing the pattern which can be really frustrating so what I recommend is to either place your stop loss at 50 percentage level between the swing top
and the neckline or if this distance is Too large then set your stop loss with an adequate buffer using the ATR indicator just above the breakdown handle high this could be your stop loss your entry was very aggressive that is you went short as and when the price is broke below the neckline now what if you took a short entry after a build up near the neckline then you get the freedom to place a much tighter and hassle-free stop loss preferably just above the build up or consolidation which will Boost your reward tourist ratio now
let's say you miss both these entries and you shot the market after the prices formed a primary pullback then we set your stop loss above the highest price in the group of the pullback handles or just above the neckline if the pullback is formed very close to the neckline now the last method is if you are entering after a retest in such a scenario the stop loss can be placed just above the highest Wick of the procopter scandals Or you can be more conservative and place the stop loss at 50 percentage of the width of
the batter now how to set your targets as you may have guessed there are three techniques to exit your trades price projection training stop loss and a combination of these two methods let me explain each one of them the price projection focuses on price exertion the idea is that prices will move an equal distance to the highest width of the pattern after The breakout now the highest width of this pattern is from the neckline to the swing top or the swing high so all you have to do is to identify the distance from the swing
top to the neckline then project this distance from the neckline towards the downside this will give you your desired profit Target the second method of trailing your stop loss is to write big moves we will make use of moving averages of different periods to do this and the selection of moving Averages will depend on the time frame that you're trading on so for capturing short term Trends you use a 20 period moving average for a medium term Trend you use a 50 moving average and for a long term Trend you use 100 or 200 moving
average and we will accept the trade only when the price moves below the trailing stop loss the last method uses a combination of both these methods the idea is to exit half your positions at the price projection level and then Write the rest of the move using a trailing stop loss by doing this you will be able to log into some good profits and not fall prey to the market reversals now there is one more important piece of information that I want to share which is associated with finding and trading double tops with a high
level of accuracy and win rate which involves the use of multiple time frame analysis the concept is rather simple the first step is to identify a Downtrending market or a downtrending price action on a higher time frame depending upon your trading style I have already made a video on time frame selection you can watch that video to learn more now what you need to do is to wait for the price to approach an area of resistance on the high time frame so if you find such a setup move down to your lower time frame then
look for a double top pattern on the lower time frame this is a very simple yet Effective technique that allows you to time your trade entries at the absolute highs of the double top pattern which by the way is the best possible price level that you can get and is also a professional way of trading this pattern so please keep in mind that if you are not comfortable using this then you would be better off ignoring it you don't necessarily have to consider all the options just choose one or two that work well for you
now we will focus on What a double bottom pattern is how does it work and how to approach it while trading it a double bottom pattern is a bullish Trend reversal pattern and it is the exact opposite of a double top this pattern also has three parts it has of a slow or fast price rejection followed by a second low or second price rejection and also a neckline which is an area of resistance connecting the swing high in between now what do this part of the pattern indicate a first low is formed And the market
declines lower forming a swing low and then moving higher at this point it is likely a retracement in the downtrend but then a second swing low gets formed when the market rejects the previous swing low level and retraces higher again so we can now assume that there is buying pressure but it is too early to tell if the market could continue higher we can only confirm the strength of the buying pressure and the price breaks above the neckline now when The price breaks above the neckline or resistance level it signals the interest in buying and
the possibility of the market moving higher so in short the double bottom pattern signals that the downtrend has possibly bottomed out and the price is about to move higher many Traders make this mistake of buying the break of the neckline after a double bottom pattern is formed but this won't always work in your favor because if the market is in a strong downtrend and it Forms small double bottoms every now and then the chances are the Market is likely to continue lower in addition to this not all double bottoms are made the same the time
frame that we use for spotting the pattern and the space between the swing lows or the swing bottoms are also important factors worth considering so a double bottom pattern formed on a higher time frame is more significant than one formed on a smaller time frame Moving on to the entry criteria for trading so an aggressive entry is when the price breaks above the nutline or resistance the idea is to either enter a long position on the breakout which can often cause the force breakout problem or you can wait for the breakout candida close above the
neckline and then take a long entry above the close or the high price of the breakout candle the advantage of this technique is that you will be able to enter into the trade Early and might even get the best possible entry price but the drawback is that the breakout candle could be too large or even the price could reverse and give a false breakout and hit your stop loss the second entry technique is a breakout with build up nearly neckline this happens when we observe a tight consolidation of prices near the resistance level or neckline
so when you see a buildup at the resistance it tells you that's buying pressure and people Are willing to buy at higher prices despite profit taking or short selling from the level also traders who shot from the web level are likely to have their buy stop loss orders placed above the resistance level so when the price eventually breaks out of the resistance all these clusters of buy stop loss orders will be hit and it will provide the Boost that the price needs to move higher and if the market breaks out of the neckline you can
enter your long Trade just above the close or above the high of the breakout candle now the advantage of using this method is obviously the tight placement of stop loss and an improved reward to this ratio and also a very good entry price but the drawback is that the range of the breakout candle can be huge and you will be buying at a much higher price now what if the market does not form a build up or it forms a huge breakout candle and still continues to head Higher so if you missed both the above
entries the third method is to look for a primary pullback in prices to happen this technique helps you to catch the price more even after a breakout so if the market breaks out without forming A build-up then we will wait for a primary pull back to occur which is a temporary down move of prices with weak candles and if the market doesn't pull back then you can look to go long on the break of the previous swing high or enter right Away when the prices start Rising now the best pullback should have a shallow retracement
with small bodied candles but sometimes we get a steep pullback to the neckline this is called as a rate test so when the price reaches to the neckline or now a support level we expect buyers to come in so we need to observe if price retests the net line and if it does then we wait for a price rejection from the neckline in the form of bullish reversal candlesticks like Bullish Hammer bullish engulfing battle Morningstar Etc and if you find there is a price rejection then you can go along on the next candle now the
rate test technique lets you time your trade entry and even take up positions at far better prices but the downside is that there is no guarantee that the price will retest to the level especially in a strong uptrend and you might miss out on the rate all together yet another important point to keep in mind is that the Rolling should increase during the breakout confirming and increase in the buying pressure so make sure you use the right entry techniques at the right times now let us talk about the placement of stop losses with respect to
our entry criteria the double top pattern becomes invalid and the price reverses from the neckline and closes below the swing low of the pattern and if you're aware to place your stop loss based on this idea Then stop loss would be too large and you will incur huge losses and moreover the price could reverse from the swing low and move higher again from your triple bottom batter so where exactly should you place your stop loss now what I recommend is to either place your stop loss at 50 percentage level between the swing bottom and the
neckline or if this distance is too large then set your stop loss with adequate buffer using the ATR indicator just below the low of the Breakout candle this could be our stop loss if your entry was very aggressive that is you went long as and when the price break out of the neckline now what if you took a long entry after a build up near the neckline then you have the convenience of placing a much tighter stop loss preferably below the build up which will in turn improve your water risk ratio now let's say you
have missed both these entries and you have entered a position in the market after the Prices from the primary pullback then you can set your stop loss below the lowest price in the group of pullback candles including the week or you can place it just above the neckline if the pullback is formed very close to the neckline and the last method is if you have entered after a retest in this scenario the stop loss can be placed just below the lowest week of the group of Rita scandals or you can be more conservative and place
the stop loss at 50 percentage of the distance between the swing low and the neckline of the pattern in order to save yourself from long X and finally we will discuss how to exit from our trade for maximum profits and as always there are three methods that we can make use of the price projection trailing stop loss and a combination of both the price projection calculates the distance between the swing bottom and the neckline so in the price protection Method you have to calculate the distance between the swing bottom and the neckline then project this
distance upward from the breakout point or neckline the projected price point or level is where you exceed the trade this technique will help you decide whether it is too late to enter a trade or not for instance if the price is close to reaching its price projection then there's probably not much meat left in the more and you might want to skip the Trade but unlike the price projection technique a trailing stop loss method does not have a fixed Target instead we Trail our stop loss as the price moves in favor so that we can
write the entire Trend so the first step is to decide on the type of trend you want to capture whether it's a short term medium term or long term Trend then you can Trail the stop loss with the appropriate moving averages like 20 period 50 period or 200 period moving averages respectively and We will exit our trade fully when the price crosses below these moving averages the final method combines both these methods you exit half your positions the price projection level and write the rest using the trailing stop loss so that you will be able
to lock in some profits and not lose money if the market reverses now same with the double top you can use multiple time frames to filter for high probability double bottom setups all you have to do is to Identify a higher time frame support area then move down to your preferred lower time frame and look for a double bottom pattern that leans against the higher time frame support level by doing this you can take a trade from the absolute low of the Swing bottom but do keep in mind that this is a more professional Android
technique so don't use it if you can't completely digest it if you have understood the double top and double bottom patterns properly then Triple tops and triple bottoms are just a piece of cake these are just extensions of the previous two patterns the entry exit and stop losses are the same but what matters most is the formation of the third string high or swing low respectively let's find out what these patterns signify a triple top is a bearish reversal chart pattern that signals that the sellers are in control the pattern starts with bios and control
as the price makes a swing High followed By a pullback but the first sign of selling pressure appears as the price fails to break out of the prior High and the market makes a pullback again and forms a consolidation this looks like a double top but this time instead of breaking below the neckline the market attempts to break out higher once again and fails again so there are three spikes visible or three failed attempts to break out higher this looks like a triple top and is confirmed only when The price breaks below the law of
the consolidation or the neckline support level I won't be discussing the entry stop loss and Target criteria because you can follow the same rules as with the double top pattern keep in mind that no patterns strategies or techniques work all the time this includes even the triple top pattern but the good news is that before the pattern fails it usually leaves some clues for instance if the higher time frame trend is still an Uptrend then the triple top pattern formed on a lower time frame is most likely to pay now when talking about a triple
bottom pattern a triple bottom is a bullish reversal chart pattern and is quite the opposite of the triple top pattern and it signals that the bias are dominant now the pattern begins with sellers pushing the prices down as the price makes a swing low followed by a pullback but the first line of buying pressure appears as the price fails to Break out of the previous swing low now the market made and the pullback and look like a consolidation this looks like a double the bottom pattern but instead of breaking above the neckline the market attempts
to move over once again and fails to break the law once again so there are three lows visible or three failed attempts to break out lower now this looks like a triple bottom pattern and it's only confirmed when the price breaks above the high of the Consolidation or the neckline resistance level the entries stop loss and Target criteria are similar to the rules of the double bottom pattern itself now moving to the last category of patterns the ventures you'll start off with a rising bench a rising wedge is a popular bearish pattern this pattern starts
wide at the bottom and then contracts as the price move upwards and the trading range gets smaller towards the top this pattern forms when the price consolidate Between upward sloping support and resistance lines where the slope of the support line is much more steeper than that of the resistance low one this implies is that the higher lows form much faster than the higher highs leading to a wedge-like formation this also means that the selling activity is gaining more traction and the buying activity is getting weaker also the contraction of the trading range from left to
right indicates a weakening of The existing trading activity but the rising wedge can be one of the most difficult chart patterns to accurately recognize and read while it is a consolidation formation like most other patterns the laws of The Upside moment them on each successive swing Heidi use the pattern its bearish bias however the series of higher highs and higher lows keeps the Traders guessing that the trend is still bullish this is where a Contracting range helps us the most Moreover to identify it as a rising wedge the price should test the upward sloping support
and resistance lines at least twice each now a shocking fact about Rising wedge pattern is that it can be both a reversal or a continuation pattern now it depends on its position in the price chart but the more important information is that regardless of the pattern being a reversal or continuation in nature pricing images are bearish this is what we will focus On the added Advantage is that we can spawn this pattern at the end of an uptrend or as a consolidation due to a short-term profit booking during a downtrend but actually the bearish confirmation
of the pattern does not come until the upward sloping support line is broken in a convincing fashion ideally we expect the volume to decline as the prices rise and as the wedge forms and there should be an expansion of rising volumes on the support line Braid which can be taken as a bearish confirmation now you can also use momentum indicators like RSI or macd to spot the shifting momentum anyways when the price does break the support line convincingly our bias is always towards selling on the brake top with a consultation in prices Traders know that
a big slash is on its way so they expect a breakout either to the top or the bottom so when the rising Edge is formed after an uptrend it is referred to as a Bearish reversal pattern but if it is formed during a downtrend it could mean a continuation of the round move now that we have learned how to identify a rising wedge we can discuss how to train the pattern so I will discuss the entry methods where to place the stop loss and how to set the targets starting with the entry criteria as it
is a bearish pattern we are only interested in the break below the upward sloping support dragline you can take a short entry Following a breakout of this level that is you can enter at the moment when the price breaks below the support trend line or you can look this help below the low price or even at the closing price of the breakout candle after it closes the second method is to wait for a pullback or retest back to the breakout level and then take a short entry when the price moves lower or when the price
moves below the breakout candle low now you are probably wondering which one is Better well there is no best approach if you enter the break of the loss it could be a force breakout but if it is a real breakout it is the best possible price you can get alternatively if you wait for a close below the lows then you will reduce the chances of a force breakout but if the breakout is too strong you will end up entering at a much lower price the same is the case with waiting for a pullback or retest
which may not happen often if the market is trending Strongly and as a matter of fact you will miss out on the trade completely so it is up to you to decide the entry strategy and continue practicing it over a large number of Trades it is always recommended to confirm the validity of the breakout using volumes and other momentum indicators so a higher than average volume can validate a breakout most of the time as it shows the interest of the market participants and low volume records are most likely Beautiful also using momentum indicators like macd
RSI can also help you identify a true breakout I have made videos on all these topics so you can check them out let's now focus our attention on the criteria for setting B stop losses how to set your stop loss when trading the rising match now you don't want to set your stop loss at obvious levels like support and resistance swing highs or swing lows Etc and why is that because you will get stop loss hundred easily Because these are as obvious relevant to you as it is to others including the smart money so how
do you get a proper stop loss setup and it's very simple as I have mentioned over and over again your stop loss should be at a level that if crossed invalidates your trading setup so we are trading a rising wedge pattern here and the pattern is invalid if the price breaks and closes above the top trend line resistance so you have to keep your stop loss Above This Resistance level so there are still chances of long weeks which can take out due stop loss and then move in the desired Direction so to be extra safe
you have to give your trades more breathing space by setting your stop loss some distance away from the market structure using an indicator like ATR so you have to set your stop loss one idea above the most recent swing high level let's learn how to set a target for the rising wedge pattern now there are many Ways you can cash in your winners and one of the most common approaches is to have a predetermined profit Target now the target can be measured by taking the distance of the back of the wedge or the widest portion
of the wedge from the support to the resistance level and then extending this distance down from the trend line breakout point you can also choose to Trail your stop loss until the market takes you out of the trade now why is this a better option think about This price image pattern usually appears in a downtrending market or at the end of an uptrend in such conditions there is a lot of potential for the trend to continue and the only way to ride a piece to Trail your stop loss now to Trail your stop-loss in the
best possible manner you can use moving averages or Chandler stops and only exit the trade if the market closes above it moreover it is much better if you use the combination of both the price Projection method and the trailing stop loss method so that you can gauge the move using the price projection method so as to login part of your profits there and then write the rest of the position using a trailing stop loss thereby not impacting your psychology and avoiding any losses due to reversals now moving on to the final chart pattern of this
video the following which following with chat pattern is like a counter pattern to the pricing wedge it Is created when a market console dates between two converging support and resistance lines for a falling wedge we support and resistance lines have to point in the downward direction or they should be sloping down and the resistance level have to be steeper than the support level the pattern generally starts right at the top and contracts towards the bottom as the price moves lower this sort of price action forms a corn like shape that slows down as the Swing
highs and swing lows converge as the price continues to slide down it will momentum and it signals that the bias are beginning to step in and are slowing the rate of the price decline now in contrast to patterns like symmetrical triangles which have no definitive slope or bias the following wedges should slope down and we have a bullish bias now as with Rising edges the foreign matches is also one of those challenging patterns to trade the Forum Image is seen as both a bullish condemnation and a bullish reversal pattern which gave rise to some confusion
in the identification of the pattern now both scenarios contain different Market condition that must be taken into consideration but the differentiating factor that separates the continuation and reversal pattern is the direction of the trend and the following which appears a falling wedge is a continuation pattern if it appears In an uptrend and it is a reversal pattern if it appears in a downtrend however this bullish bias cannot be realized or confirmed until the downward sloping resistance line breakout occurs convincingly by convincing I mean the volume should decline as the pattern progresses from left to right
or simply the volume should contract with Contracting prices showing a weakening of the existing price trend and the breakout above the resistance line Should be accompanied by higher than average volumes indicating a rise in the interest among Market participants now you can also make use of momentum indicators like RSI macd Etc to confirm the reliability of the backdrop now we will talk about the entry criteria so how do you better time your entry the first approach is to go along when the price breaks above the resistance trend line all you need to do is to
place a buy order above the Resistance line and you will be immediately long when the price breaks out above the level and if the breakout is real this is one of the best prices to enter but this is a very risky method and chances are might be a pause breakout now this next method is similar to the previous approach the only difference is that you wait for the price to break and close above the trendline resistance you can take a long entry above the breakout candle highs Once the candle process now this will reduce the
likelihood of a horse breakout but if the price momentum is strong you will enter your trade at a much higher price now if you are an experienced Trader then you can even enter the market as the price pull back or rate test back to the upper trend line of the pattern this can help you enter the trade even if you've missed the breakout mode and it offers a better price entry than waiting for the close Of the breakout candle but the issue with this approach is that market may not give a pullback or retest every
time so once again you can choose the entry type that you like based on whether you are conservative or aggressive in your approach but make sure to validate the breakout good volumes and other momentum indicators to see if there is actually an interest in the market participants to take the prices higher now how to set up proper stop loss so that you don't Get stopped out too early now it doesn't matter whether you are trading breakouts or pullbacks because the concept is the same your stop loss must be at a location that if Breeze will
invalidate your trading setup this means if the market hits the stop loss you will automatically know that you are wrong so a stop loss below the resistance level is not a good idea where we'll spend think about it where is the ideal place to set your stop loss so that if the Market reaches it you know the following match pattern is invalidated since the pattern forms higher swing lows and if the price moves below the recent swing low or break below the downward sloping resistance trend line then we can be sure that our analysis was
wrong so this is exactly where you need to keep your stop loss that is just below the swing low or the support level now you can give the price on breathing space by adding one ATR buffer below the recent Swing low for the support I hope this is clear now how to cash in your winners one of the most common approaches is to have a predetermined profit Target Target can be measured by taking the width of the top of the wedge or the wireless portion of the wedge from the support to the resistance level and
then extending this distance upward from the trendline breakout point you can also decide to Trail your stop loss now the trailing stop loss helps you ensure you Write the entire Trend now to Trail you stop using the best person every manner you can use moving averages or Chandler stops and only exit the trade if the market closes below it and if you are using the moving averages use 20 50 or 200 period moving averages depending on whether you have a short term medium term or long term trade objective moreover it is much better if you
use a combination of these two methods so that you can gauge the potential of the move Beforehand using the projection method so still locking part of your profits there and then write the rest of the position using the trailing stop loss method thereby not impacting your psychology and avoiding any potential losses due to reversals now that is all the major reversal patterns in a single video in the previous two episodes we have discussed the most important continuation and reversal patterns how To identify them and how to trade them in a very detailed manner when dealing
with both continuation and reversal patterns we have a clear idea or maybe we have a directional bias towards where the breakout will happen that is in the case of continuation patterns we will look to trade in the direction of the previous Trend before consolidation and for reversal patterns we will look to initiate trains in the opposite direction of the prior Market Trend but The third type of pattern that we are going to discuss doesn't have a directional bias associated with it when it comes to the breakout or the trade direction or in simple terms the
breakout of the pattern can be in either direction and we cannot judge the direction of the breakout before it happens this category of chart patterns is called as neutral chart patterns or bilateral chart patterns since we cannot be sure of a possible breakout Direction These patterns can be dangerous because of false breakouts more often than not you will find yourself entering a breakout above or below the pattern consolidation only to see yourself fall prey to a false breakout I have already made videos on breakouts and force breakouts in my price action course you can check
those videos to know more in this part we are going to discuss three bilateral patterns how they work and how to take trades including the entry Targets and stop losses now the three bilateral patterns under discussion are number one the symmetrical triangles followed by the symmetrical expanding triangles or broadening triangles and finally Channel patterns that is rising Channel and foreign Channel patterns if this series of videos are helping you become better at trading then please do like and share this video and support our efforts to build a healthy trading ecosystem so let us start our
discussion With symmetrical triangles we have talked about ascending and descending triangles the ascending triangle indicates a weakening of sellers with a contraction in volatility from left to right of the pattern while a descending triangle signals a weakening of buyers and a decline in volatility which leads to a strong breakout now the working of a symmetrical triangle chart pattern is quite similar to these two triangle patterns the symmetrical triangle is Also a volatility contraction pattern but here we are not sure who is the wheel player a contraction in volatility means that the price volatility in the
market is shrinking and it is a strong signal that the market is likely to break out soon now before we get into the breakout part let's first learn how to identify a symmetrical triangle pattern in the charts I hope you are familiar with the fact that for an ascending triangle there is an ascending Trendline support enough flat resistance line while for a descending triangle there is a descending trend line resistance and a flat support line now when it comes to a symmetrical triangle and as the name suggests the sides of the triangle slope equally which
means the slope of the ascending current line support and the descending trend line resistance happens to have the same slope now it is Within These trend lines that the actual consolidation of prices Happens and both of these trend lines meet at a common Point called the Apex now the triangle should comprise of at least two lower highs and two higher lows each to be considered as a valid symmetrical triangle pattern the pattern looks like a funnel with the price squeezing from left towards the right with a contraction in volatility which is associated with weakening of
candlesticks and price Action Now what does the price action indicate it simply Means that neither the buyers nor the sellers are interested in buying or set link this is evident from the lower highs forming the upper trend line resistance showing a lack of buying pressure while the higher lows into the lower trend line support signals are decline selling pressure as you can see the pattern started with big swings which got shorter and shorter as the pattern progressed the beauty of volatility contraction is that price Cannot be squeezed Forever at some point it must break out
and when it happens it offers tremendous returns now I have seen many experts believe that if a stock is rallying before the formation of a symmetrical triangle it will eventually break out to the upside on the other hand if a stock Falls before a symmetrical triangle consolidation forms it should continue its decline after the breakout now both of these assumptions are not right these triangles offers Little or no indication regarding the direction in which the stock or the index will eventually break out keep in mind that there is a lack of volume and price movement
which gives rise to a symmetrical triangle pattern and as a result it is impossible to assess the direction of the breakout another common mistake Traders make is chasing the breakout of a symmetrical triangle pattern only to get trapped in a false breakout so how do we eliminate this Mistake a great trade tool that you can use for identifying breakouts is volume rail breakouts usually occur with high trading volumes and high volatility while fake breakouts are usually associated with low volumes and look more like a range than a breakout since the levels of the triangles are
inclined it sometimes brings the price outside the frame of the triangle this usually gets Traders tempted and they assume that there is a breakout on the chart so Always make sure to confirm the breakouts another important point that you can keep in mind is that The Closer the price gets to the effects of the pattern and the tighter the price consolidation becomes the greater the chances of a real breakout and the price will quickly move in favor of your trade moving on we will now focus on how to trade this pattern that is how to
time your entry set your stop loss and determine targets or exits let's start With the entry criteria first now wherever this pattern forms we have to consider two scenarios first is a breakout about the descending trendline resistance and the second scenario is a breakout below the ascending trendline support level let's say the price breaks the upper trend line resistance level then you have four possible long entries available the first approach is very aggressive and the idea is to go along as soon as the price breaks above the Resistance trend line and all you need to
do is to place a limit by order above the resistance level and you will be immediately long when the price breaks out above the level and if the breakout is real this is one of the best prices to enter but this method is very risky and there are high chances that it might be a false breakout the second method is similar to the previous approach the only difference is that you wait for the price to break and close above the Descending trend line resistance we can end along above the breakout candle highs once the candle
closes this method reduces the likelihood of a false breakout but if the price momentum is strong then you will be probably entering at a much higher price now if you have missed both these entries then you can even enter the market as the price pulls back or re-test the resistance line of the pattern this method can help you enter a trade even If you missed the breakout move in this method we have to wait for the prices to form a primary pullback or even retest the resistance turn support level and then move in the direction
of the breakout so you can take a long position when the price begins to move higher the retest entry offers a better price than waiting for the closed captioning not available [Music] [Music] And then go short when the price starts to decline lower but make sure to validate the breakout first using volumes and other momentum indicators to save yourself from being trapped in a false breakout now how to set a proper stop loss so that you don't get stopped out too early now the concept is simple your stop loss must be at a location that
if reached will invalidate your trading setup this means that if the market hits the stop loss you will Automatically know that your analysis was wrong so if you talk about the stop loss placement for a breakout above the resistance level do you think setting your stop loss just below the resistance level is a good idea well I don't think so considering the chances of fake outs or even deep Wicks so where else should you place it think about it where is the ideal place to set your stop loss so that if the market reaches it
you know the breakout is invalidated now since The pattern forms higher swing lows and if the price moves below the recent swing low and forms a lower low then we can be sure that our analysis was wrong so so it is exactly the place where you need to keep your stop loss that is just below the recent swing low you can give the price some breathing space by adding 180r buffer below the recent swing low to compensate for the Deep stop loss handling Bricks now the same idea applies to a breakdown below the Ascending trendline
support you can place your stop loss just above the most recent swing high level formed or you can give one ATR buffer above the swing high level to be extra safe now where to exit your winning trades for maximum profits you may already be familiar that there are two techniques that you can consider the trailing stop loss method and the price projection method now how to exit your trade at the price projection level now price projection Techniques helps to project where the price momentum will exhaust itself so here's how it works for a symmetrical triangle
pattern all you have to do is to take the distance between the highest and lowest points of the asymmetrical triangle that is the widest distance of the pattern then depending on the breakout Direction copy and paste this distance or project this distance at the breakout point for example in case of a bullish breakout project this distance To be above the resistance level from the breakout point and for a bearish breakdown project the same distance to be below the support level from the breakdown point now this will give you the price projection or the expected Target
level now the concept of trailing stop loss is that we have no idea how long the trend will last so we will Trail our stop loss to write the trend as far as possible to lock in gains as the market moves in our favor so how do You actually Trail your stop loss well you can use an indicator like a moving average for example you can Trail your stop loss using a 20 period 50 period or even 200 period moving average depending upon whether you are considering a short term medium term or for long-term position
in the market this means you will hold your position until the market breaks and closes above or below the moving average depending on the direction of the breakout a more robust Technique is if you make a trailing stop loss and price projection combo that is you combine both these techniques this means if the market moves in your favor but it has not reached your price projection level you can use the moving average to lock in your profits so even if there is a sudden reversal you still protect what you have and do not give everything
back to the market moving on to the second category of neutral patterns this particular pattern is Known by different names be it a symmetrical expanding triangle or a broadening triangle pattern or a broadening bottom or top pattern Etc pattern looks exactly like a mirror reflection of a symmetrical triangle pattern now instead of the price squeezing from the left towards the right it actually expands with each string this is one of the reason why this pattern is tougher to trade and other chart patterns as the lows and Highest get taken out one by one it is
also called a megaphone pattern because of the expanding shape of the consultation when it comes to the identification of this pattern the pattern can be formed during an uptrend or a downtrend and it is referred to as a broadening top when it is formed during an uptrend and a broadening bottom when it is formed during a downtrend in the two trend lines connecting the widening highs and lows Of the prices diverge from each other it is an indicating of a broadening triangle pattern it shows the nervousness and indecisiveness of Traders even though the price action
is evident after each price Wing there is no clear dominance by a single player that is the buyers and sellers are trying to force their dominance but each attempt is counted resulting in a state of indecision moreover there should be at least two price Rings along the Sloping trend lines that is there should be at least two higher highs into the ascending trend line resistance and two lower highs into the descending trend line support to consider it as a valid pattern now similar to a symmetrical triangle pattern in the broadening triangle pattern to the breakout
determines the direction of future price moment please note that there are a few categories of broadening patterns be it broadening wedges broadening tops with a Flat support line or a broadening bottoms with a flat resistance line but I will not be discussing these patterns because most of these broadening price action patterns occur rarely in the market so I will always urge you to follow three to four strong patterns rather than running after each and every pattern on the charts the more focused you become the better the results will be now let's talk about the trading
criteria and let's start with the entry Techniques first as I have just mentioned the Breakout determines the future price Direction and dominance of a single player in the market this pattern does not come with a directional bias so we have to focus completely on the breakouts to determine our position so it all comes down to identifying a real breakout as discussed earlier one of the factors that will help determine a proper breakout is the volume so a higher than average volume can be a good Indication of a probable breakout moreover you can make use of
momentum indicators like RSI macd Etc to validate a breakout from a false breakout so with that in mind let's talk about all the possible entries when a breakout happens above the upper trenline resistance you can take a long entry as soon as the price breaks above the resistance as this will give you a good entry price but the downside is that it could be a false breakout and you could get trapped So a better alternative would be to wait for the breakout candle to close above the resistance trend line and then enter at the opening
of the next candle or above the high of the breakout candle now the problem with this approach is that if the breakout is associated with a good momentum then you will find yourself buying at a very higher price in addition to this you can take a long position after a price pull back or rate test back to the ascending trend line as You may all know of pullback or retrieve test is usually associated with v candles so you can take a long trade and the price begins to move in the direction of the breakout once
again the advantage of these methods is that you could get into a trade even if you missed the recount but on the downside a pullback or retest does not happen every time particularly if there was a strong price momentum during the breakout now the same entry methods are applicable in Case the price breaks down below the lower trend line support of the pattern in that case you can take a short entry on the breakdown or after the breakdown candle losses below the support level you can also enter a trade after a pullback or retest to
the lower trend line support now talking about stop losses placing stop losses for this pattern is actually hard task if you were to go by the general idea of placing the stop loss can be set below The top resistance line or below the lower support line in case of a bullish breakout and on the other hand a stop loss could be placed above the lower support line or above the upper trend line resistance for a bearish breakdown but think about it one of the stop loss is too tight and any price wing with long Wicks
can take out your stop loss while the other stop loss is too wide which will give you a poor risk to reward so what will we do one way to Counter this issue is to place your stop loss in the middle of the pattern that is at the center of the widest point of the pattern so if you are very aggressive with your stop loss you could even place the stop loss with respect to the breakout candle provided you give enough breathing room for the price action to happen this can be achieved if you place
your stop loss by adding some buffer with anywhere from one to three times the ATR value now finally we will Be talking about the targets for this pattern I won't be really interested in trading my targets I am satisfied with the projected targets so you can set two Targets using the price projection method the first Target would be equal to the distance of the smallest swing between the top and bottom trend lines this distance is further projected above or below the trend line depending on whether it was a breakout or a breakdown the second target
level will be equal to The distance of the widest swing between the trend lines which is projected from the record point now let's move on to the final type of bilateral pattern which are Channel patterns namely the rising and foreign channels the channel pattern is also known as the price channel the formation of the pattern is quite interesting and it is related to market trends you can learn all you need to know about market trends in my price action course now let's talk about the Rising Channel first the rising channel is formed by two lines
a bottom trend line support and an upper Trend channel line resistance so clearly the price is in an uptrend and as you may already know during an uptrend price forms higher swing highs and higher swing lows and when we connect all the swing lows together using a line prevent the uptrend line which will act as a support for the prices and if we connect all the higher highs it will give us the trend Channel line which will act as a resistance level for the future prices moreover we need at least two price rings on each
of these lines to consider it as a trend line and to confirm it as a wireless line we need at least three swings on each of them now another important thing to keep in mind is that the lines should be parallel to each other or in simple terms the slope of both the upper and lower lines should almost be equal and if the slopes are Different we know what it means right it will be a different price action altogether and it will form a rising wedge pattern let's now talk about the following Channel pattern the
existing trend is a downtrend with lower highs and higher lows by connecting all the lower highs together you will get a downtrend line which will act as a resistance level for the future price movements on the other hand if you connect all the lower lows you will get A trend channel line which will function as a support level for prices also keep in mind that the slopes of both these lines should be almost equal or in simple terms the line should be parallel now let's talk about how to trade a rising Channel pattern so you
can take two types of Trades when it comes to Rising Channel patterns you can either take breakout rates when the price breaks out of the channel or else you can trade the impulse price rings in the Direction of the existing trend from the trend line when it comes to breakout trading the rising Channel pattern is a bilateral pattern meaning that a breakout can happen in either direction but what I have observed is that the slope of the channel to some extent gives us the information on whether it will be a breakout or a breakdown let
me explain a Channel with a very high slope or a very steep price action will mostly break down below the support trend line While a Channel with a medium or lower slope will have equal chances of breaking out or breaking down anyway this is just an observation but we should enter a trade only after a breakout has happened let's say the price broke below the support trend line now if you are very aggressive you can take a short position as soon as the price breaks below the support trend line but this is risky as it
could end up being a false breakout and you will Get trapped so it is always ideal to wait for the breakout candle to close below the trend line and then enter on the opening of the next candle or below the low of the breakout candle now the downside is that if the breakdown is strong you will end up selling at a much lower price so yet another method would be when the price puts back or rate US back to the trend line so both the pullback and retest are associated with small boarded candles so when
the price Starts to move lower after the pullback or retest you can take a short entry sometimes there could even be a price build up near the support trend line which is a very good signal that that the price would break down lower and it provides a much better reward to risk because of a tighter stop loss now all these breakdown entry techniques are applicable even if the price manages to break out above the resistance trend line in such a scenario you will look For long trading opportunities either after the breakout and close above the
resistance or after build up near the resistance run channel line or even after a pullback or retest back to the trend channel line after the breakout the one of the most important factors to check out is the volume so if you want to know more about analyzing volumes you can check it out in my free Price action playlist anyway there should be a higher than average volume during breakouts you Can even use momentum indicators like RSI to validate the breakout moving on let's learn how to place your stop loss we will discuss the stop loss
for a breakdown below the support level the stop loss of the channel pattern will depend upon the width of the channel if the channel is too narrow then we can think about placing the stop loss just above the upper Trend channel line but if the channel is too wide then we need to think about a different stop loss Because if we place it above the trend channel line like before the reward to this ratio will be severely affected so what can be done for a breakdown entry we can place the stop loss just above the
midpoint of the channel from where the breakout happened but if you have taken a short entry after a build up near the support trend line then you can keep your stop loss just above the buildup or consolidation and finally if you have taken a position after a Pullback or retest then you can set your stop loss above the highest week of the pullback or later scandals with some buffer for Price action now in case of a breakout above the resistance trend line similar stop loss conditions can be applied there also but in this case we'll
be placing the stop loss below the midpoint of the channel from the breakout point if you have taken a breakout entry or you can place the stop loss below the consolidation for a Breakout after build up entry and finally you can set your stop loss with some buffer below the lowest week of the pullback or rated scandals for a pullback or retest entry now let's discuss the targets and as always we can follow three methods price projection trailing stop loss and a combination of both for Price projection we follow a price exhaustion concept for a
channel pattern we measure the distance between the upper and lower trend lines and Project this distance above or below the line depending on the direction of the breakout this will give you your projected price Target now one interesting observation of the rising Channel pattern when the price breaks down below the support trend line is that all the previous swing levels will act as price action areas so you will have to closely watch what type of price action is occurring and then decide whether to hold your trades for more Profitability or just exit your positions now
the other method is to use a trailing stop loss using moving averages of different periods depending on the type of trading style that you follow the central idea of this concept is that when a price breakout or breakdown forms a Channel or simply a consolidation there is a good chance that the trend will continue for a longer period and you can benefit enormously if you Trail your stop loss You will accept the trade only when the price crosses the moving average so for short-term Trends you can use 20 period moving average for medium term Trends
you can use 50 period moving averages and for longer term Trends you can use 100 or 200 moving averages but it is always a good practice if you use a combination of both price projection and trailing stop loss methods so that you will be able to log into profits whatever the outcome is now let's look At the second method of trading a rising Channel pattern this idea is only valid if the channel form this wide enough that is there should be enough points between the support and resistance line the idea here is to trade the
impulse move or simply to trade in the direction of the trend all you have to do is to look for buying opportunities from the trendline support level to write the impulse moves because impulse modes are associated with stronger momentum Candles and you will be trading along with the market price flow you can also make use of bullish reversal candlesticks like bullish pin bars from the support level to take a long entry you can place your stop loss below the support trend line with ample buffer or below the lowest week of the rejection candle from the
support level your target will obviously be the resistance Trend channel line you can also treat the correction move from the uptrend Line but I don't generally recommend doing so now let's briefly discuss the trading criteria for a following Channel pattern similar to a rising Channel you can take two types of trays when it comes to foreign Channel patterns you can either take breakout reads when the price breaks out of the channel or you can train the impulse price wings in the direction of the existing downtrend from the trend line when it comes to breakout trading
the following channel line is a Bilateral pattern indicating that breakout can happen in either direction but same as before the slope of the channel to some extent gives us the information on whether it will be a breakout or a breakdown so a falling Channel with a very high negative slope or a very steep price action will most probably break out above the resistance trend line well a Channel with a medium or lower slope will have equal chances of breaking out or breaking now anyway This is just an observation but you should enter the trade only
after the breakout has been confirmed let's say the price broke above the resistance trend line now if you're a very aggressive Trader you can take a long position as soon as the price breaks above the resistance trend line but this is a risky business as it could end up being a false breakout and you will be trapped so it is always ideal to wait for the breakout candle to close above The trend line and then enter on the opening of the next candle or above the high of the breakout camera the downside is that the
breakout would be too strong and you will end up buying at a much higher price so yet another method would be when the price pulls back or returns to the trend line so when the price starts to move higher after the pullback or retest of the consolidation you can take a long entry sometimes there could even be a price built up near the Resistance trend line which is a very good signal that the price could break out higher and it provides a much better reward to risk because of a tighter stop loss all these breakout
entry techniques are applicable even if the price manages to break below the support run channel line in such a scenario we will look for short trading opportunities either after the breakout and close below the support and channel line or after build up in support line or even after a pullback or Retest back to the trend channel line after the breakdown one of the most important factors to check out is the bowling you can validate a real breakout using higher than average volumes during the breakout and you can even use momentum indicators like RSI Mac B
Etc to validate the breakout moving on let's look at how to place your stop losses so we will discuss the stop loss for a breakout about the resistance level as mentioned earlier the stop loss Of the channel pattern will depend upon the width of the channel the channel is too narrow we can think about placing the stop loss just below the lower Trend channel line but if the channel is too wide then we need to think about a different stop loss because if we place the stop loss below the trend channel line like before the
reward tourists will be poor so for a breakout entry you can place the stop loss just below the midpoint of the channel from where the Breakout happened but in case you have taken a long entry after built up near the resistance trend line then you can keep your stop loss just below the build up or consolidation and finally if you have taken a position after a pullback or retest you can set your stop loss below the lowest week of pullback or latest scandals with some buffer for ample price movement now in case of a breakout
below the support run channel line similar stop loss conditions can be Applied there also but in this case we will be placing the stop loss above the midpoint of the channel from the breakdown point if you have taken a short entry or you can place the stop loss above the consolidation for a breakout after build up entry and finally you can even set your stop loss with some buffer above the highest Wick of pullback or later scandals for a pullback or retest entry now finally let's discuss the targets setting the Targets can be done the
same way as with the ryzen channel pattern could be price projection trailing stop loss or a combination of both so please do refer the previous session if you have any doubts now let's look at the second method of trading the following Channel pattern as mentioned earlier the idea is only valid if the channel formed is wide enough there should be enough points available between the support and resistance trend lines now the idea here Is to trade the impulse move or simply to trade in the direction of the existing Market Trend so all you have to
do is to look for selling opportunities from the trendline resistance level to write the impulse move because the impulse moves are associated with stronger momentum candles and you will be trading along with the market price flow you can also make use of bearish reversal candlesticks like bearish pin bars from the resistance line to take a Short entry you should place your stop loss above the resistance trend line with ample buffer or above the highest Wick of the rejection candle from the resistance line your target for this case will obviously be the support Trend channel line
so you can also trade correction move if you want from the lower rank channel line but I generally don't recommend doing it now there are a hell lot of other patterns that you can find with the markets from rounding Bottoms and tops or saucer patterns followed by Diamond tops and Diamond bottoms we taught three bottoms broadening wedges Island reversal patterns Etc the patterns that I have discussed over the course of three videos are more than sufficient to try profitably in the market if you follow them correctly now it doesn't mean that all the trades will
become profitable but the probability of your trading success can be vastly improved moreover The time frames that you select for trading these patterns also form an integral variable for the success of these patterns and mostly the win rate of chart patterns tends to improve quite a lot if you train them at higher time frames we went from discussing continuation chart patterns followed by reversal chart patterns and finally we have talked about Neutron or bilateral chart patterns now I am assuming you know how To identify and rate these chart patterns on the market but one of
the hardest things about chart patterns is sporting them on charts across different stocks and indices think about it chart patterns shop in different time frames from intraday time frames to daily or weekly or even monthly time frames and that too across different stocks and indices so as a Trader you have two jobs first you have to identify suitable patterns of your liking maybe you like Trading triangle patterns or maybe you like panels and flags and so on so identify the pattern of your liking I will suggest you follow 2 to a maximum three reliable patterns
rather than going after every pattern you find in the books trust me it will do more harm than good and if you ask me my personal favorites then I would say triangles rectangles channels and sometimes I even bet on Head and Shoulder patterns also now the next step is to filter out the Good trades from the not so reliable ones but trust me it is an exhausting job to look for chart patterns over each and every stock draw them analyze them and finally filter them for trading so in this video I will discuss three methods
that you can use to spot chat patterns in the market so watch the video till the end because the methods for finding the patterns get easier as we proceed through the video before we discuss the different methods Let me make something clear up front let me explain the reasons why spotting chart patterns is a difficult task number one most charts are uneven and noisy most dogs and index chart consist of D weeks price caps false breakouts overshoots and undershoots all resulting in making the pattern determination a hard task this is particularly true when we move
to the lower time phase what this means is that on a higher time frame like daily weekly Etc the short Pattern determination is fairly easy and forms slowly so that we get enough time to plan our trades appropriately but this is not the case in lower time frames like 5 minutes or 15 minutes or even 30 minute charts where the chart patterns get formed very often but it is always tricky to mistake one pattern from another as it happens quickly and often we won't be able to plan our trades adequately another point to keep in
mind is that the more fluid the Market price movements the easier it is to spot these patterns the point that I want to make is that Forex markets which are open all week law are one of the best markets for pattern trading unlike Indian indices like Nifty or Bank Nifty where there are big price gaps and backlashes due to aftermarket sentiments due to this very reason you can get good entries and exits due to regular price moves in Forex unlike stocks or indices which can sometimes affect your trades Due to unpredictable price gaps but most
of us like trading in stocks and indices so it is important that we identify the pattern correctly and plan our trades beforehand so let's discuss the very first method of doing this the first method uses the inbuilt trading view indicators for spotting chart patterns this feature is only available in trading view charts so make sure you have at least a free account in trading view all you have to do is to Select the chart of your liking be it a stock or an index or a currency pair and then select the time frame that you
intend to trade the patterning so if you are an intranet Trader select an intraday time frame anywhere between 3 minutes to 30 minutes or if you are a swing Trader go with a much higher time frame like 4 hours or one day time frame once you are done with these steps go to the indicator section on the top toolbar section of trading view click on it and As you can see on the left hand side there are different options like favorites Community scripts my scripts Etc and you need to select the technical section and once
you do that you will find a lot of indicators to choose from but the ones that we we are looking for are related to chart patterns on the top section of this pop-up you can see multiple options like indicators strategies volume profiles Etc so click on the one that says Auto now as soon as You scroll down you'll be able to see most of the chat patterns that we have already discussed from Flags Penance rectangles both bullish and bearish to double and triple tops and double entroper bottles two triangles and finally we have head and
shoulders and inverted Head and Shoulder patterns now you might be wondering where are the ascending descending and symmetrical triangle patterns don't worry because all the triangle pattern variants are Included under the same indicator but unfortunately this indicator section actually lacks patterns like channels broadening wedges and triangles Etc the next step is to click on the pattern that you want to check on the chart let us say I want to check triangle patterns then I will simply click on the triangle patterns and if we zoom out a little you will be able to spot all the
triangle patterns which are formed and as you can see there is no triangle formation as of Now but there was a triangle formed sometime back which gave decent enough returns even though the indicator plots the patterns automatically you are the one who is ultimately in control so in order to change the parameters just go to the settings of the indicator and click on it now a pop-up appears which gives a parameter called permissible deviation and by default it is set to 10. and if you want to know what this is just place the cursor over
the I symbol Just to the right of the parameter now this particular parameter is used to determine how accurate the pattern form should be so if you reduce the permissible deviation to let's say c 0 or even 5 then the number of triangle patterns displayed by the indicator reduces and if you increase the deviation to let's say 25 or 40 then the number of patterns displayed will be more but some of them will be inaccurate so either stay with the default value or Just play with the numbers and see what works best for you now
just below the deviation parameter you will find a tick box saying in progress once again move the cursor over the I symple what it is asking you is that do you want the indicator to spot incomplete patterns or those patterns which are the process of formation now it is most important to always turn this checkbox on only then you will be able to track the upcoming patterns and plan and trade them with Ease and another thing is that when you move from a higher time frame to a lower time frame the number of patterns spotted
increases but the accuracy of the patterns working out in your favor actually reduces now let us look at one more example this time we will consider a double top pattern and as you can see once we have clicked on the pattern it automatically displays all the potential double top formations and another interesting thing to note is that this Indicator will also give you the projected profit Target beforehand we know that the projected Target is equal to the height of the double top pattern from the neckline to the top now this is exactly the target being
displayed now let's select the setting icon of this indicator and as you can see there are more options available like the trend height second top and finally the permissible deviation now the trend height parameter is asking you for the Minimum height of the prior uptrend since we know that double top is a trend reversal pattern particularly a bearish trend reversal pattern so on a strong uptrend or double top could be a minor retracement while during a week up Trend it could be the start of a potential reversal so play with the values to find the
best combination now the next parameter is the second top which means where do you want the second top to be formed do you want it exactly at the Same height or higher or lower depending on this parameter different double tops will be displayed on the chart now the final parameter is the permissible deviation which refers to the extent to which the second top should vary from the first stop now more this deviation the more results will be displayed by the indicator but with a lower accuracy so try to maintain a Time deviation and always make
sure to tick the in progress box to display ongoing pattern Formations so it is clear that different patterns have different settings or parameters so it is your job now to select the indicator based on the pattern of your liking and fine-tune the parameters to achieve the best results now this method works well it helps to identify patterns faster on different time frames and on different charts but it is still a manual job and let's say you need to check all the Nifty hundred stocks for potential chart patterns how Long do you think this process will
take maybe hours right so this is exactly the drawback with these trading view indicators as it has limited applications shows lesser results on the chart because sometimes the indicator can be seen missing out on some of the patterns so it is less reliable so how to counter this problem of finding all the patterns on different charts on different time frames now one of the great Contender for this spot is our Method number two which is top stop research pattern scanner this is an automatic screener that looks both chart patterns once you're in the website go
to the option that says press screened and a drop down menu appears from the drop down select chart patterns this will take you to the Chart pattern screens and when you scroll down you get a lot of patterns from double and triple tops double and triple bottoms Head and Shoulders inverse Head and Shoulders Triangle patterns but unlike trading view chart patterns indicators here you get the variants of triangle patterns sorted under different sections followed by rectangles and channels but here also a few patterns are missing like Flags Penance wedges broadening patterns Etc but I think
this is more than enough because I majorly focus on triangles channels rectangles and sometimes Head and Shoulder patterns so if you are someone who is interested in the Patterns not mentioned in this Craner then you can skip to the next section of the video but trust me this scanner will make life easier for you as you can see each pattern has subsections based upon different trading periods like short term medium 12 and long term and under each subsection there are different time frames from 5 minutes to daily through monthly now depending on your trading style
that is how long you intend to hold a position and what time frame you Trade on select an option that suits your requirement so it may be a short-term trade on a 15 minutes time frame or a medium term trade on a two hour time frame or even a long term trade on a daily or weekly time frame so once you have fixed the duration and time frame select it on the chart pattern you wish to scan for and once you click on it you will get a list of stocks that satisfies the criteria but
in the free version you will only get a Maximum of three results and if you want more results you need to purchase the Premium plan which cost around 2000 rupees for anywhere but I suggest testing use the free version for a while and see if you really need it now let's get back to the discussion once the result comes up we get to see all the necessary details regarding the pattern namely the prices at which the pattern formation took place this is particularly useful because it helps you Check for the pattern in the charts quite
easily as you already know the price points to look for but there is already a built-in chart feature in the screener you can find this to the extreme right on the table once you click on the icon it will take you to the Chart which is by default a line chart which shows the patterns necessary price point with orange stars which makes it easier to spot you can change the charts to Candlestick by simply Selecting from the drop down menu on top you even get the option to change the time frames and also the periods
under consideration you can also find some useful indicators like volumes moving averages RSI fibonac Archie Etc which you can make use of or else you can always go back to your preferred starting tool like trading view which is much more powerful and easier to operate on so this is how you can use this scanner for spotting potential chart Patterns you can check all other pattern screens in the same manner also keep in mind that this scanner will only scan for ongoing patterns and it will not show any data of previous patterns formed which is necessary
for back testing now the drawback that I found out was that top stock research is not flexible enough to sort which category of stocks to consider for example I can just run a scan on only nifty 50 or Nifty hundred stocks due to this the Scanned result can sometimes come out to be penny stocks or small gaps which is very risky and illiquid also it lacks some good patterns but it is somewhat compensated by the pattern breakout scans which give result of those pattern returns which have just broken out of the consolidation range okay now
let's get on to the final method which revolves around screeners itself but here you have more control I am talking about charting and zero the streak both These are powerful screeners which are easy to use as there is no need to learn any custom codes but you still need to input the logic that you want to run on the chart but this process is quite easy and user-friendly let me talk about charting first one advantage with charting is that it has been around for a while so most of the chart pattern screens are already available
so all you have to do is to search for the particular chart pattern that you want To scan on the chart now how should you do this I will explain in the top of the home page of charting you will find a screener menu just click on that option now a lot of scans just show up from fundamental scans to top Cloud to Candlestick pattern scans but the one we are looking for are chart pattern scans but we won't find any in this section so what you can do is that you can search for the
required scan let's say I want to scan for a descending triangle Pattern just type it and hit search a large number of scans show up now which one to select usually the ones shown the start of the results are the most loud scans so always try to stick with the first top 10 scans for now let me just click on the first result and it will take me to another page where I can see the logic written in simple and understandable manner now if you notice the first line says stock passes all of the below
filters in Cache segment now This is where you can filter out stocks based on your requirement all you have to do is to click on the word before segment which in this case is cache and you will see a drop down list of all the available segments that you can choose from so so if you want only those stocks from future segment or only from Nifty hundred or Nifty five hundred just select it and move down the cursor to the Run scan button and click on it a new scan will run and it will give
us The required shortlisted stocks under the segment that we have considered you can analyze every chart by clicking on the stop name but I am not really big fan of charting's charting tool so I would rather do my analysis on trading view or my trading terminal now if you have noticed the charting free version data is delayed by some 15 minutes so intraday chart pattern trading opportunities using the free version of charting won't really work out because The signals come late but if you are someone who is inducing trading or someone who uses end of
the day data then this is not a big deal if the data is delayed also other features like alerts are only available on the premium version where you can set a lot of anodes for the setup you are looking for but I don't feel like you should pay money for premium version because first of all the charting is poor and you have to run the scans manually for new stocks And you can't do an automated trading and so on now that brings us to our next screener from strategy duster come I'll go trading site by
streak which is a part of the saroda ecosystem you need to have an account with any of the following Brokers I already have an account with zaroda so I will login with zaroda and once you log in you will be welcomed with a neat homepage where you can see a discover section with the well performing strategies but for now we are Only interested in Scanners so on the top click on the option that says scanners and a drop down appears just click on the Discover option and it will take us to a new page and
as you scroll down you will be able to see a lot of custom scans now we will have to look for chart pattern scans for that click on the search scanner box on the left side then you can search for the pattern that you like but the problem with streak is that there aren't much chart Pattern scans available a few of those already available scans in groups triangle patterns double dots double bottoms triple bottoms rectangle patterns and that is very much it so the only way to get other patterns is to make them by your
own you can do this by going to create new on the right side panel or you can even find this on the top scanners drop down which goes by the name create scanners just click on any of them and you will be taken to a new Scanner creation page it gives you the option to select the segment of stocks that you want to run the scan on now the interesting thing is that you can even scan options contracts of different expiries now the next option is to select the time frame that you want to run
the scan for you get time frames from one minute to one day the next option is to juice the chart type you can select between candlesticks and hikanashi then there is a condition Section where we will enter the required conditions for the pattern so what I recommend is that you go to charting search for the pattern you wish to trade then select the most load scan of that particular pattern copy or screenshot the code logic and then come back to string and fill the conditions into the condition section and once you are done give it
a name and run the scan right now I don't have a Premium plan for streak so I can't run a scan but if you Have a regular or ultimate plan you can run a large number of scans every day and you can even do a lot more than that you can backtest most of your trading strategies analyze them and even trade these strategies virtually using paper trading or you can do real time trading using your broker I think it is a value for money so you can check it out but this is not a recommendation
or promotion I'm talking based on my experience because I have used this for Back testing my strategies and paper trading automatically before I trade with real money so I think that is all the three methods that I wanted to share all of them have their own pros and cons so try all of them and choose the one that works well for you and if you have enjoyed the video please don't forget to like and share also make sure to subscribe to the channel and enable the Bell icon so that you won't miss out on any
upcoming videos I will see you guys With another video till then bye