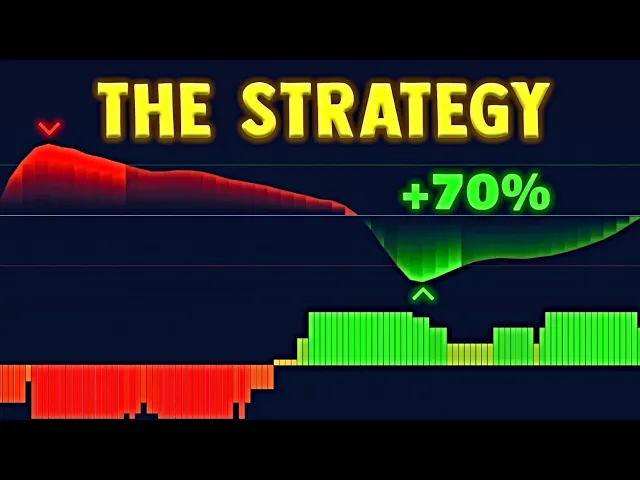
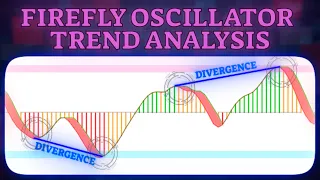
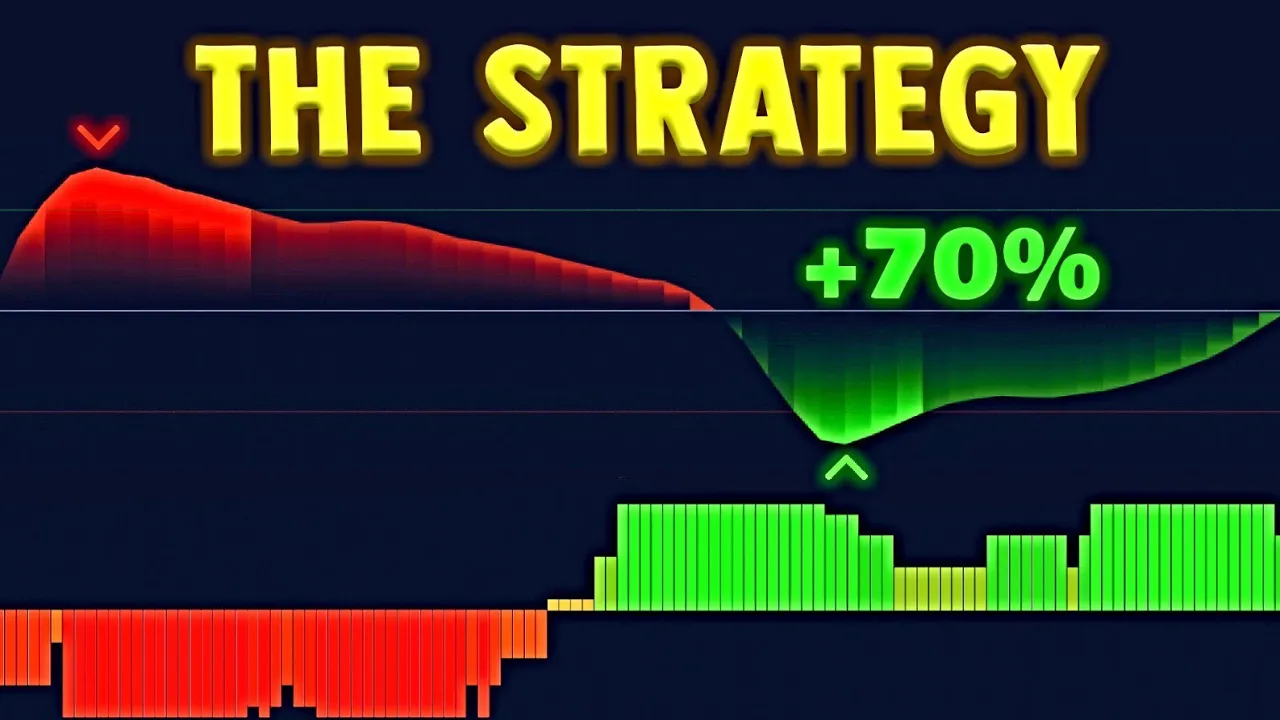
the strategy we are going to explore is based on the combination of two powerful indicators the wave Trend and the ity MTI these indicators provide us with key information about the direction of the trend and the entry and exit points in the market the strategy can be used in any type of Market it has demonstrated a reliability between 50% and 70% which means that it has been consistent in a significant percentage of successful operations the strategy has been shown to perform best in the 1 hour and 4H hour time frames although it is recommended to
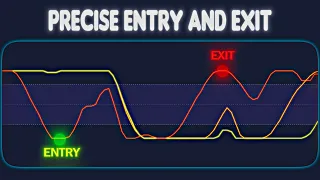
be applied in the 4-Hour time frame but first we invite you to like subscribe and activate notifications we want to provide you with interesting and useful content and your support is essential the wave Trend indicator is an oscillator designed to identify overbought and oversold conditions in the market when the filled area of the chart is blue it means that the value is is positive this generally indicates an uptrend or positive momentum in the price when the indicator is orange it means that the value is negative this indicates a downtrend or negative momentum in the price
the lines at the upper and lower ends of the indicator are the standard deviation lines in simple terms these lines represent a limit that the price normally does not exceed when the indicator crosses these lines it may be a signal that the price is about to reverse toward its average a cell signal is generated when the wav Trend oscillator crosses below the overbought level a Buy Signal is generated when the wave Trend oscillator crosses above the oversold level the itm ti indicator is an adaptation of the popular iyoku Cloud indicator that combines elements of momentum
and Trend to provide trading signals the indicator plots a total score histogram to visualize the direction of the trend a weighted total scores calculated based on different conditions such as the price position with respect to the cloud lines the conversion and baselines and the advaned lines the total score ranges from 100 to 100 where a positive score represented with green columns indicates momentum and an uptrend so it is suggested to look for buying opportunities and a negative score represented with red columns indicates momentum and a downtrend it is recommended to look for selling opportunities to
load the indicators follow these steps in the search bar of the trading view platform search for ichimoku cloud momentum and Trend indicator and select the corresponding indicator in the same way we search and add the second indicator with the name wave Trend zcore the logic behind this strategy is that by combining these two tools we can get a more complete view of the market we use the ity MTI indicator to identify the direction of the trend and then use the wave Trend indicator to place the order at just the right time to increase the probability
of getting it right rules for a Buy Signal if the Itchy MTI indicator shows an uptrend we will focus on looking for buying opportunities on the wave Trend indicator when we see a Buy Signal clearly identified by an X it is time to execute a Buy trade in the market we must assume that this is the new low that the price formed therefore place the stop loss below the candles at a prudent distance and set the take profit at a distance between two or three times greater from the entry point or at your discretion this
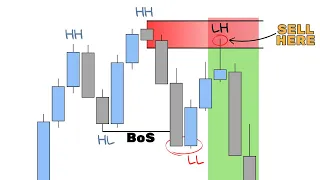
allows you to maintain a favorable risk reward ratio rules for a cell signal for a cell trade the ity MTI indicator must show a downtrend then look for a sell signal on the wave Trend indicator indicated by an X place the stop loss above the recent High Point a and set the take profit at a minimum distance twice as large in in this scenario we can see how the hmti indicator shows an uptrend on the wave Trend indicator we see a clear Buy Signal with an x on the chart indicating a buying opportunity we decide
to enter the market and place our stop loss below the low point and set our take profit at three times the distance from the entry point in this scenario we can see how the Itchy MTI indicator shows a downtrend in the wave Trend indicator we identify a cell signal we decide to enter the trade and place our stop loss above the high point and set our takeprofit at a distance of two to three times the entry point following the rules of this trading system complemented by analysis and risk management increases the chances of making a
profit on every trade although there is no guarantee of absolute success due to the volatile nature of the financial markets this disciplined approach improves the odds of positive result until the next [Music] one