My name is Fiona Steele and I'm a professor of statistics and deputy head of the department of statistics and here I'm very pleased indeed to welcome professor Sir David suger halter to the LSE today professor Spiegel halter is chair of the Winton Center for risk and evidence communication in the statistics report G at Cambridge he has made an enormous contribution both to statistics research and to the public understanding Of risk and uncertainty his research incompetence encompasses the development of novel statistical methodology and their applications in public health and he led the team that developed the
groundbreaking Winberg software which opened up bayesian methods to researchers and statistics and beyond his research has been highly cited and influential among the searches from a broad range of disciplines but going beyond that he has brought his Statistical expertise into the the public realm from providing advice on teaching mathematics and schools and performance and indicators and health to giving evidence in high-profile public inquiries to his public understanding work he is a regular contributor in the media and all matters related to the appropriate use of quantitative methods in dealing with risk and uncertainty he was awarded
a knighthood in 2014 for his services to statistics and he has just Finished his term as a president of the Royal statistical Society his new book the art of statistics published tomorrow introduces statistical thinking and data visualization and analysis through an array of real-world questions such as how can we determine the luckiest passenger on the Titanic could statistical analysis have helped catch the serial killer how how old Shipman earlier perhaps we will hear the answers tonight but in doing so he also raises Awareness of fundamental issues such as data quality selective reporting and the importance
of effective communication so if you are a Twitter use the the hashtag for today's event is Elsi stats the event is being recorded and we hope to make it available as a podcast provided there are no technical difficulties could I please just ask you to put your phones on silent just so we don't disrupt the event after the lecture there will be a chance for you To put your questions to Professor Spiegel Houser there will then be a book signing with copies of the book on sale you would have seen the display as as you
entered the lecture theater and there will also be a reception and twitch you were all invited to so but now will you please join me in welcoming professor Sir David Luther halter to dip to LSE to deliver his lecture learning from data the art of statistics thank you thank you very much for that Introduction and welcome to my book plug it's very very nice of you to turn up to be entertained and it comes out tomorrow and this is a new talk I mean I give the same talk over and over again but this is
new so I hope it's going to go OK and you like the material and but you are the test audience for some of this some of this work now it's a real real pleasure to be here is this what I do so yeah I am is taking four years to write that thing so you're gonna be Entertained by it and and you know I wanted to do it because statistics is so important in modern society I mean we you know we're in a data-driven society there's so much interest in machine learning in AI and algorithms
and so on and yet I'm an I'm a statistician and I feel that statistical insights are incredibly valuable so it's not like you know I think data science belongs to statistics or anything like that it's just that statistics is a crucial part Of modern thinking about data okay so that's the book yeah act tomorrow and I usually I've written this sort of stuff in the past you know real technical stuff about Bayesian methods and software and things like that but I'm not going to deal with that the books probably got any formula in it at
all it's a maths free but it is in fact the first course in stats disguised as a whole set of stories but by the time if you get if you do get through to the end And at the end of it I do congratulate people on reaching the end because you know it's quite a slog in I mean I hope it's readable but it's some there's a lot of content in there disguised by these these stories and okay I I just I've done entertainment stuff in the past day you know I've been lucky enough to
have this job the last 10 years which is to do with stats communication which is enabled to take the time to write this so done The BBC program yeah tails you win of which the producer tractor is sitting in the audience which I'm very grateful to and I'd done why paint jumping over the big red balls in Argentina but you're not going to see the video of this on friends and and the other thing my other attributes on the world champion of loop of all things we since a bizarre game it's a it's a game
of billiards played on an elliptical table with one pocket it's like a it's Like a putting green but if you know that there's another dot where the other focus of the ellipse is and if you know the mathematics of an ellipse you know if you fashion ball over one focus it'll bounce off the cushion and go into the hole so you can use a lot of mathematical but anyway I won it was a crummy competition anyway and it's a crummy Awards bit of polystyrene painted golf but I've still I still am apparently world champion okay
And that's the thing I do now with this gang in Cambridge the winter the scent of a risk and evidence communication these are psychologists X BBC communicators web designers we've got an actor joining us and so on and in this extraordinary group in the maths Department in Cambridge all concerned with communication of numbers and evidence and risk to public and professionals and we'll come on to some of that work later so that's why I feel Communication is unbelievably important I think it should be taught as part of stats courses in the future along with ethics
I think it's unbelievably important and the point is the numbers as I said are around us all the time and sadly for someone who loves numbers and feels they're they're delicate things that need nurturing they're often abused like I'm not biased no no no I see both sides so these though these Numbers are being used to persuade rather than inform us they use as rhetorical devices to try to change our emotions and influence our behavior and our feelings and this goes on all the time and so I think I believe it's really important that we
learn to try to take these apart these numbers apart I was in one of the challenges I do for audiences sometimes is to say make that look like a small number because it looks like big numbers very influential Number so the challenge is to show the way that numbers don't speak for themselves that they the way that communicated is vital make that look like a small number now the first trick and anything is that you learn this if you because you listen to more or less you always divide by the population of the country so
thirty three hundred fifty million well what's that about at the back time six or so it's about six pounds a week each in the Country then divide it by the number of days in a week your ATP add a packet of cheese and onion crisps that's all it cost it do we need even if that number was right which is wrong so the free but they didn't put you know we suddenly you you you eat you sends the you packet of cheese naman crisps every day they didn't say that cuz it wouldn't sound very impressive
with it so it's the way the story is told is vital okay and as I said data does not speak for Itself and I start the book with a lovely quote from Nate Silver 538 and the numbers of no way of speaking for themselves we speak for them we imbue them with meaning is it's not an automatic process to go from data to a conclusion you know you have to know about how the data were collected what the quality is what's the reliability of him oh go on about that in a later and before we
apply any statistical methods and draw any conclusions and that's why In fact in the book you know constructs so much on this business of the data you know an understanding it is it is it what we really need so we can talk about more about this later don't I'm gonna be abusive about traditional teaching of statistics who's done a statistics course in their life hands keep your hands up if you enjoyed it but many hands went down many hands went down and you know I I I'm part of it I teach that it I've taught
stats to math Undergraduates in Cambridge and I teach in a certain way in a certain order and I'm going to do a bit of a parody of that and I do apologize for the stats teachers in the audience I'm not being personally abusive I'm I'm socially being abusive about the entire stats profession you know that usually starts off with mean median mode you know simple descriptions of statistics which it frankly is pretty dull stuff no mean median mode here we Go again and then you go straight into probability theory you know that's what a standard
stats book would do you go into probability theory about drawing random observations from population distributions if you're in a mathematics more mathematics course you'll start doing let x1 to xn be iid random variables from a normal distribution then that's difficult and mathematical to grasp Then you do probability theory for distributions or summary statistics this is about somatic and incomprehensible when you go on to the sampling distribution of the sample mean essential limit theorem all that you your straight into that before you get to because if you're gonna do intervals or estimates or something like that
then you're getting a whole lot of tests which test do you do t-test chi-squared one sample to sample 1-sided 2-sided and All that stuff and this is just ends up just being a bag of tools a which test do i do with this data and that's so most people do look at statistics and then fine you might if you're really lucky to get a few statistical models but even those will be untie data nice complete rectangular stuff that's been endlessly gone over and so that unfortunately i believe is its bit of a parody is how
it starts was that so i learnt it and and that's how i've taught It but the book a modern statistical of course that i'm very influenced by people like chris wild from new zealand takes a very different approach and that's the approach we are taking this book to me ages to structure first thing is you motivate a problem solver you start with problems that's what they you know what's the question that were after and then you might look at visualization and exploring data and you focus go straight into you know how good it's a Data
kind of what can I learn from it what are the biases in the data and and so on so you usually just common sense there's nothing mathematical there at all then I actually go straight to the models and algorithms in technology technological applications so they're just trying to make prediction you don't need any probability theory for that you can just eat it this is the formula that comes from the number and it makes prediction and you can decide what you Know how good that is no probability theory needs at all then the to uncertainty still
without any probability theory using the bootstrap I'm not going to go into the bootstrap in detail the nature review of this amazingly said there wasn't enough on the bootstrap and the central limit theorem no I know no book review that's ever said there's not enough on the central limit it's better than saying there's too much on the central limit Theorem I suppose so you do that and then finally you bring probability about two-thirds of the way through probability comes into the course and then you do a bit on hypothesis testing and you do central limit
theorem and stuff like that and and bring in Bayesian methods rather late unfortunately but it is mathematical so that's the order of the book that's hugely influenced by people like Chris wild the stuff they do in New Zealand And others who have recommended this sort of switching round the order in which things are done now the other thing I borrow hugely from from New Zealand in Criswell is this idea of the problem-solving cycle now there's this is taught in UK schools there's a problem-solving cycle a data cycle in statistics I use the particular one they
teach in New Zealand pp DAC it's called and there it is and that's nice advert from the University of Auckland on for Kids on data detectives world data detectives that's what it is and basically it's you know it's very straightforward it's it says you know you first where you start with a problem the number one thing is a problem what is it and then you plan what you're going to do what are you going to measure what they didn't need to answer this problem then you actually collect the data and you sort it out and
then you do the Analysis and that you know it can be the usual sort of stuff usually we only focus on this then and this is crucial you do some interpretations and communication is the absolute vital pain then you start again because all that did was raise more problems married more raised more questions and you start the whole cycle again and this bit that we normally just focus on the tests and then the software is there there's only one part of that cycle in the book this Is the bit I don't concentrate on everything else
don't do so I think this is incredibly important and I I know think about this whenever I'm looking at any problem so for example just looking at the data the question might be what was the pattern of Harold Shipman's murders now the reason I use this one is because and I was a expert witness at the Harold inquiry into Harold Shipman so Howard Shipman was this GP he said I got nothing to take he had quite a lot To hide he had 15 bodies and which they dug up which were full of morphine that he
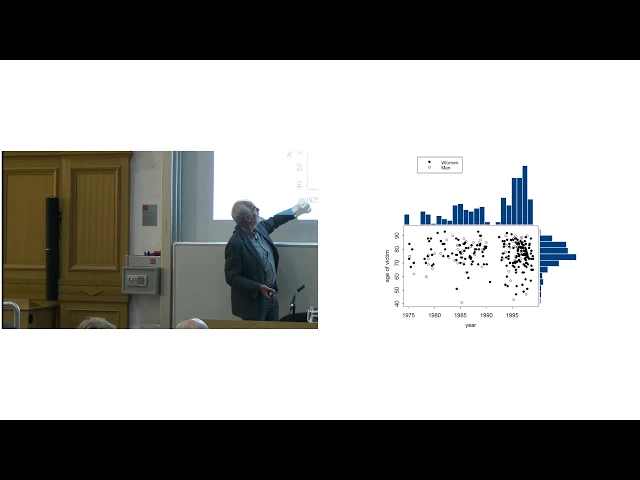
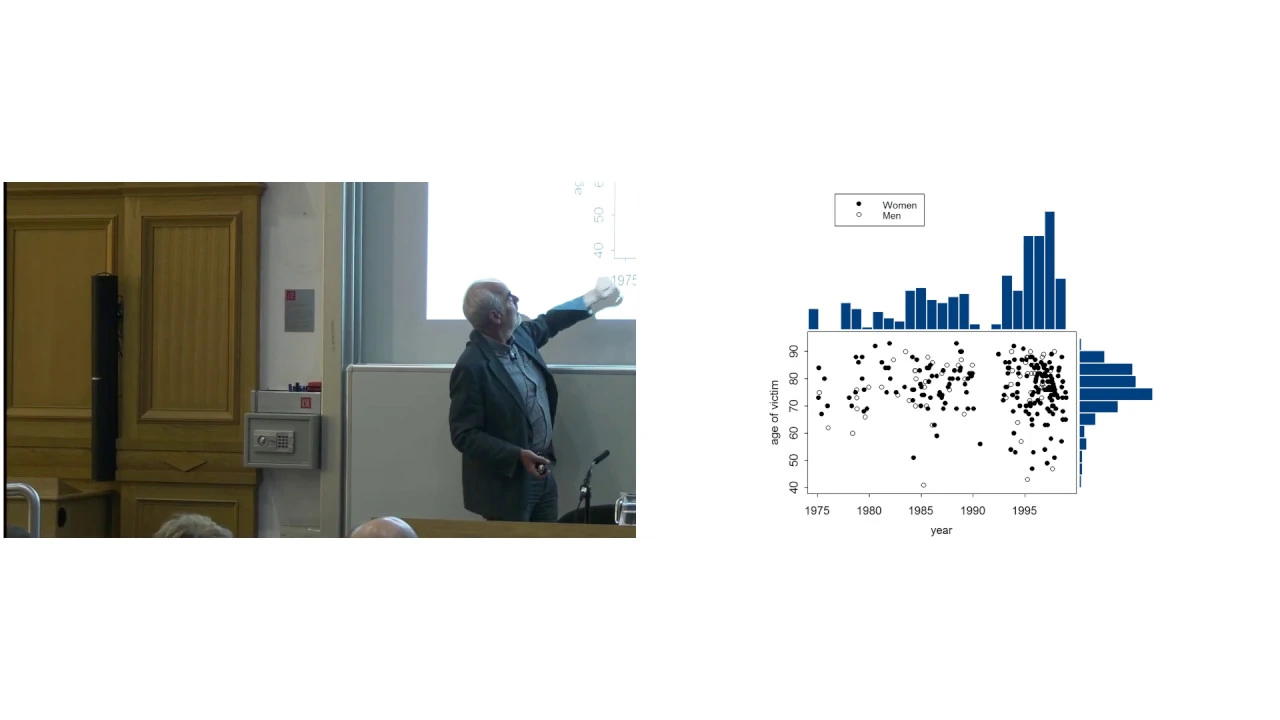
injected and housed in 1998 when he's arrested and then it was concluded that it murdered at least 215 other people with 45 probable victims and we've done now to you something there's a website just now available today which has got on it for the first time pub easily available is a database of his 215 victims with their age and when they were murdered and their gender And where they were murdered and that's not been available before the website has been but we scrape the data often it produced a spreadsheet now which enables us to plot
things like that now that's the first graphic in the book and it's quite advanced but I don't need to explain it to people you know it's it's it's just a scatter graph of the age of the victim the year in which they were murdered and whether their men or women the black dots or other women versus Other men but also superimposed a histogram on the margins of the of the of the graph to show which gives you a picture of what was the distribution of Ages and was a distribution over time very intuitive graphic but
and it generates so many questions I love doing this with the audience that sees school audience and say what was that what do you ask about that so I can ask questions like you know was it more men or women who were murdered answer women Okay did he change his pattern in terms of age as time went on about what he did it was there an interactional yeah I think so I mean you could I haven't done a formal analysis of that in fact it he started murdering younger people and he got into trouble when
he forged a will and when he got caught and then people ask oh you know where there's a gap here what happened is there's the question is what happened then and people say oh did he go on holiday no he didn't go on Holiday he he he was working with other general practitioners at this point and he thought he's being suspected and so he set up he paused and set up in single-handed general practice and then by the end of it before he at the time he is caught he was murdering somebody every two weeks
for 26 a year in the file you murdered 26 people absolute staggering so and so we go down around the circle like that and you know the next question You know what was the pattern whether they would continue there was the pattern and the problem you know how did he do what was his modus operandi and and the plan there which was which oh rich Baker was a GP did is it he went went and waded through all shipments death certificates and that he that he had signed hundreds of them took ages to twenty thirty
years of death students and then he picked a sample for other local GPs and did the same and the Analysis in this case is a simple plot this is the time of day at which for other GPS their patients died and as uniform over the 24 hours people don't die at any particular time of the day or night that was shipments pattern now you don't need a subtle statistical test to say this is different it's not what's known as an inter ocular test hits you between the eyes but shimmers patients died between 2:00 and 3:00
in the afternoon okay why why It was instantaneous he had inject people with diamorphine they would die on the spot home visits exactly he was a very good GP you try to get a GP out for a home visit now say well yeah you do home visits but the patients were on their own at home and their families were out and then hit inject them and watch them die and then changed the rent medical records so that's what he did it and he never explained why you never spoke he committed suicide in prison so We
know we don't know why so you know that's you know we'll come back to that later I said I should say the question that generally comes up at that point is why wasn't he caught earlier why this all come back to that later but why it could have been caught earlier okay so here's another question that comes out this is now to do with that was good quality data and they had the death certificates they knew about the victims they knew enough about it so that is Good quality data where you know where we can
learn from that and we have to be careful about it's good now well is this good quality data so there's a big interest in in sexual activity to understand sexually transmitted diseases and so on and especially back in there in the 80s with the rise of the AIDS epidemic this is the sort of question that people are still asking how many sexual partners and people Britain had in their lifetime and we can't know this As a fact we'd like to know we'd like this but we can't put cameras in bedrooms and things like that or
to you know we have to ask people there's no way we can identify this automatically by data dredging we have to ask people and the survey Nats how is the survey that's been going on for years and every ten years expensive very good quality survey with very huge high reputation asks people no it doesn't a very careful way with them Guaranteed anonymity and the the subject answers on a computer and the interviewer cannot see the responses they will gets closed down and anonymized okay so what do you get when you look at the data I
think this is a fascinating graf i love this guy you give a whole lecture course but on this graph and okay let me point out well you know one of the sort of features yeah this is just people between 35 and 44 and what Are they going to feature on I should say I've truncated this graph at 50 is otherwise we'd be otherwise have been heritance true for this skroob anyway the highest was 550 so that was the claim and so well okay features of this graph yeah sorry oh yes yes yes okay wrangling what's
happening here what it looks like is that round about here people are remembering you know names and and then after bit the faces get a bit blurry and then after bit they say For 2013 you know there's clearly a lot of rounding good bother this judge based at 47 so I I would think he is a statistician but I could never believe a statistician with no 47-second exactly exactly the opposite sex partners men have got more sexual life than sexual partners than women this is mathematically impossible because every partnership requires two one of each and
so the and mean not the Medium but the main number of partners for many women should be the same no there's different age grouping here because this might be with younger people and something but this is an issue that men do report having more sexual partners and women mathematically impossible so that's an issue we'll come back to that in a bit a minute and the other thing it might notice that one is the most common response I mean it is the most common but but there is a you Know a long tail going out so
there's lots of issues there and people there's just paper just come out from this group on trying to explain why men are reporting more sexual partners women one of the there's all sorts of reasons but you know about women maybe not wanting to acknowledge some partnerships in the past about actual some social desirability bias had not wanted to admit having more sexual partners but also just how people count That if you do carefully rate for your memory and count 1 2 3 4 you'll get some you figure but if you really are just sticking your
thumb in the area who are out 40 or something like that especially where if you start saying 100 120 then that is going to bias the mean quite a lot because these extreme figures pull the average up up considerably so this data might not be completely reliable ok so how many people having sexual partners if people really had in the way In the country what can we conclude from that data on that sample of people about what's really going on and if you think about it there's a lot of stages you have to go through
to get from those responses to the truth about the whole country because that's what we want we don't care what these people did we want to know what happened in the country and so that's the actual data that you get this mean of 14 against 8 which is impossible and 8 and 5 the medians are Pretty different than modes of one these are the ranges etc etc so there's some summary statistics but can we believe those apply to the general population okay so can we generalize that and this is what statistics is about it's about
taking the data we've got which might be on everybody but might not be reliable and saying well what can we learn from it and we're going to be very cautious about that so this is I think a nice Picture that again I stole from other people when Alford but it's a standard one you say a process of reasoning is that we've got some data the actual measurements and we use them to tell us something about the people we talk to that you know in or you know the truth about those people then we go from
there to the group of people that we could have asked but we didn't you know the study population the people who we were actively going out to contact or to find And then we have to generalize to the whole population the people and this is a very subtle process and all along this process errors can creep in for example the first one is how reliable other ports can we believe what they say and we realize actually maybe we can't really believe completely what we say next one is is was this a representative sample and this
was a sixty six percent response rate were they random did the people with lots of partners Systematically not answer and I put soup soup that's to remind me to tell the soup do you even know the soup story from Gallup the analogy he made George Gallup invented opinion polls this brilliant idea because he had to counter the people how can you know the opinion that a small sample could not tell you about the population people weren't used to this idea and so he said he used this soup analogy that if you want to know whether
your soup needs more salt you Don't have to drink you don't have to eat all the soup you stir it up and taste a little bit and as long as it's stirred properly you only have to taste it a little bit to know what the content that what the consistency of the rest of it is like he said exactly the same as samples so what I always think use this soup analogous you know is your is your army properly stirred you know is your group properly stirred and there's a problem there because maybe this is
the Biased sample as he looks in this service if it isn't particular biased and then of course the people in the survey aren't necessarily the who you could survey and that's there any of people you want to see there's no you're not asking institutions not you know lots of people that you're not actually engaging with so there's all these stages you go through where problems can arise and and you know we're not trying to labor the point I do In the book talk about crime statistics other areas where in and why we might not believe
those and so on and this is a useful structure to see where the problems can come in okay I then of course and this is still again before any maths no technicalities no probability you can start talking about causation you know correlation is not causation it's a standard cliche but I still can't resist I still love these stories and This is one I've used quite a lot and it's a particularly dull one day there's gonna be one of the authors in the audience it's a dull Scandinavian study Scandinavia is amazing because they can link tax
records with health records which is there they can they can find that this webs of consistent association sweetheart so Siobhan positioned on high-risk experiment rich and then got more brain tumors and they found it's Not another big big big effect but risk remain got movement and they said it couldn't be an artifact nor why could that be completely spurious why might rich men and not actually get more burnt rooms but just a period more brain tumors no no yeah the foot natural one is certain because they're living longer and if they did a naive comparison
yes sir actually would be the case because rich people live longer a bigger chance to get brain tumor so you would expect More rich people now but they adjusted for age so this is to do with the age specific incidence of brain so they realize that now of course the first thing to do you must allow for age what's the other reason why richer people yeah yeah yeah rich people have used health care more we know that get better care more likely to be diagnosed if you've got a disease so that and the authors said
that this could be an artifact okay this didn't stop the press Officers who thought actually come let's get some press coverage for this let's say that high levels of education linked to heightened brain jus the study wasn't about education who's in the table somewhere so let's say that and then by the time he gets to the Daily Mirror we go why going to university increases the risk of a brain tumor so let this be a warning to all of you well this studying makes the brain heat up from the federal so you get this Complete
drivel of an association which may not be there in the party anyway it might be an artifact anyway being reported as a court as a causal relationship and so absolute nonsense and we see that all the time you only have to mention you know vaccines and autism and everything all that's okay so actually scientists though sometimes could have an agenda you know sometimes the problem with the stats we hear are due to the scientists and this is a Story just from when was it last month February the insects disappearing story front pages and newspapers and
apocalypse warning life will disappear because the insects into spring but slightly more rational the Guardian world's insects are hurtling down the path to extinction more than 40% of insect species declining total mass of instance falling barrel substance 2.5 percent a year and you this was a study in academic study from you know Respectable journal et cetera et cetera but you may have already heard this being taken apart or more or less but I actually we got to it before Morris did but but we put okay so what could they have done wrong now I would
I see they've actually to discover what they did wrong it's actually quite easy oh you have to look at the methods part of the paper okay let's look at the method this was a meta-analysis which they review the scientific literature to Estimate the decline so they searched this is a quote from paper using the keywords insect and survey and decline so they searched for the papers that reported at the time and then said well this is what the decline is they didn't look at the papers that reported the stability or increase or anything there's more
papers that reporting an increase than what the client but no look like so it's just total selection bias in you're getting you're getting The evidence to prove the hypothesis is that absolutely outrageous bad sign for which they appeared to be completely lack of a apology so it's only by looking you cannot take these numbers for face value today knowing where the data came from how is it collected what biases might have come in again no math just pure sort of common sense almost all that stuff yeah decline so um in the book I go from
that business of correlation causation and interpretation Of data and things and then again because I was trying to delay the the probability theory and the usual stuff go straight into predictive analytics in an essentially machine learning in taking a set of data and then making a prediction from it a technological tool to make a prediction and my example of that was what you know who is the luckiest person let titanic's there's the Titanic and we'll come back to that picture into me and okay so and why I Picked that one it's quite interesting I I
come from North Devon like a little flat in Norfolk where I'm gonna spend my edge and that's what become very nice actually doesn't very often look like that but nevermind it's a lovely place we do recommend it for your holidays and and in the graveyard at all from church there's this gravestone but it's actually half of most Gration is a memorial to francis william Somerton whose perished in the Titanic disaster Of 1912 it's a very sad story left his wife Hannah is young child to go off to America to seek his fortune spent almost all
his money on buying a ticket and for eight pounds one shilling set off on the Titanic in third class and didn't survive so that my entire my interest was really piqued by this is quite extraordinary I didn't know this was in Africa and but then I realized actually predicting who's going to survive the Titanic people might know that they know this it's there in anything to do with the machine learning community is a total obsession of the machine learning community there's a database of mail them all which is riveting of 1300 passengers name what class
they're in whether they survived gender age when it's known number of siblings have got and the tickets the numbers how much they paid sometimes they can happen and you know all this information and of These the Miss Stanley actually survived and cannot construct an algorithm to predict who survives out of it from the Titanic as I said it's becoming a complete obsession you go to Kaggle which is a website which does machine learning competitions they for fifty nine thousand entries they try to predict who survives the Titanic and they're all based on this idea of
splitting the database you get a training site you get Given 70% of the database you have to direct your algorithm and then you test it on the 30 on the test set you're not allowed to look at that while you're developing you have to say this is my algorithm now I'm going to test it and the winner that with the competition if I wants to join in the competition still armed but actually I think it's been spooked so then people are cheating there's some people claiming massive accuracy which is completely impossible So I think people
are cheating I don't want religion you can find you can download their whole database you can find the test sets so anyway you can shoot so I cheated I downloaded the whole deadly and and if you think you can then do standard statistical stuff of plotting you know the percentage surviving and you see the younger these kids surviving here first-class surviving female surviving people who paid a lot bill paying eighty quid for Ticket amazing and middle sized families surviving eccentric so so you got all these factors and then you throw them into a machine learning
algorithm and I used are others went through everything I could find shoving him into everything you know regression and neural networks K nearest neighbor support vector machines everything I just shoved it all in and this is actually what one for me was this incredible simply pacification tree really simple thing which you can Explain so what's known as a transparent algorithm because you can see what it is first of all are you call mister you're gonna die yeah that's pretty pretty simple it's no I see 16% of missed has actually survived and if you had to
give a cat a categorical prediction you think they're going to die I'm going to actually focus on probability so I just say well high risk of 16% and survival there the other thing is third class and you know are You third class and well II the next question that it the algorithm that they picked out was are you from a large family from large family of third-class that you really don't stand a chance but the smaller families because they actually quite a few survival rate among third-class passengers who would not missed us so women and
children from smaller families and actually did quite well even in third class but the best Thing if you weren't third class then you're getting a very good chance and weren't mister very good chance of survival unless it there is this county called rare title it all sorts of bonkers things Jenks and you know this would be and those did badly but largely because they should be mainly men who weren't picked out as the mister so that was another thing so they're out of all the algorithms and there's loads that do almost the same but it's
a very simple One to explain and but basically I'm interested in in prediction but I'm actually doing an archive on foreign prediction in with a moment which I really criticized this idea of saying what the prediction is not saying what's going to happen is giving odds for what's gonna happen so I argue very strongly in its program and so what I'm interested in is the probabilities provided by those algorithms and then you score those where what's known as The briar score which is known as the mean squared error you know basically if you give a
probability of seventy of 0.7 to someone surviving and they do survive you're not right your point three out and what you should be penalized is the square of that point three point three squared you must be P naught point three you get penalized by point three if you said seventy percent chances of surviving and they died you're penalized by point seven squared you were a point Seven eight point seven squared use the square of them of the mistake that you made and that's the correct way to do it it's been done in weather for weather
forecasters are assessed Breyer schools incredibly important and when you look at the briar score among all these different algorithms I tried out that little classification tree works you know it works pretty well the others are fairly close and I won't go into it now but in the book I talk About the fact that you can actually check whether these are you know given the random variation actually you conclude these are better than these are actually truly worse than this and but some so so that's what you can do and I still there's no real statistical
theory there you're just building a formula and checking how well it predicts okay okay so back to the question rescuer and the cycle who was the luckiest person on the Titanic well What I did was just look at the survivors and look who got across all the algorithms the lowest predicted chance of surviving though is the ones of the algorithms thought they were going to die and then they survived miraculous there is Carl doll 45 year old Norwegian Australian joiner it's big man strong man and he was one our room said it was impossible that
he would survive because he had everything is a man on his own traveling at third-class He bought the cheapest ticket everything went against him and he survived I turned out when you look on the database like Titanic database he turned he dived into the freezing water so he should have died I mean known survive dived into water but he got onto a lifeboat even though they tried to push him out I think I think that's him trying to get on sound strong I think he forced his way onto the lifeboat so maybe I should say
he's lucky no Thuggish survivor so he carried on as pictures of him that's the piggy actually picture with his wine but they become married and lived a long time as opposed to William Somerton who died leaving his wife with only five quid in his will om on his will and I made a little bit that's all she was left to it so we can if we can't find these curious little historical facts out of them out of this analytics okay so that's methods though Aren't always used well and you know although I try to make
the book about what people do correctly it's not a book about how bad it starts there there's one chapter on how to do stunts badly and this is new material that haven't talked about before because it's related to of anyone who's heard about this debate going on about whether you should abandon statistical significance not many a few anyway the rest of you about to hear about it so the point about it This whole idea of p-values and statistical significance for that is a contested area an increasingly contested and I deal with it in quite some
detail because it's a big current area of debate about how do we and decide for example whether a treatment is effective or not so here's an example this is from last last month the paper very very septic shock is a terrible condition with a very high mortality rate so this is the big Randomized trial and in South America of a new you know a new strategy from preventing it and this is the two treatments that they gave this is the standard one this is the new one with peripheral perfusion this is the cumulative mortality rate
over the first 28 days and what this shows is that this new technique had eight to nine percent fewer deaths you know about you know one-fifth reduction in mortality at least and they started it is a Randomized study two hundred and twelve people in each arm they followed them up for a month can't the body's 120 versus 138 had died okay so that looks pretty you know you think what looks good I'm just good new treatment so but you do the calculations on it and you work out that there has a very sure to do
a Cox analysis won't go into the details 25 percent reduction in mortality rate is that is the estimate the confidence interval goes from point five five to 1.02 so the confidence interval that you'd put on the benefit slide just includes the point at which there's no difference and they calculate this p-value of point O six so how does that PV okay what's the p-value the mysteries of the p-value oh my god have you all then this sudden tweak the p-values the measure the conflict between the data and some no hypothesis usually that there's no effect
then that treatment doesn't work and I shouldn't apologize For doing it this is you know the absolute bread and butter of Statistics P most every scientific paper would appear values in it in every area is just used all the time zillions of times a day people calculate these things it's the probability of getting such an extreme result were the null hypothesis actually true what a complex thing the main thing and why dwell with it dwell in on the book on on this quite a lot it's not the probability that the null Hypothesis is true so
that's not you know that P equals 0.06 it's not the probability that that the drug has you know has enough has probably yeah it's not the probability that that is not a six percent chance that there's no effect you know that's not what it means there's a traditional threshold of five percent Pete was point oh five to declare what's called statistical significance and this Is you know taught I've taught that everyone teaches it but the other thing is that just because something is not significant it doesn't mean no effect and this is part of the
stats education gauri hamath us through this all the time doesn't mean no effect and if there's many tests you might or crucial decision you might want to use a more stringent threshold so that's what we teach and nobody understands it but never mind we keep on teaching you so What about this study you know and so that this idea that actually for more really important areas or where we're looking at not a test we might be more stringent Illustrated on the Higgs boson and the p-value they demanded there was one in three million one in
three and a half million and they actually got BBC whether one of the few people who actually reported it correctly they said it's a one a three and a half million chance that the signal is seen would Appear if there were no Higgs particle it's not the chance there's no Higgs particle but nevermind that's what most people say okay so they got it right leaves you got it right so that's a really they the big you know theoretical physicists don't want to make fools themselves by claiming as a particle then suddenly it disappears they've done
it before so they they're really conscious of having a stringent effect okay So what did the hydrometer thing find they found this two-sided p-value 0.06 the probability of observing such a big improvement were there no effect it's actually 0.03 so that and for technical reasons that's looking at whether this improvement gets worse all gets better at that point oh six includes so you could say there's 97 percent confidence of improvement however what's the author's conclusion this is from a paper they said this treatment did not reduce All cause mortality shocking misuse of science you know
it doesn't they not what the data said you saw the job and they saying it didn't reduce it because that p is was point oh six from 2005 they said it didn't reduce it complete nonce I was think I could have gotten 0.05 giving me the data out of my extrude point oh five rid of that yeah and because people do that if you look in Historical studies there's lots of p-values get over that border yeah so this is outrageous misuse of statistical significance and which could lead to deaths of people and this led and
these were the headlines fails to cut mortality does not lower mortality you know there's this fraction to go over this arbitrary threshold this is nonsense absolute nonsense bad science and so this has led this last week to a paper in Nature saying all this Statistical significant stuff dividing things into significant or not maybe we should just stop doing it and this is quite revolutionary and someone wrote a paper 800 signatories including myself and the President and the present president of the Royal Society but it's not against p-values it's just about splitting them into significant or
not significant so this is you know those of you who don't don't know and don't care and we'll think would this is not Exactly going to push brexit off the front page but to us in the trade this is quite crucial and because everyone has been taught this stuff every student I talked about this last week you know you know and the school kid came up to me said we're learning this and so you know it's it is a current issue and I sort of lay into all that stuff there okay so in you know
when might it be reasonable splitting is significant not significant When a decision has to be made you know in drag regulations for example they demand two independent clinical trials both at P less than 0.05 and as usually they're in gatekeeper function they've got to have a rule that everyone knows the drug companies know and that's what they do two trials 0.05 and when you're monitoring performance you might want to know when to intervene you got to make a decision when to intervene so the air is Either what I'd like to do is to apply this
idea when could Harold Shipman have been caught earlier and that's what we got asked so okay let's look at this what had a chat proces problem what data have we got we got the data on when his patients died we've also got data which had to be collected on when the patient's of all the other GPS in the area died how many of those died each year and and in relationship to the size of their Practice what was the age sex breakdown and print did they have lots of old people you'd expect more deaths and
so on so it's quite a complicated gotta collect all that data and do quite a complex calculation a fairly common sense to work out how many deaths he would have been expected to have were he an average GP and this wouldn't be a whole number he might say whoa each year we'd expect me to about 2.7 deaths because he's got a whole lot of old People and on average that's the mortality rate among these old people in this area from other GPS and so we can estimate how many holes how many patients how simin would
expect to get and that's a very common thing in stats to work out what we expect to have were he an ordinary GP so this is the null hypothesis that he's an ordinary GP and then we can subtract this expected number from the actual observed to get any extra deaths did he have each year And we can add them up over time and we get this so from 1977 just for women by about 1983 about six years later get about 20 extra more deaths and you'd expect they started going up about 14 16 but time
he got caught he had 160 more deaths among women than you'd have expected by chance alone among men is less but still pretty high but you know suspect this is about 200 extra amazing you add these up and you get about 210 which is almost Exactly the same number as the inquiry concluded that it killed based on all the individual stories and all the individual data and digging people up and things like that this doesn't know anything about that doesn't know he's a criminal it doesn't know anything it's purely a statistical calculation and yet it
gets almost exactly right how many people he did actually kill extraordinary bit of stats again forensics data sources so yeah as I said it's all exactly what the shipment inquiry concluded we get it there so when should they have blown the whistle if someone was like nobody was looking at this by the way nobody was looking at this Dayton nobody was we concluded nobody was to blame nobody was collecting this looking when could it when would the whistle have been blown it turns out this is quite a subtle issue for a number of Reasons if
you keep on testing and testing and testing this you know there's a nice mathematical results that shows that even if you were completely innocent in the end you're going to find a significant quotes and excess mortality if you keep on testing enough you'll always find something I mean so they've got to be really careful about keeping on testing the other thing is this 23 26,000 GPS in the country so the chance of one of them crossing some you Know being the whistle being blown on one of them is very high and that's your very stringent
because there's so many GPS and we don'twe if we were setting up a monitoring system we have to allow for the fact that we're looking at all of these people so it's a very subtle issue so there's to think what we will go what we can use is some my statistical theory was actually developed in the Second World War in parallel both by and George Beck I called George Barnard in the UK And by Abraham Walt in the US on on a simple statistical method that can be used to develop this sort of monitoring call
this sequential probability ratio test but we we have to think if we're gonna do any statistical thing there's two sorts of mistakes we can make the first one is we could falsely accuse an innocent person and that's known as a type 1 error the other thing we could do is miss someone with a true increased risk we could we can let him get away With it or we could falsely accuse them these are both terrible things there which is worse which one we typically and this one is the one we want to control more we
consider that a false accusation and might be worse finding someone guilty who isn't guilty so typically when you're designing then a monitoring procedure you want to keep the probability of a type 1 error low in that's known as alpha and you want to collect lots of data to make the type 2 Errors rare as well so you want to take lots of data but you under very stringent criteria won't it be quite rigorous before you point the finger and it turns out then that you design these statistics quite nice statistics where there your thresholds are
just straight lines they're just straight lines and you can plot these in advance and then you plot your data and when the data goes over the threshold you blow the whistle trip and then You're pretty confident that there's something there because you've set these this top threshold our frequency equals one in a hundred thousand that means one in a hundred thousand chance of making either sort of mistake either a false accusation or missing someone so you're gonna wait quite a long time because you're being very stringent and allowing for the fact there's twenty thousand GPS
in the country and he had got him in 1985 after he killed about forty people And so 215 saved about 170 lives had there been any system in place they're designed fairly properly but nobody did it nobody looked afterwards people's see looked at what this sort of system would have done and and it would have would have done is is found five doctors with higher mortality rates than shipment in Eastbourne and I don't even know he spawned you know high mortality rate and he's poor and very caring GP was reserve was helping his patients die
at home and Signing their death certificates so he's a fantastic doctor looking you're really committed to the deaths of older people this would have spotted him as being deeply dangerous as having a high excess mortality more than you'd expect so you gotta be really careful in putting these things into practice but that's you know an example of where some really you know surf it's this statistical theory was developed in production lines for munitions being applied in a very Different area okay so I'm just coming yeah Oh am I getting on I can traverse the time
oh you've got to you back I'll come back come to the end quite soon probably in bays I'm very interested in the applications of probably in statistics in the law and there's a whole area corner called forensic statistics which is developing hugely it's amazing and I'm not doing a primer with a Supreme Court judge that will go out to every judge in the country on Forensic statistics okay technical stuff very quickly Bayes theorem I'm not gonna prove it I'm just gonna state it Bayes theorem says that and the initial oh yeah that's it the initial
odds for a hypothesis times the likely an array shows the final odds for a hypothesis base theorems are rule in probability says how you should change your beliefs in their light of new evidence it's a theory of learning it's a is the variable it's the correct Mathematically correct theory of learning and what you have to do if you don't know where the hypothesis is true or not like whether someone's guilty or not you state some initial odds based on the your current evidence and then you've got some new evidence coming in and this is called
a light that gives you the likely ratio and that gives you the fine Lots very simple okay so let's see in a case in you know a fictitious case you've got a thousand possible Perpetrators of a crime plus one suspect who's been by a rather unreliable witness has been has been fingered so you've got a thousand and one people the initially and you say well initially you know no reason the thing is different from anybody else in particular although we've got this slightly suspicious we're given the benefit of a doubt one of the thousand chance
he's guilty he's just a random person not one in fact one of the thousand and one that's all of one odds And one to a thousand the likelihood ratio is the probability of the evidence that you measure then you take some DNA test on the lughead ratio is the probability of getting the DNA match and get a match given and he's guilty divided by the probably getting a match given it was just somebody else and this is known as the random match probability 1/8 though the one on the bottom is the random match probability you
assume this is one the problem you're getting a Match given he's guilty yeah that's one this is the row this is the round of match probability and typically you'll get values in the millions from DNA this even suggested know that if you get a value of a billion that's the only evidence you need you don't need any supporting evidence that is enough to convict but let's say it's a million which is still quite high so what's the probability or the odds that the guy did it You just multiply these together I don't want the AI
is doing there should be one and so I shouldn't be so that's the that's wrong as a wrong formula spot the error students oh that is not the right formula if we replace that by an equals and that by a times ya spot the deliberate mistake what I meant to say is that this is the initial odds times the likely ratio gives you a thousand to one that he did it thousand to one that he did it so simple maths Now that is how evidence is brought into court now except you're not allowed to do
the multiplication in court you can use likelihood ratios he's been bait the basis base theme has been banned from British courts after Peter Donnelly tried to do it and you're not allowed to use the prior odds or the final odds you're not to talk about the probability of guilt in court so we can have use likelihood ratios and let's look at how these things are used in Forensic science Richard the third okay who thinks that the skeleton they dug up wasn't really Richard the third I suggested this one's to some of the researchers they got
so angry and quite with reason as I point out okay so the story is that on 25th of August 2012 they brought along a digger in a car park in Leicester started digging a hole and within a couple of hours they found a skeleton just dug the first scale if they dug this small hole there was a Skeleton there he was and they said that's Richard the third sounds pretty implausible to me first dug a hole there he is good this barium in Leicester Cathedral now he waned a bit further than that because you know
they amazing a picture and I think he didn't see the curvature of the spine so they did all these tests on him and this was later claimed to Richard can we believe this and there's a lovely paper on this in Nature communications and It's all based their argument there's Richard the third and why he's buried in Leicester Cathedral it's all based on this idea likely ratio it's all based to taking individual items of evidence and working on the probability of evidence if the skeleton were it's the third you think of it's been guilty divided by
the probability evidence if it was somebody else now that means this is usually you know buttoning one if we assume that he Really was you know had a curvature of the spine and we assume the stories about him were true this requires the research and how many people in 1485 had scoliosis and they they quote a wallet so you do all this worse than research you know how many people so and then they quoted then the interesting thing is that within courts now there is a standard language for reporting forensic science findings likely ratios so
if you get a likely Ratio of a thousand to ten thousand you can say it's strong support for a hypothesis such as the guilt of the suspect or you can't say give a problem dinner's guilty because it strongly supports so this is a recognized scale that's used okay what did they find thanks amazing so radiocarbon dating only David liked a gray shirt so the family what the skeleton was from then but it's very vague and everybody in that graveyard was it was from that Period so that's not very distinctive the evidence still very weak evidence
indeed from radiocarbon dating because they knew and fast anyone they found would be from that pure age and sex of the skeleton pretty weak support you know is a male about the right age but then the really powerful stuff was this curvature of the spine but even that Wendy case was moderately strong like a ratio of two hundred two hundred times more likely that this Curvature the spine would be there if it's rich to the third than if it wasn't and a lot of effort to go into that first of all do we do the
body had been mutilated after it was dead which do you think would be pretty radical quite how they estimated the chance that happening if it wasn't rich as if the nevermind so gone but they cause it's the DNA that really gave that really did it this is through the female line he didn't have any children but and they could look at Relations the known descendants they took the DNA of known descendants of relations and found out they worked out that they thought I mean it's not as strong as taking DNA from a suspect he said
the likely ratios only foreign some yet they working but not bad at all the the evidence against it was the DNA the y-chromosome didn't match but did a lot with expected but that actually is not surprising because all you need is breaks in the family line The paternity you know and then every you know historical series there's it going to be inevitably mistaken paternity somewhere coming in but you month they multiplied these up together to give us a support of six and a half million and they reclaimed at least ninety-nine point nine nine nine four
percent chance that this was rich the third which got him buried in the cathedral mathematical calculation to do that what's interesting is this was a Court case they wouldn't have been allowed to multiply these up the judges rule that is the job of the jury to combine these different items of evidence together you can't not like to multiply these things up in court so this is a really you know kind of contested area but of a big area for the application of statistical probability methods okay so just to finish off some of you may have
seen these jokes before but it has been slightly revived with Some current experience doesn't finish off then to describe the way when the statistics can go wrong I love statistics but you know and I try to communicate them but actually sometimes I make a mistake something happens so this was a by previous book available from all good dirty booksellers new it's very it's not dirty it's extreme the letter you can think anything less titillating in your life and then a book on statistics or sexual Behavior it took a long time to she's right and choose
to cover that was going to be the cover that was a house a proposal by the designer and literally mystery WH Smith said knocking of that book an arsenal so so that's the cover they dare not show I think I thought I thought it was great no cover okay so um the story that are you as you'll see keeps cropping up and I keep on coming back to me is this story about how often do people have set And the why is this a story is that the rates are declining and this isn't just from
these surveys but in a US and other surveys there is decline in the frequency of sex among the younger population and that this is absolute sex and couples so this is young at work for me see very younger people 16 to 44 year olds the first survey in 1990 their median this is the interquartile range to us the bottom quarter top quarter median five times a month about artists To thousands four times a month 2010 three times a month well I think we can all do the extrapolation there and we wonder what's going to happen
to the to the future nation so so that's and everyone asked why is that's the case and they're the statisticians not my job to say why but even the researchers who uncovered this information did say that they thought they got quoted like they're all this sort of story all the time I think it was to do with it in a Massive connectivity we have all the time compared with when you know old people you know like me we're young when those two you know I'd make two channels on TV and it stops almost ten no
internet no nothing there's nothing to do but now honestly you know there's all their emails there's Netflix this box set so I say when I was talking about this at hey I said oh I think I blame the box set so I can't come to bed on binge watching Game Of Thrones or sorry this one yeah I got about the same laugh as Lister but nevermind well now when I said all this is a talking the journalist was in the audience writing it all down and and the next day this was the headline in the
Daily Telegraph with having a second game that pain reads professor in fact there's some jokes there there were some jokes they didn't get very big laughs like this Time but actually there were jokes but then there she was oh I'm sorry this has got shifted sorry you know the trend in declining sex rates professor speaker said it was very worrying and if if this carried on they wouldn't be having any sex at all by 2030 and that as he was a joke I didn't mean that seriously but I know I was cross I thought I
would this is tomorrow's chip rapper who cares about you stupid stories what I didn't realize Had the modern media works that once somebody's written the stories saying sex Cambridge professor Game of Thrones everyone could just copy they don't have to check well no no no so there was Newsweek with Game of Thrones ruining our sex like boys with a half-naked woman of course I on it as well couples will stop having sex by 2000 and this is my favorite this remote sex will be obviously one lone scientist yeah that's 40 years building up a reputation
I Think goes on in German and the hot another half-naked woman it goes Italian you know what Professor speedy holder says and this was a few years ago and it hasn't stopped yesterday I looked on Twitter no no this was a story from yesterday French in 2013 there's gonna be no more love from this researcher Britta you know you know Davis be older and then none in Twitter who is in Spanish you know me saying it's not gonna be any sex way to day this is my Favorite French and it's just by this you know
saying that you enjoy it while there's still time he said I don't believe I actually said that to be honest but who am I so this was just yesterday oh god I can email all the time it won't good story does won't dies when he's sort of zombie statistic but I by faith in in journalism was slightly restored by one one journalist and really this guy writing in in Forbes magazine who Said his Game of Thrones killing your sex life he's a proper stat statistical data journalist so he drew the graph the 543 and of
course made that made the usual combat you know about the idiotic extrapolation but he had the genius to realize that if you can extrapolate forwards you can extrapolate and estimate zero people were having sex 200 times a month and that's what the statistics prove which just goes to show they can prove anything Thank you very much indeed thank you so much for your lecture what a way to end so we now have some time for questions can I just ask if you would like to ask a question that you wait for one of our stewards
to get to you with the roving microphone and if you could also just tell us your name and your affiliation so who would like to start okay hello thanks for the talk it was fantastic professor and my name is Kaylee and for all of my sins I am in public relations oh yeah so the communication element of this really really interests me I guess I guess my question comes down to maths was never my strong suit and I followed along as best I could but for the people in communications the journalists you took your story
and all that story and ran with it but how do we do better how do we communicate a little more accurately to the masses when a lot of People maybe don't understand statistics too obviously yeah terribly important I do some stuff in the book about that and we worked quite a lot with trying to improve the way in which numbers are reported I mean there I mean I don't give a whole lectures on this stuff but there are some you know pretty simple tricks that you know suit the public communication of risk for example and
the first one is that when everyone anyone reports an increased risk of this Doubles your risk of something or 20% this is a terrible way to tell a story unfortunately that's what comes out to a lot of scientific studies so if someone does say that eating bacon sandwiches increases your risk of bowel cancer by by 20% you say well 20% of what you know is this really important and so the crucial thing is to and which has been shown in a lot of research and in anything is to if it can we convert it to
me what does it mean for a hundred People like you every system a metaphor that took for converting risk and probability insurance which is very nice because you can illustrate it and looking a hundred people at you and you know and it puts it into a story not of you can't say what's gonna happen but it can at least say what would expect to happen among for people like you and you know so for example you know there's what's in the Book is to say well actually according to that latest data you'd have to have
a hundred people eating a greasy bacon sandwich every single day of their lives and out of that you get one extra case of bowel cancer that's the sort of and it puts it in perspective who to me well maybe that might you know different people can respond that might say oh I'm not going to never going to touch bacon again others might say pass the brown sauce so it's you know but you're Putting it in a framework to allows people to at least visualize it and look at the magnitudes because otherwise so much the way
that numbers are communicated as I said it's trick to try to persuade rather than inform and always deliberately obscuring their meaning so I think there are tricks and I very having to talk more about it and it's also good organizations like the science Media Center you know working on improving that improving press releases They give a whole stuff about press releases which I as I show have been terrible in the past but they actually are improving and press officers are catching on the fact that journalists can take statements of uncertainty they don't have to be
gently don't write the story for me you know tell me what the actual evidence is thank you very much professor the names you and grants I'm a former law enforcement intelligence analyst covering the ex-soviet States And certainly the data cycle you showed is is like the intelligence cycle that was drilled into us and for the same reasons when it's done well the same procedures and when it's not done well the same things are missed out I I did teach in that the John F Kennedy case and certainly I would have welcomed your assistance because I've
been fighting a losing battle over the years against the conspiracy theory nut cases but my question is with Greater data collection and data extraction through digitalization how is are there risks or opportunities in the old story of the dog that did not bar in other words the absence of a positive thank you I think the dog that didn't bark is you know it's sure the kind of story a silver blaze I think it's incredibly important it is one of the things in the book you know as the most difficult advice to give of all this
when you hear about a story to ask what Am I not being told it's terribly difficult to do because there's nothing you know you can read a scientific paper looks completely plausible but if you not being told that you know this relationship between our like on one I saw um you know eating yogurt when you're pregnant in your child getting asthma there was a study on there and what we weren't being told that I had to dig it out by detective work was that they'd looked at everything that parents That you know mother danger during
pregnancy they looked at every childhood condition and found this association between those two and then reported that one now that's very difficult to dig realize this is complete nonsense unless you know the process by which the data was arrived at and with in other words what am I not being told and that's very challenging to do and requires you know a bit of imagination and determination To find that um but that's kind of thing that I think good journalists should be doing all the time is trying to identify you know the bigger context yeah I
just take one question over here and then you'll be next thank you hello hello hello can you hear me okay yep um hi thank you doctor professor speak for such an interesting talk I'm Kathy Reilly I'm an academic at the London School of Hygiene and Tropical Medicine So there we teach a lot of people statistics who don't typically have a statistics background and we're constantly faced with the challenge of this dogma of all statistics isn't my subject I was never good at maths and it's a real problem and if they are good at maths it's
just that they don't have the confidence to be statistically literate and have less of an interest to engage with things unless they come across an interesting Application and an interesting way to solve a problem do you have any solutions yeah that's why some do this joke about you know like their statistics course is that you know it's generally not a popular sub I I couldn't stand it when I learn today but I wanted to give it up I really didn't enjoy it so I just didn't see the point it's being taught this mathematical stuff you
know it just wasn't in any problem to drive it along So I mean I suppose that's why I juiced I have structured it in the way over I have said in order to get there that this is a problem solving statistics is not a subject in itself you know this is good almost knowing I don't think it's a huge intrinsic interest in it there isn't probability but statistics is it only exists in order to solve problems for people you know it's there's an enabling technology of vertical and so that's why I think it has to
be driven From that perspective of real-world problems then you can get in all sorts of methods and stuff like that but if it's just driven by you know a theoretical structure I think it's dry and actually pretty tedious and why should anyone see there's a point in it because it doesn't even have the beauty of maths you're not proving you know nice elegant stuff so trains that nobody likes it and I think it's a real shame because I think it's Tremendously important and you know we need we need people with statistical literacy they don't have
to be mathematically in great mathematical skills but they need to have some statistical literacy really more about communications and statistics but what would you advise people community communicating safety to immediate it's really interested in communicating risk and I asked that is somebody from public health England I'm the guy who said he Cigarettes with 95 percent less harmful the guy who said he cigarettes with 95 percent less harmful oh yes great good part right - absolutely but that but that's a number of course that was constructed on the basis of expert opinion and has been you
know generally you know I think a very reasonable number I've been clear about its basis and it's been it has been criticized a lot so that I mean that there's all the propaganda and ecigs is A really really tricky area and I I think you know the risk world is is but I'm working it's a very special one because there is like an e-cigarette so so many agendas and that there's a you know huge wish for many people to frighten other people and make them anxious you know I don't I could give it to us
in the killer roast potatoes story you know the dangers of having one during a day and all that sort of stuff is being you know propagated I think in It with a misplaced urge to improve the public health of the nation but of things that are actually very weak evidence there of any harm at all and they're propagated by making people anxious on this may give you cancer this way their current thing you know I've been wondering at a wickety counselling listen though I think this actually you know people should really ask themselves whether it's
a moral thing to do to deliberately trying to provoke anxiety In people when there's no good evidence actually that there is reason to be anxious I think it's a very suspicious thing to do again Hans Rosling is the arch you know statistical communicator he does book thankfulness he's got this lovely phrase that we should be concerned about what is dangerous and not what sounds frightening and people who just try to frighten us no really we shouldn't we shouldn't be listening unless they can Really show this is dangerous in comparison with other risk we face and
we're concerned about and so I I think it's a it only is I think feel it's an ethical issue in terms of you know what one should say to people to try to manipulate their emotions and their behavior hi I'm sorry I just have a very practical question about one of the sides that you showed about Shipman and the Alpha and better and I understand how by raising that bar or the threshold You would minimize the alpha error but I don't understand how then you minimize the beta yeah that's a that's a very it's a
very good point it's not so much you minimize beta it's just that if you plug the formulas for those lines which were developed back in the Second World War involved both alpha and beta and so you can't just specify them on the basis of of alpha you need to know also if somebody really were harming and it They're set for an alternative hypothesis they've got double the risk no that they also you would detect them fairly quickly and that can affect where the line is so you both want to have the line high so that
you don't make false positive claims but you want to have it low so you find people quickly so there's this tension going on and that where that line is kind of balances those two tensions so that's why they're both important oh that was just an Arbitrary choice I was setting them both to a hundred thousand they don't have to be you can have them different it's purely an arbitrary choice that I wanted to be sure you know yeah completely arbitrary if you change beta they'll go up and down I've got a there's a log 1
minus alpha Peter I think it's the fourth the nice thing sector question from here I'm really statins yeah that's all do we take statins of the swage statins Because everybody take statins will improve a little bit or because remember of a population who will benefit and the drug companies down while it Telly's because they will sell this keep on selling a statin okay there's a footnote in the book saying why I take statins and so basically you know I put myself through a risk calculator q risk to a couple years ago and it came out
with a 16 percent chance of a heart attack will stroke over the next ten years assuming I don't die of something else which is quite high and it's it's high enough it's used to be and it's it's an at a level at which GPS are recommended to offer statins for the patient and and when I took the statins my LDL weren't buried down by two millimoles bolita and put it into the calculator and worked out that my risk had gone under nine percent and are docketing side-effects if I did it wouldn't take them or exchange
brain and so I think that's Reasonable know they may not do me any good at all I'm no idea whether they'll do me any good at all if I have a heart attack I won't know whether I defied it anyway I don't have a heart attack I won't know whether they they help me so I can never say whether I have personally benefited from it all I can say is that out of a hundred people like me taking this instead of sixteen there'll be nine at the end of ten years having this heart attack and
for me I Don't know which one of these I'm going to be whether I'm going to be there too it's enough for me to do so it means here you are applying population measures to an individual and saying that yeah if all these people do it they will benefit on average and that's fine though in other circumstances I don't like that population thing because you know we know that for example drinking alcohol if everyone drank a lot a bit less even the people Don't drink very much at all you'd have a hue a big public
health benefit and so in public health campaigns and the Rose idea should be you should be aimed at reducing everyone's bad behavior not just picking on the high drinkers today the biggest thing what it means that you need to tell people there to change their behavior when when you can pretty well guarantee that have almost no effect on them whatsoever and there it's different because then in those Situations I think it's quite reasonable for an individual to say well what you're recommending is beneficial for the population at all but I'm not it's not benefit I'm
not going to do it I'm just not going to do it I'm going to choose not to do it so it definitely depends on magnitude I think this business of how much you can apply these population things to yourself as an individual's phrase it's a very subtle issue it means very it's Very complex and you can see in a lot of the language that this is not understood I think that if this he really is quite a tricky issue I just asked they did the very back thanks my name's Emma Beach I'm sorry Emma Beach
I'm an editor can't you oh sorry does that work hello Shane could you maybe talk a bit more about what you said about Howard Shipman and kind of using the data to try to predict when you know it was possible to say that he May have been killing people is that really what would happen in reality or would you actually look at the mode of death and and what were potentially the the actual medical causes and sort of process by which the individuals died rather than using the quantitative data to claims and how those ways
of observing and collecting data actually lead us to make decisions in real life yeah actually inquiry and all the documents are still up on the on National Archive it's quite extraordinary and very moving and for every one of those victims there's a complete story of pages of what happened to them and so on so that that's the point is that the data does not people in the stands Asians you deal with data know the inadequacy of data it can't tell you the answers to things you always need extra information you need qualitative you know you
need knowledge and judgment and experience and Conversations with people and things like that so that we know that any analysis of that data is only is only can only give a you know a rough view of one aspect of what went on and in fact in the inquiry because they actually follow through that is 15 exhumed 15 victims they found with these high levels of diamorphine all the all the other people have been cremated has no record of their of how they died so actually you know for 200 of these Victims they David said they
confirmed death but they could never actually prove it completely it's just based on you know the the the medical evidence and the way he'd changed the medical records which is the big giveaway he didn't realize that when he changed the records everything was time-stamped he's one of the first it was an early adopter of computing and but he didn't realize that actually when a real computer hasn't got got into His database you could see how it had been meddled with so that's one of the things that convicted him and was his was his thing so
I think the I don't sure if I've answered this properly but I think the statistics it can it can point largely it asks questions that's all it can do except for the monitoring thing but even though it's completely theoretical because that that question when could even been caught was something that the victims families were Very interested in and yet the judge concluded that you know in theory he could have been caught a lot earlier but in practice nobody was looking at that data and so we can't blame anyway I guess I want to go back
to the question around ethics because we're at the moment we're in Big Data we're in data being sucked in from everywhere but there's no quality assurance on it and whose it's a such a policy question whose responsibility is It so if you're a machine algorithm you know you're building something you're using the data that you've got and it's not good enough it's got inbuilt bias it's got all the other problems whose responsibility is it in that scenario to say that's not good enough and you need to make it this is obviously a matter of you
know huge interest at the moment like somebody said recently that there's more people working on the ethics of AI than there are working in AI so you know With the setting up of institutions the scent of Earth you know data ethics and innovation and the Ada Lovelace and all that you know this is a credibly important thing and in the book you know I deal I talked about this quite a lot in particularly for example the compass algorithm that's being used in the US for today to help judges you know on sentencing in bail decisions
is a proprietary algorithm that you know you can't see what it's doing and you know And it's been strongly accused of having a biases I don't think it's statistically I don't think actually you can prove the bias there but what it certainly do does is use information that's purely associative it's like you know your family history who you mixed with as your kid and things like that and statistically yes that might mean be correlated with the fact that you might skip bail or something like that or my tree offend that is it fair to use
that It's a circumstantial evidence for making the decisions rather than something it directly relates to you your case your specific case you're using associational evidence so it's I think this is really important and I think they again that in the future people will look back at this period as a Wild West and in two ways first of all the the fact that were also prepared to give away our personal data to anybody to make money active and secondly in the Way that we've allowed we allow algorithms to be making decisions without proper I said actually
a regulatory basis so I give on all talks about the snare but trustworthiness of algorithms and there's two aspects of trustworthiness first of all there's what the algorithm actually says can you believe it for the Titanic algorithm it says there's you know sixty percent of these sort of men died you know don't know survive well I want that to be Sixteen percent you know want it to work like that but the other thing that's really important it's the trustworthiness that the claims made about the algorithm by the developers and these basically can't be trusted because
we're these are products so people would make all sorts of claims about this medical algorithm this thing and nobody's testing them whereas if it was a drug or even a medical device you'd have to go through a regulatory System it's extraordinary that you can bring out an algorithm to be used in that and I we're doing it I mean we produced a prostate cancer algorithm last week and we did the front end on and the sign now being used for predicting results after count you know men with prostate cancer how long they're gonna live and
we haven't had to go through any regulatory process for them and we can get a see mark for it and but you know I I'm not saying to say We should because I think of course we've done it very well and we its Cambridge University and it's on NHS site and so we have to produce some some ransom validation that it is it is we know appropriate so I think we have we've had to produce some evidence but I think we could have gone up got away we're not doing that just shoved it up and
then people might start using it so I think that these things have to be started as people take these things more Seriously we're going to have to develop more of a regulatory regime that would have been our last question unfortunately we have run out of time but ladies and gentlemen it's green a great pleasure to hear professor Davis Booga how to give his very informative and engaging talk thank you very much for taking the time to join us thank you [Applause]