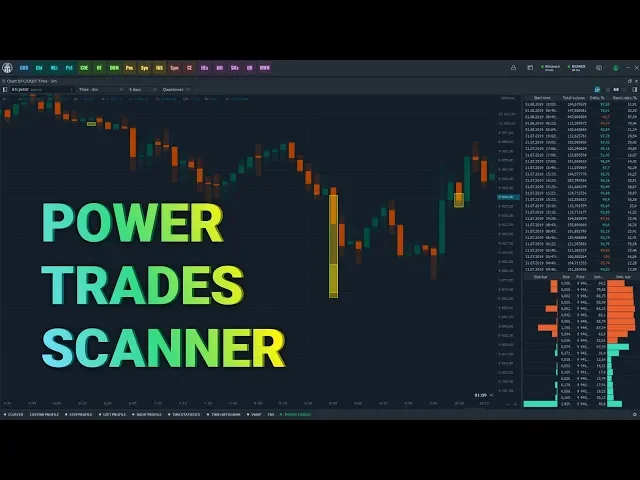
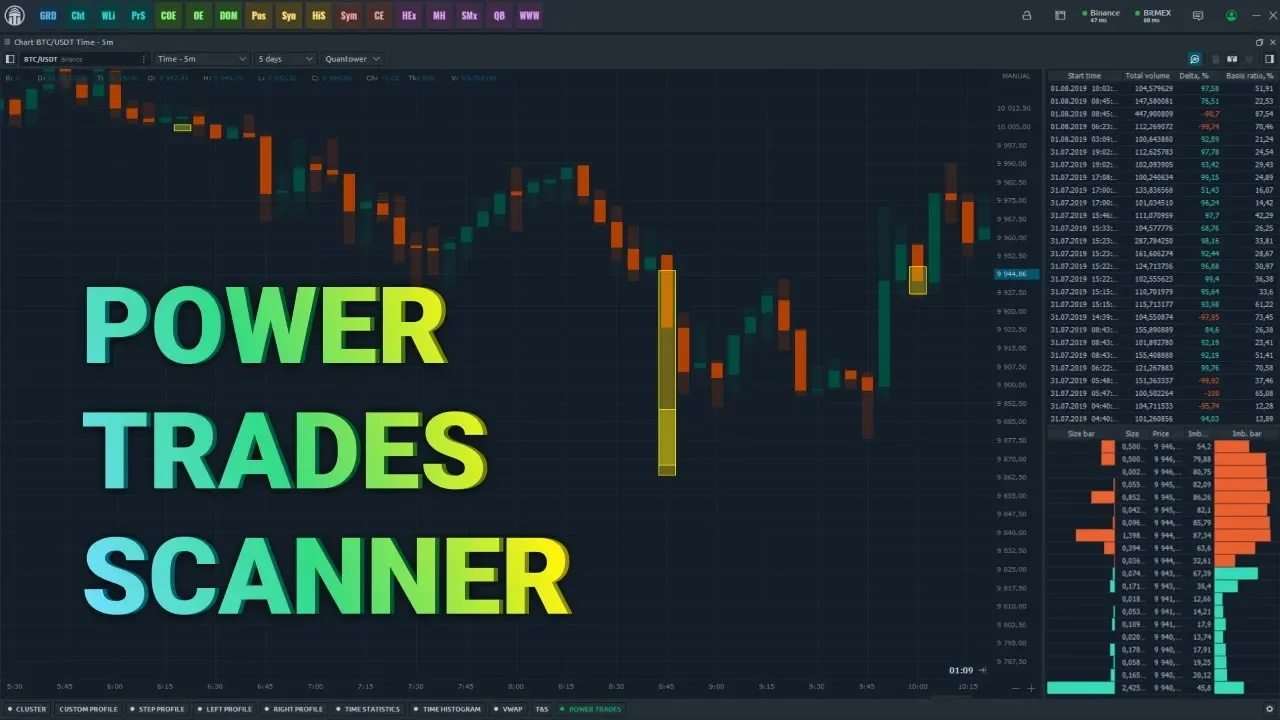
hello everybody welcome to our webinar devoted to our new powerful tool the power trade scanner we'd like to show you what it is how it works and how you can use it in your trading so let's get started first of all let's discuss what is the power trade scanner the main purpose of the tool is to search for zones with large volume traded in a very short period of time such situations may proceed a short term change in the ratio of supply and demand and as a result it either breaks an existing trend or it
starts to form a new one so the main goal of the tool is to catch such zones understand their nature and to use them as a starting point for your analysis or in combination with our volume analysis tools and order flow surface but before we go ahead we need to clarify a couple basic points as you see on the slide there there are two important statements the first statement is that the probability of price movement up and down in the short term will tend to be 50/50 one way or the other the second statement is
that the price always moves towards the least resistance so keeping these two statements in mind let's think deeply about probability and discuss and also clarify why it's 5050 nowadays and throughout market history there's been a lot of research related to the mathematical statistical distribution models the closest model to current market behavior is the normal distribution model but the problem is that the market doesn't fully comply with this model and let's think why first of all I'd like to say that this is quite a common practice to use mathematical models to predict the volatility of the
market to make option pricing or to calculate margin requirements now generally all these questions are usually solved via the normal distribution model but also it's well known that there's a problem and this problem is the fat tails that happen with the market now what does that mean fat tails well let's take a look at the picture there's two lines the thin line represents the classical normal distribution and the thick line describes the reconstructed market distribution now pay attention to the tails there's a big difference between the two lines according to the normal distribution model the
probability of huge movements should be very small but the reality is totally different and in critical situations real market behaves very extreme the best example I can think is the year 2008 where the price moved down for a long period of time and according to the normal distribution model the probability to cross three standard deviations is less than 0.1% but the real probability was much larger now this phenomenon is known as the fat tailed distribution now look inside the shape where the process is close to a central point this central point calls the mathematical expectation
that the probability of movement is almost the same to normal distribution and tends to be 50/50 so how do you read it and how do you understand it well it means that in some certain movement or a moment of time it doesn't matter what exact moment we're looking at the price will move up or down with the same probability 50/50 it does not mean that the price does not use some special price levels volumes or any other support or resistance lines it only means that the normal state of the market if we take a price
in some certain moment of time and measure the same value to move up or move down that probability will tend to be fifty/fifty now let's go back to the second statement where we say that the price always moves towards the least resistance so how do we understand this well for example let's take a look at the next slide now what we see here is an example of simple market depth we have two parties one party are the sellers with the total sell volume of 20 lots and the other party are the buyers with a total
volume of 200 lots now to simplify let's say the average trade size is a 5 lot volume and as we know from the first statement the probability to move up or down is 50/50 and obviously the price easily breaks the sellers will move up because their total volume is much less than the buyers volume so to summarize we need to remember that the probability to move up or down is 50/50 and price always moves towards the least resistance now let's ask ourselves what will happen in a very short period of time with directional trades where
very large volume occurs well the answer is quite simple such event will significantly weaken one of the sides of the do M and it could give us an understanding that in the short term we have an imbalance therefore we can draw the conclusion that the market can change its existing trend or for example go through some strong support or resistance level let's go to a practical part and look at how the power trade scanners works in real time now to enable it you need to click on the volume analysis toolbar you activate it then click
to a power trades button now the systems will automatically try to load the predefined parameters for the selected symbol we've prepared for you a list of predefined parameters for a variety of symbols and you can familiarize that with on our website now before I show you how the power trades works we'll need to look at our settings the power trades is a very complex tool and it has a lot of different options but it's not so difficult to configure it as it looks like there are three main parameters that are most important to work with
and we combine it into it's what we'll call a general group of parameters these parameters depend on the selected symbol now the first parameter is the total volume it means the amount of coins or lots of some particular asset that should be traded in a specified period of time this period of time we call the time interval it measures in seconds and by default we suggest to use 3 seconds as a value of time interval but for some symbols you may need to play around with it to find a more accurate value also I'd like
to clarify that the last parameter the basis volume interval it allows you to determine the time for which the volume will be taken as the basis and then we use this basis in order to determine how strong the zone is so for example we got a zone with a volume of a thousand lots and that was formed in three seconds and in order to understand how potentially influential that zone is you need to compare the volume of the zone with a certain basis so as a basis let's take the volume that was formed in five
minutes let that five minute volume be ten thousand watts so now we're going to calculate a basis ratio of our zone and what we do is is we take the volume of the zone divide it by the basis interval volume which is 1,000 divided by 10,000 multiply that times 100 and that equals ten percent so in other words within that three seconds 10% of the five-minute volume was traded and that's not very much now what conclusion can we make is yeah the volumes strong but not critical and because the moment of training is very intense
and the do M is dense and because that zone only has 10% of basis volume but what if the five-minute volume was not 10,000 watts and let's say only 1100 let's say we found that zone somewhere in the midnight hours with less trading activity now in this case the base ratio of our zone will be 1,000 divided by 1100 times 100 which is 91% and that means the trading is not intensive now and the influence of the zone can be very significant now that's the same volume of a thousand lots of different situations can be
both significant and insignificant and effect the do end differently this is a very important parameter to understand and to work with because it answers the question is this an influential zone or no now other parameters are quite complex and allow you to deeply configure the power trade scanner and in general cases it's not needed to change them but if you'd like to make some research you can play around with it and come up with your own variables now let's go through the history and analyze the results as you can see the power trade scanners finds
very interesting zones just take a look at how influential they are I'd like you to pay your attention to the right part of the screen here where we can see a table that contains all the found results and by clicking on a row chart it'll automatically focus and highlight the selected zone also you can manage the rows visibility by clicking on the header and specifying the particular columns now look at the Delta column this column tells you the direction of the zone and a positive value means that in the main zone was formed from by
market orders that filled cell limits and vice-versa a negative value means the zone was formed from sell market orders that were filled by by limits so simply it's saying that allows you to understand who's pushing the market the sellers are the buyers now finally the table at the bottom has the real-time level 2 information and it shows you the current imbalance of the buy or sell limits so that's all for today and we thank you for your attention and yes this is the time to now feel the power of the power trade scanner and for
more details come visit us on our website at [Music]