folks welcome back this is module 2 of month two of the ICT toship we're going to be specifically teaching on how to frame lowrisk trade setups now before we actually consider doing this we have to consider what makes a setup worth taking and ideally selecting trade setups on higher time frame charts is ideal that's the primary function of a high odds probability trade you have to look at a higher time frame chart to give you the directional bias to give you the institutional order flow the the support or resistance ideas that would be framing the
buy or sell idea that you're looking to do and the reason why we do that is because large institutions and Banks analyze markets on daily weekly and month monthly basis now when we do these things we're locating price levels that align with institutional order flow this is key because if you don't have the understanding of institutional order flow on a monthly weekly and daily time frame it's going to limit your exposure to high probability setups higher time frame setups form slow and provide ample time to plan accordingly folks that can't day trade uh folks that
can't be inside of the short-term intervals uh in terms of uh charts they have businesses they have jobs they have life uh you barriers that keep them from being able to be a intraday Trader uh you don't necessarily need to be a day trader you can be using these higher time frame charts and they'll be a frame out really lowrisk high-end probability setups it doesn't require being intraday what can we do to lower the risk in a trade the higher time frame has more influence on price so we focus there the conditions that lend to
a trade setup on a higher time frame can be refined to a lower time frame transposing the higher time frame levels to lower time frame charts is important because that way we can start to reduce the overall exposure in terms of Pips for our stops and then finally refining higher time frame levels to lower time frame charts allows for smaller stop-loss placement and by default lower risk okay sticking to our model uh we used the Aussie dollar daily chart the last time um we're going to look at this same set up and we're going to
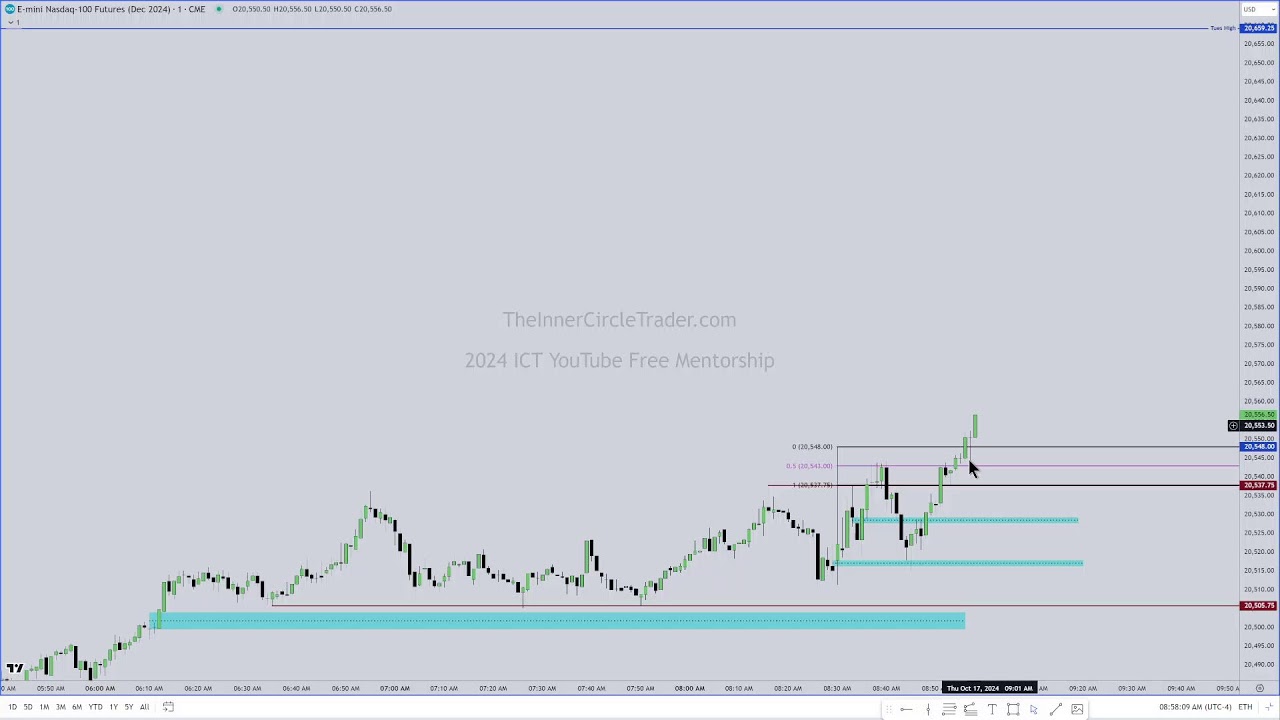
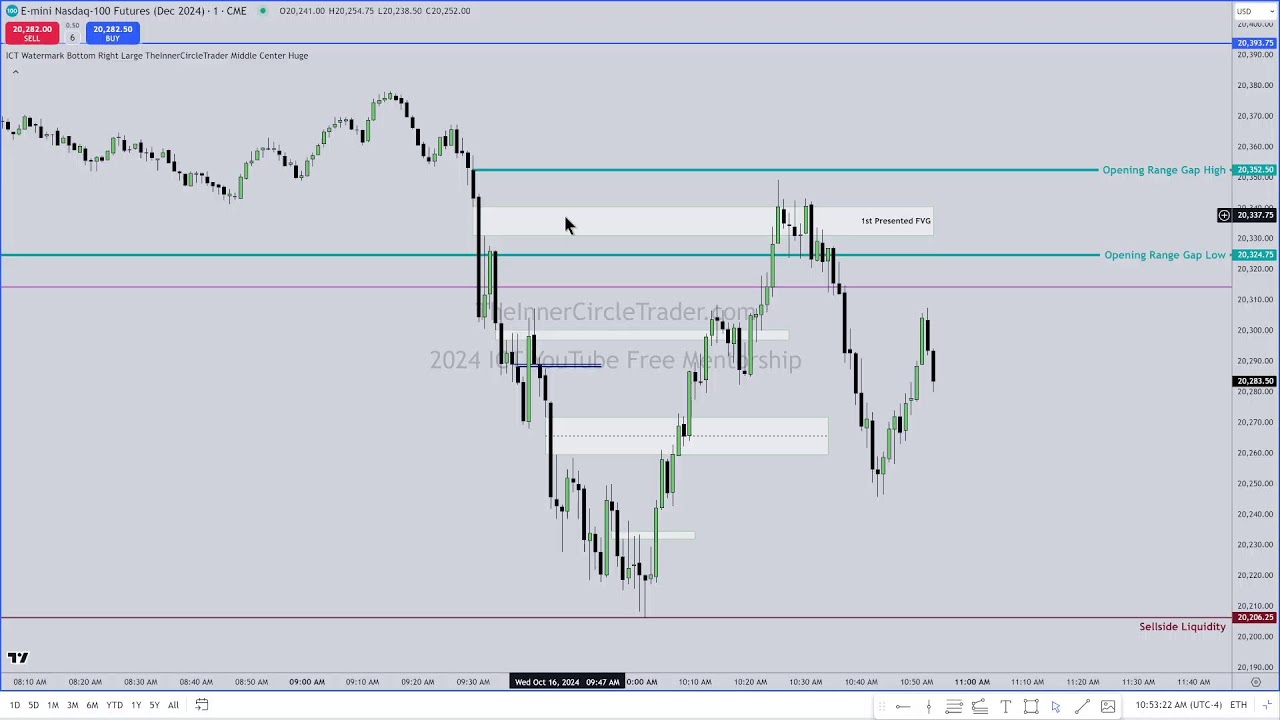
look at it in terms of refining it with lower risk now I want you to look at this chart carefully because this is exactly the same chart you saw in the previous teaching now I'm going to amplify on this but it's important you understand the way the framework is here you're going to see it's exactly the same thing just brought down to a lower time frame chart and we're actually going to do it in two scales lower I want you to look at the fact we have the higher time frame 75 uh 7512 level relative
to the daily chart that's what this line is here delineating the daily bullish order block notice we have a old low here and price goes through that down into that higher time frame level it's really important you see that because not only is it just because we're going below old lows not enough to expect a reversal okay we're not looking for that just because that's the case we're looking for a higher time frame premise why should we expect there to be buying down below an old low because this daily chart level 7512 is an old
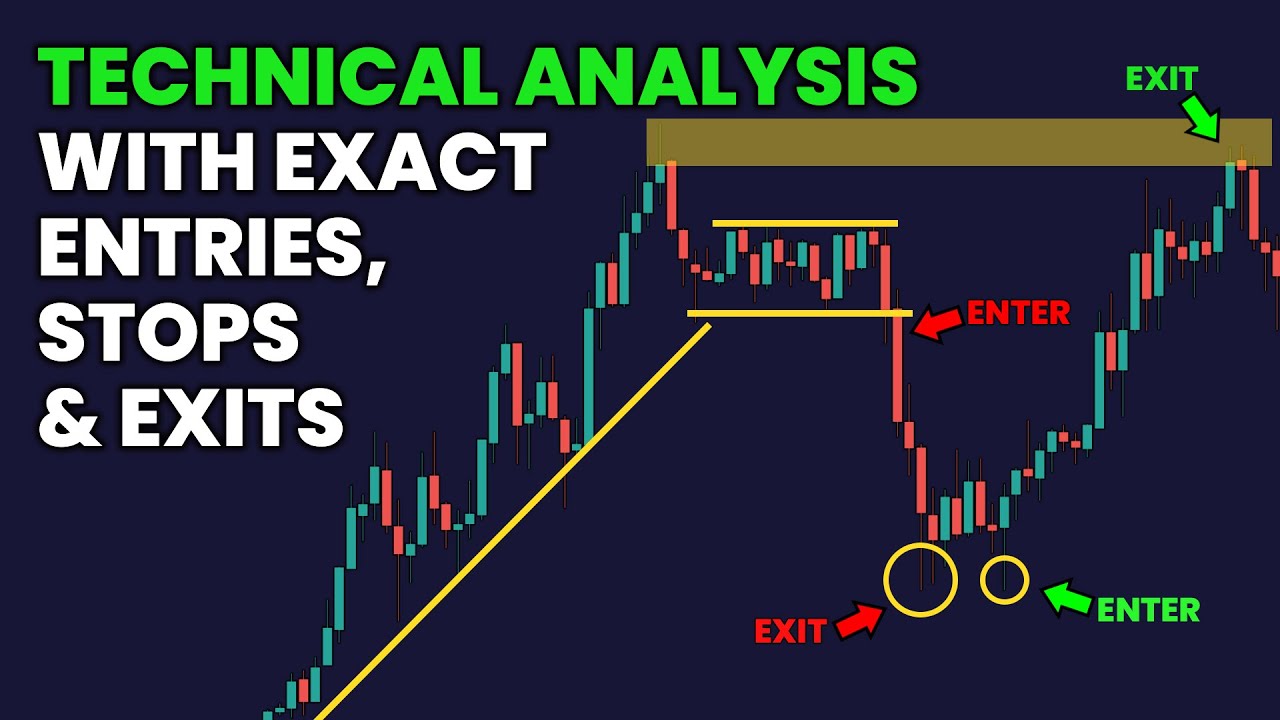
bullish order block because banks have bought there before so if we trade into that level again okay look at the framework here we have a hourly chart with a low being violated down into a key support level relative to a daily time frame we've noted obviously the buy stops above here just like we did in the first teaching and obviously the second area of buy stops so we have upper level objectives framed on this trade it's not a scalp it's not a uh day trade it's something that's going to give us a little bit more
magnitude okay for uh objectives for hauling in Pips now obviously we framed in the first teaching in this uh month's delivery of content uh we looked at this down candle as the bullish order block and we were looking at 7542 as a long entry and obviously by doing that we framed what a 20 stop this is where our stop loss would be which would be below the main threshold of this down candle which is a bullish orderer block so what if you want to get a smaller stop in relative terms to uh 20 Pips and
here's a more important thing what if you want to be buying lower and offering yourself a lot less in terms of risk exposure well that's going to require us going down into a 15-minute time frame everything here look very closely this is very close to what you saw on an hourly chart we have an old low price trades down below that o l right into that key level 7512 level now this up here is the buy order that would be needed on an hourly chart way up here but what if we focus our attention down
in this area here what can we do with this information well obviously the same thing there we have sell stops below an old low where buy orders can be paired up on the smart money side and you see the market trades down into that level 7512 so we do have a turtle soup long setup but we don't require the price to come all the way up here before we start buying so how can we do this and reduce risk well we can take the bullish order block here the down candle right off of that level
and why is this a bullish order block that's it's valuable and it's worth taking because this candle trades through it right here and now we can focus on the midpoint of that candle up to its high in that area we could be a buyer so could be a buyer down here at 7520 okay and have a stop loss down here at 757 it should not go down to 757 if it's going to go higher it should go up higher from where it's at now by doing so now we have a 17 pip stop loss and
look how much lower we are in relative terms to what we saw on the setup on the hourly chart way closer to this key level of 7512 and we're using a 15minute time frame to do it so looking at it in terms of even further reducing the risk we can take this small little area in here and refine that same sample size of data okay and we're going to take a closer look into it okay so we're zoomed in now on a f minute chart all we're doing is looking at that same 7512 level okay
and we're refining the entry from 7520 what what can we do differently here well let's take a look at what's going on inside this yellow area okay we have price with another down candle as it hits that bullish order block 7512 on the daily chart this down candle gets violated right here so now we can start looking at this down candle from its open or high down to the midpoint and we can be a buyer there or we can just simply say okay well that's basically the 7512 level we'll just add the spread to it
in terms of buying that puts us in around 7515 our stop loss could still be down here at 757 that's less than 10 Pips less than 10 Pips on a buy now you can refine this where your risk is eight Pips here and in first profit of eight Pips above here second and thir so we have a multiple of three R before we even take out the buy stops above this old high on a 5 minute chart now Noti this is not even the buy stocks that was framed on an hourly chart all we're doing
is using the price action on the time frame we've executed on and looking at where price is going to be reaching for it so if we have a multiple of three r or other words we've made three for every $1 we risked so the price has already moved 24 Pips up from our entry in here and our stop is only 8 Pips below where we would enter at at this old low here notice also by refining our risk like this we're actually getting multiple of three R reward for our $1 risk as we hit the
entry that would be assumed on the hourly chart at that n at 7542 level we're hitting that level here with lower risk and we're getting a 3 to1 reward ratio think about that the risk to reward is $1 for $3 to be made or in terms of reward the risk we're looking at $3 made for every $1 risk so it's amazing how you can take this and refine it down to smaller time frames you don't have to have big super wide stops but it does require you to understand what you're doing and why you're doing
it you just can't get in there with these Ultra short stop- loss what if you don't understand price action and why it should be responding on these levels

![Visual Calculations in Power BI - DAX Made Easy! [Full Course]](https://img.youtube.com/vi/JITM2iW2uLQ/maxresdefault.jpg)

![Hands-On Power BI Tutorial 📊Beginner to Pro [Full Course] ⚡](https://img.youtube.com/vi/5X5LWcLtkzg/maxresdefault.jpg)

![Hands-On Power BI Tutorial 📊 Beginner to Pro [Full Course] 2023 Edition⚡](https://img.youtube.com/vi/77jIzgvCIYY/maxresdefault.jpg)