So welcome back uh to unit 3 now guys um obviously I hope you've got all your charts set up nicely now uh you're kind of starting to grasp the basic uh settings of the footprint chart uh and enjoying that trial of yours um so obviously this is unit 3 this is challenge day four of 30 um this is a two-part series both part A and B so just a few little uh tips and and things to take note of uh first things first um You know all the principes that we're going to speak about over
the next couple of slides uh they predominantly applied within the cash hours okay and the reason being remember the footprint Tool uh is a tool for interaction between buyers and sellers now outside of the cash areas it's not to say that there isn't uh you know buyers and sellers however uh the type of of participants uh is very different to what you'll see uh when we have the cash Hours so for us we're more focused on the interaction within the cash hours uh so just to basically uh summarize that uh in terms of obviously you
know the currency space that'll be roughly around 800 a.m. uh GMT uh and that'll last all the way up until uh around 4:00 p.m. uh GMT which is the fixing in terms of the uh the WTI oil uh that'll be around 130 p.m GMT uh and that'll run all the way up until 730 GMT in terms of the e- mini snps uh very straightforward 2:30 P.m. uh GMT until uh roughly well not roughly until 900 p.m GMT uh and lastly the gold Comics uh again roughly 130 uh up until the 730 p.m. so again uh
the important thing to understand is those are the time frames within uh which you're likely to find the types of participants that are going to show the kind of interaction uh that we're going to speak about within this principle based unit okay now note so important guys uh you know principles are not an Exact sence okay uh this is not a a signal course this is not a course about me saying to you uh you know when it does this you buy yeah and you put a stop yeah uh okay that that's pretty much uh
it was a fallacy sold to Traders back in the day um you know people wanted an exact approach we are discretionary Traders we trade principles based on discretion uh by that very definition there is no exact science and because of that we always Need to manage risk okay it doesn't matter you know I can I'm going to share with you a lot of rules of thumb uh and it doesn't matter if if if you know the setup uh you know you're so confident uh in that setup we always have to manage risk okay it doesn't
matter how confident or high how high the probability of success is we always have to manage the risk at the end of the day okay um then we're going to talk well then the most important thing is uh you Know how do you adopt these principles how do you uh get better at these principles and now unfortunately it's like everything in life any skill uh it's going to come through a lot of observation uh and most importantly a lot of practice okay so if you want to understand these uh you know these principles a lot
better just adopt them to the live markets and over time uh you know you're going to uh learn uh and understand them a lot better okay uh and Then obviously do note I am going to share with you quite a few rules of thumb uh but bear in mind they are generalizations okay so it's not a hard fast it's not a if x does this then you do why okay it's not as straightforward as that uh but those rules of thumb they are high probability rules of thumb uh so do jot them down and keep
them in your Journal okay and then lastly do note each principle can be best seen in various strategies okay so what I'm Going to share with you as I go through each principle is I'm going to highlight for you where you know in which strategy uh over the next couple of units that you're most likely to pick up on that principle now the reason I've done this is simple uh as you're going through the strategies um you know what you can do uh is you can come back to this unit uh and view the the
different um you know principles that are adopted within that strategy uh and hopefully that will Highlight uh the key elements of the strategies that we're going to focus on okay guys so that being said let's get straight into it then now first thing is uh the first principle we want to talk about is a strong and weak auction process okay so very simply uh an auction process uh is where buyers and sellers are interacting with one another uh buyers will obviously in theory interact when prices are at a discount price and sellers will interact in
Theory uh when prices are at a premium price now anything in between uh markets in theory are fairly balanced okay so anywhere within this uh we are reaching a fair price or a balanced uh Market okay now obviously the basic assumption is markets will very quickly move away from discount and equally very quickly navigate away from premium prices okay bear mind obviously the uh the basic premise of the market or the markets were created in order to facilitate Trade so between where discount prices and buyers will be and between buy or sellers at premium prices
uh the market will oscillate and facilitate the trade okay so obviously one of the most important things um you know that we look at uh in terms of rotations and processes is this interaction okay it's all about interaction that's what uh the footprint is all about so what we're going to learn about and I will talk about this quite extensively uh you know In a couple of slides time uh is this concept of initiative and responsive so very simply initiative is simply where a buyer or a seller steps into the market initiates trade in a
one directional manner uh in an aggressive uh type uh of manner now that's initiative um what that what then happens is as markets initiate in an auction uh they then bring in responsive type uh participants in other words if prices move from a discount and they move up to say uh a Fairer value we will then see a responsive action taken by a participant that deems this as fair value okay so they're responding to the higher price or responding uh to the auction of higher prices okay so it's simply that interaction you know this you
know this you know navigation between initiative and responsive that's what we're going to talk about quite extensively over the next couple of slides okay one of the things we do like look At when we talk about the auction process is the type of overlap okay this is quite crucial uh overlap simply means if I show you on the chart on the left side we can see a real almost a full overlap 100% overlap between rotations whereas in the latter part uh of the chart we can see a lot less overlap now stronger auctions okay tend
to have less rotational overlap whereas weaker auctions tend to have a lot more overlap okay then obviously uh in terms of Strong and weak auctions very strong auctions tend to show something called onetime framing now again in the example what we'll see is where we have rotations that cannot take out uh the previous low of a rotation that is what we call onetime framing now a very strong auction process will show this and exhibit this type of one time framing whereas a weaker auction very rarely or will never show it in fact okay then then
in terms of the um Another one of the key comparisons between strong and weak auctions is the Delta okay and this is crucial so what you're going to see in a week auction uh again if I can illustrate it with the first half of this chart is you're going to see the Delta remain relatively muted so no real net change uh in the Delta showing us that there's no real uh initiative being taken from buyers or sellers okay so as we mentioned when there's a strong auction I.E we seeing Initiative being taken and we're seeing
a positive Delta response when there's a weak auction and more responsive type trade as we can see on the left side of the chart then the Delta barely moves okay in terms of volume it's very similar okay when uh when we do have a very strong auction uh we do tend to see a higher or at least a pick up in the volume okay it's very important as a general rule of thumb what you want to see is when we have a strong auction and We have some real initiative being taken we also want to
see a relative pickup in the volume as well and we can see that relative pickup compared to what we've seen in previous weaker auction okay so where you can apply this strategy or where this is going to be applied to down the line uh it's very simple we're going to see a lot of this uh concept of strong and we weak auctions when we talk about the absorption and auctioning strategy uh as well as the initiative Drive strategy and the failed break of support and resistance strategy okay so that's our first principle discussed let's now
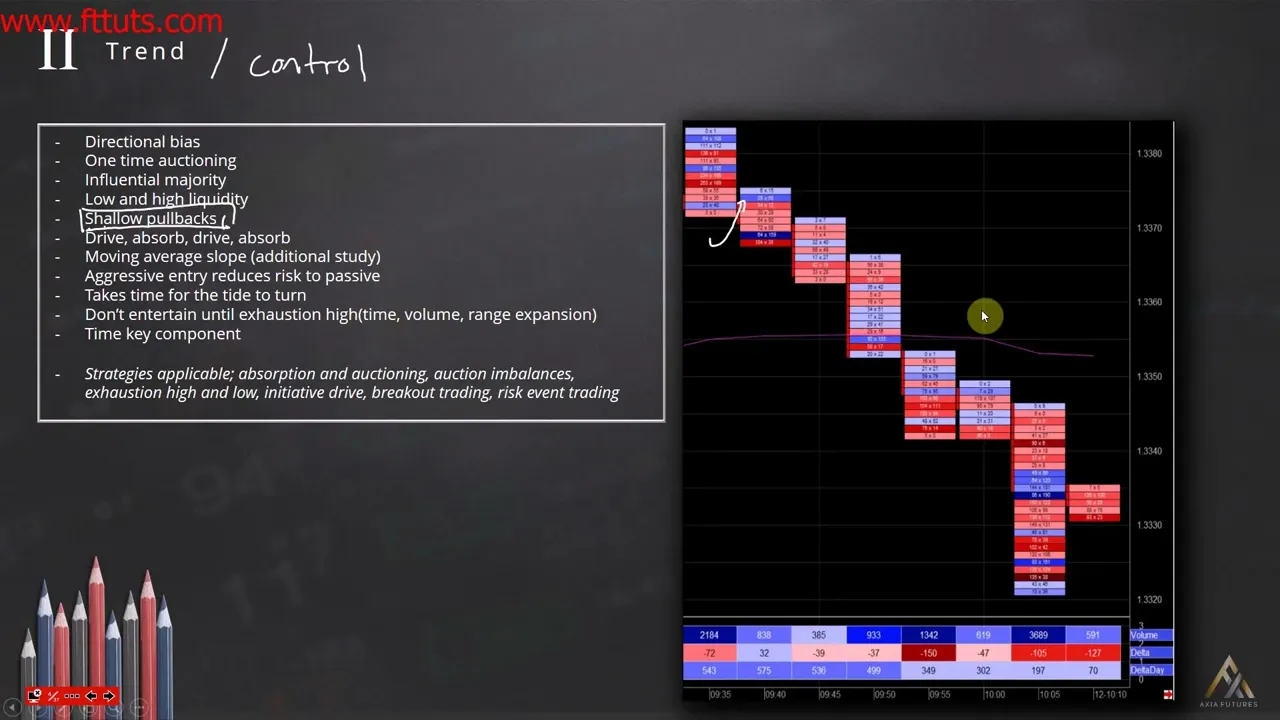
have a look at another important principle Trend okay something we talk about a word we throw around uh quite a lot uh the markets are trending did you see that Trend today but what in fact is a trend and how do we identify a trend now what you're going to notice over all these slides uh is that I'm not going to merely just you know State a Trend is something okay I'm going to show you the objective facts from the market so that you can learn to identify trend on facts rather than opinion okay so
what is Trend well the first thing is it's very much directional bias okay so you look at a market as you can see on the chart and there's a general directional bias in the market so it's it's moving uh in One Direction and can be easily observed okay the second thing onetime auctioning again we mentioned Onetime framing so onetime auctioning uh again is very very well it's the exact same concept where we cannot take out the previous high in this example of a rotation okay now to com you know to just include in terms of
that in that auctioning process when we have Trend uh we are exhibiting a very strong auction process uh you know where the market is moving and navigating in One Direction uh quite aggressively in other words there's quite a lot of control and I Think that's that's a key word you know to almost highlight is you know trend is nothing more than control okay it's one side whether it's buyer or sellers uh in control uh of the market uh and the direction of price okay now obviously in terms of trend uh what we do tend to
see is we can see it in both low and high liquidity conditions okay we will talk about the concept of liquidity later on in this unit uh but so important you know you can see Trend in low and high Liquidity okay a mistake people make they tend to think that when markets are trending there's low liquidity okay that isn't the case you can see Trend in both high and low liquidity markets okay now one of the key characteristics you tend to find when a market is trending and this is something that I learned very early
on my career it's something we call shallow pullbacks okay so what does that mean now again I know I've obviously got the footprint in front of Us um but what a shallow pullback is is in essence we can see if this is one candle uh ultimately the market you know it fails to sustain uh any kind of hold within that previous rotation okay okay so it's really shallow as opposed to something like this okay it's almost like if we were to put a percentage on uh on a fib retracement or something maybe like a 38.2%
okay so the Market's unable to retrace even 38.2% of the previous Rotation okay now again uh this you know shallow is a really relative term but what you can see very clearly in this example is as this Market's going down it's RAR failing uh to get any meaningful uh you know kind of bid into the previous Road rotation I mean we can see in this example right here it pretty much opens so it closes on the low and the very next candle opens on the low and sells off again okay so that's one of the
key proponents of of trend it's Really shallow pullbacks and and the purpose of that and this is what what's you know so important uh about the footprint is that the interaction I.E when we have a shallow pullback it's showing us the aggressive nature of the interaction uh between the buyers and sellers in other words it's not allowing any participants in so as this Market is rising and coming back sellers are so aggressive they're so intentional uh that they're willing to hit at very very Extreme prices okay now one of the key uh rules of thumb
again is that if a market is not allowing participants in by that very nature participants are thus being forced to be aggressive in nature in other words if the market won't allow them a passive entry it means that anyone wanting to sell need needs to be aggressive rather in other words they need to hit the market okay and that's why when we do see Trend we tend to see Trend continue for longer And longer and longer why because participants are desperately trying to get in uh and unfortunately they have to go to the market rather
than wait for the market to come to them okay then another key uh sort of like a a mantra I like to quote uh is it's sort of like a drive absorb Drive absorb that's what the pattern of trend looks like now again uh uh you know you can see this on the footprint but I'm going to illustrate it for you first so what it Looks like simply is you get the initial uh you get the initial uh drive and um okay so you get the initial Drive the market then has a shallow pullback and
we get this sort of accumulation phase okay uh also known as responsive price action so we get the initiative then we get the responsive then we get the initiative again and responsive and initiative so like I said it's Dy Drive absorb Drive absorb and this pattern continues almost for an entire session Uh you know in very good trending uh markets now if we were to look at that on the footprint again you can see it yeah sort of we get the market selling off we then get the absorption okay you can see the Dark Shades
we then get the continuation and again the darker Shades we then get the continuation and again the darker Shades and continuation and darker Shades okay so the light shades are showing us the initial ative and then the darker shades are showing the Absorption before we then get the continuation again all right now one of the key tools you can use and this is where I do think moving averages are particularly good um is a a study that you can add to your footprint uh or your candlesticks is a moving average okay you should all know
this by now but a moving average does represent lagging information however it does keep us on the right side of trend or at least if we're not seeing the trend clearly and Not picking up on the characteristics that I'm showing you uh it sort of prompts us to recognize the fact that uh you know there is very strong price Direction now it's very simple in terms of a moving average uh the slope effectively reflects the nature of the trend so a steeper slope reflects a stronger Trend whereas a shallower uh slope obviously reflects maybe not
as strong as a trend okay then uh if we talk about the next characteristic um And this is again a lovely little rul of and I've got a nice expression for this um as sorry let's go go over this point first um so like I said earlier uh an aggressive entry uh reduces the risk so in this strategy okay and we're going to talk a lot about Trend uh strategies when we talk about initiative but in this strategy ultimately uh by being aggressive okay so being an aggressive Trader in a trending Market you're actually reducing
your risk okay why Well because what a lot of Traders tend to do and what they make they make a really big mistake in trending markets is they they're not willing to get in uh on this area yeah okay what they're waiting for and is they're really hoping and waiting for that pullback now remember what I said trend is created because participants are forced to execute aggressively okay in other words the Market's trending simply because no one is being allowed To enter the market uh on a pullback or passively all right so by that very
definition if no one is being allowed into the trend then waiting for the market to pull back comes with its own set of risks in other words that might be the end of the actual initiative or Trend okay and that's why it's a lot it's a lot better and the risk is reduced to Simply uh be aggressive when there is Trend in the market versus being passive okay now uh the next thing And it's a lovely Mantra I've got it takes time for the tide to turn okay this is something again uh through failure through
losing a lot of money in Trend days I used to be particular particularly bad at them um you know what I finally learned was there does come a point where a trend can be faded and we will talk about strategies where you can uh potentially look to fade Trend however as a rule of thumb remember just like it takes time for a Tide to turn it also takes time for a big ship to turn Okay so if this is the big ship once it turns it's not going to turn in a straight line in Reverse
okay it's likely going to spend a lot of time turning tur turning turning turning turning slowly and then maybe move up so just bear that in mind guys if you want a fade Trend you have to acknowledge the fact that it does take time uh for Trends to turn around okay now what I would say uh when there is Trend in the Market when you're seeing these characteristics I.E sh shallow pullbacks you know influential majority uh etc etc just make sure uh you know that you're not entertaining the fade just for the sake of wanting
to trade okay one of the mistakes a lot of younger Traders make uh particularly when they have fewer markets to focus on is they feel the urge or the need that they have to trade okay what you don't have to do is you don't have to stand in the way uh of a Falling knife okay and that's where you have to be careful with Trends right if you're not going to get on the trend and take the right or the high probability trade don't stand against it uh just simply for the sake of trading okay
now what I would say uh you know when it comes to the exhaustion Point some of the key factors you can look at will be things like time volume and range expansion uh as a brief example what I will show you and we will talk about This uh when we talk about the exhaustion strategy But ultimately Trends do tend to end when we have the most volatility so again a rule of thumb the most volatility I you can see the biggest rotation uh tends to cap off uh the bottom of this trend and we then
start to get a slow turnaround so what we do typically see is that the exhaustion Point does come with a very high volume it does come with a much higher Delta Relative and um obviously it does happen in a relatively quick space of time okay what I would say one of the important propo or proponents or components of any trend is time okay uh the reason being is that you know obviously when there's Trend in the market you know participants that are shorting year and shorting year and shorting year they also need to be paid
for those trades so the longer the market were to say spend time in a sideways range the more Vulnerable those aggressive shorts become okay so time does play a key proponent in a trend uh obviously the longer a market is unable to continue the process of trending uh the higher the probability becomes uh for the end of that Trend okay so where you'll see this uh and where we're going to start talking quite a lot about Trend in terms of strategies will be gain the absorption and auctioning strategy uh we'll talk about it in auction
Imbalances as well as exhaustion high and low strategy the initiative Drive strategy the breakout trading strategy and risk event trading so again as you can see we're going to be utilizing this principle of Trend in most of the trade strategies okay let's move on to the next principle consolidation very simply put as the picture says markets are consolidating in other words there's a lack of Direction bias okay there's Neither your nor their interest from the buyers or sellers all right there's no initiative no one wants to take the initiative to drive prices up or down
so we see an exhibit exhibit of a lot of two-way trade now again uh there's complete overlap as you can see in the example we can see these rotations are all 100% almost overlapping uh one another okay uh in terms of some of the key metrics you can pay attention to a very neutral Delta okay so if you see The markets moving sideways yet the Delta uh is really not just not moving at all there's no real interest from the Delta that's a really early sign uh in terms of a real uh consolidating market now
again the reason we we learn to identify things like Trend or consolidation is because certain strategies are going to work well when the markets are trending and certain strategies are not going to work well uh when the markets are consolidating okay So it's about being able to differentiate between the two and apply accordingly all right now do note obviously I'm going to throw around words like a neutral Delta or you know a lower relative volume just remember everything with the footprint tool is in relative terms okay so it's all good and me while saying well
107 is low Delta okay but it must be low Delta relative to what we've seen in this market okay and that's the key guys remember Everything is relative whether it's volume whether it's Delta whether it's time it's all relative terms okay so again in terms of consolidation we're also likely to see lower relative volume um and again uh just remember with the footprint tool um if you didn't pick up on this in the unit 2 we will talk a lot about this uh in uh unit uh obviously the rest of this unit uh when we
talk about color shading but do bear in mind obviously that just like uh the prices Uh in fact let's quickly go over that again uh we do have obviously our shading uh I will talk about this at the end of the unit again guys but just to bring you up to speed okay in terms of shading we do have red and blue and again just to bring you uh just to bring you up to speed the blue is where the buying Delta is effectively uh higher than the selling Delta and the red is where the
selling delter is effectively higher than the buying okay now in terms Of that we're going to have three shades on each side okay the lighter Shades represent lower change in Delta whereas the darker Shades represent higher change in Delta now just like that is the case uh in terms of the prices it's the same thing for the fpbs tool okay um so the same thing in in other words where we have darker Shades that's showing us higher relative uh you know in this case higher relative buying volume uh and then obviously uh The same for
the Delta there in the lighter Shades as we can see with the - 9 and -5 those are the lower uh relative Shades okay so not just do we have the relative changes in the price we also have it in the actual fpbs tool okay so again that's why I really like this Tool uh it's a very quick visual representation of what's going on in terms of interaction okay now one of the mistakes a lot of people make and we're going to talk a bit about this later on When we talk about absorption there is
a significant difference between the principle of consolidation versus absorption okay consolidation is simply where the markets are consolidating there's a there's no initiative being taken on either side low volume and low uh you know a lot of overlap low volume and low Delta now in terms of absorption that's very different okay absorption actually tends to have very high volume okay it tends to have relatively High Delta and then most importantly okay consolidation doesn't necessarily consolidate and then move one way or the other okay consolidation tends to just continue consolidating and balancing whereas absorption when a
markets are absorbing once they break either side they then tend to initiate or Trend in that direction okay we will talk about this principle a little bit later on when we get to the absorption principle Okay um now one of the other things obviously uh is that when we do have this consolidation uh the markets can move in between this idea of uh initiative and responsive so they can keep you know we can initiate then respond then maybe initiate then initiate then respond initiate respond initiate respond so the markets continue this process of initiating and
responding over a period of time okay so where are we going to see This idea of consolidation uh well you're going to see it pretty much in every single strategy okay consolidation uh is just a general principal term uh for when the markets are moving sideways low volume low Delta not a great deal of interaction okay so in terms of the example what you can see in the Euro doll FX here uh is again a lot of light colors okay that's that's what you will tend to see a lot of light colors uh you'll tend
to see darker colors maybe At the extreme points um you know you'll see just really really uh difficult price action I.E you know no real clear uh Trend either to the upside or downside okay now the next uh major principle we're going to talk about and again uh it's a principle I feel very important we discuss because again I I feel like this concept of support and resistance get gets utilized uh you know it gets utilized extensively but a lot of the time in the wrong manner okay so What is support and resistance okay um
to answer that question uh you actually need to answer the question of what is creating uh an extreme Point whether at uh you know price point r or Price Point s okay what is it that's creating that now people tend to look at support as you know uh the line where you buy it and the market comes off that line and it bounces okay the low or whatever it might be right support is a lot more than just uh you know the low okay and That's what we're going to talk about we're going to talk
about three different types of support uh and resistance so the question you need to be able to answer is when we get to say uh a resistance is the market resisting because buyers are no longer willing to buy there or is it resisting because sellers uh want to sell there or is it resisting uh because buyers want to take profit okay what is the real reason behind why the market is stopping at That point that we call resistance okay so if you really want to understand support and resistance you need to learn to understand the
interaction taking place at that price point and those are the three examples I'm going to show you so one of the key things to note uh is the price response okay that's what I'm that's what I'm getting at is that real good support and resistance shows you a very unique specific price response and I'll show you what that looks like uh in A minute okay a lot of it has got to do with the volume structure okay high volume versus low volume and if I was to just bring it back to the basic sense when
we spoke about the auction process remember we said that sellers will always interact aggressively when the markets get to a premium and likewise buyers will always interact aggressively when we get to a discount okay so a lot of the time we interpret resistance as premium when it isn't okay so Market may Just come up here we see the buyers take profits but we still call that a premium price because we're calling it resistance okay in the case of where you know buyers are simply taking profits that isn't premium prices okay in the case where sellers
actually do step in and initiate prices back down that price action that we can call Premium why because sellers are stepping in to take advantage of Premium prices not buyers stepping in and taking PR profits okay And that's the key difference that you need to learn and that's the examples I'm going to show you so the first one is what we call a key auction reversal in other words it's an initiative taken from let's say the buyers and the minute it gets to premium prices we see initiative being taken from sellers it looks a little
bit like this okay we call this uh an inverse V reversal or in the case of where the market comes and finds buyers and buyers initiate we call That a v reversal okay now note this is the highest volume reversal so you'll see a very high volume and volatility on this reversal I we'll show this an example okay the second uh type of price response you can get is what we call an exhaustion high or low in other words the market gets to a certain price point it's absolutely exhausted uh as a result we tend
to see a response coming from sellers okay and a lot of the time that response uh in this example Will be profit taking okay now obviously this is slightly lower volume and volatility relative to the um relative to the uh key auction reversal now the third type of subordinate resistance uh is the failed break support and resistance okay a lot of you call this a head fake or you'll know there's a head fake and very simply it's where we're seeing a responsive responsive type price action okay now where you going to apply the strategy uh
quite a lot is key Auction reversals uh that is towards the latter half of the course uh breakout trading definitely uh failed breaks of support and resistance as well as exhaustion highs and lows okay let's look at a few examples now so we can get an idea of these three different types of uh you know support and resistance points so what I've done again I've just put a nice little chart here okay it's nothing more than just the oil uh and what we can see again traditionally People go and they put a line there and
they say okay well that's support and they put a and then they say that's resistance okay but it's a little bit more important and this is where the footprint is so key we want to drill into this area and this area and we want to drill into these areas and go and have a look at you know is this a discount price or is it merely sellers taking profit and is this a premium price or is this genuinely uh where the Sellers are or the buyers are taking profit okay and that's the key that's the
Nuance that we're looking for now the first one we're going to look at uh is this example uh of you know a a key auction reversal now what it looks like on a footprint is one the first most important thing is we spoke and we said it'll be relatively high volume and volatility okay now what we can see in this example is that there is quite a lot of volatility quite a lot of range Expansion now obviously uh we haven't quite got to the principle of volatility yet but for now volatility just simply means range
expansion or rotation expansion in other words this is a very large rotation in terms of the number of prices okay now what you will typically see uh with key support uh is once we find that point uh where we have found you know some sort of a you know a profit take uh ultimately there's there's a very specific manner in which Uh the market will trade or which the footprint will trade and again I don't want to explain it in too much detail cuz we are going to cover this later on uh in the now
the basic premise how it will look you will always tend to get dark colors around the low so really key auction reversal lows you'll get dark colors down at the low why because it's first a response okay in other words the market is selling off quite aggressively it's desperately searching for liquidity And suddenly it runs into a response okay these are passive buyers market makers whatever it may be but the market responds to that discounted price right once it responds to that discount price we then NC buyers not just you know be remain responsive but
also become more initiative so they step in and they initiate trade so that's kind of what we're seeing in the next uh rotation is that initially the market absorbs and straight away buyers say well we want to Be buying higher prices okay now within this process of buying higher prices you can still see a lot of Dark Shades and all that is is that as buyers are buying off the low we still have sellers that are desperately trying to get out why because the market has quickly moved away uh in terms of price so there
are a lot of potential sellers caught and they simply providing liquidity for buyers to buy up prices higher okay and that's all we're seeing we're seeing buyers simply Absorbing the remaining sells side uh price action okay and slowly but surely as those sellers start to get their full as those sellers positions become uh complete we then start to see the buyers Step Up the price action and continue to initiate prices higher now note this initiation or this V reversal as you spoke about will continue in other words the top of the V will only come
once those buyers run into again responsive sellers okay and that's what we Ultimately seeing here we seeing the market at higher prices run into responsive Sellers and again note what we see a nice high pickup in the volume okay so that's what a general v-shaped reversal will look like again I will go through this a little bit later on in the unit now the second example that we're going to look at is where we have more of a responsive to responsive type support and resistance so what we can see straight away I'm just going to
Illustrate it with a nice s and an R is we can see as market prices come down we see that obviously the sellers have run into marginal buyers okay so it's a case of the market comes down and it's not really that sellers are are are are maybe taking profit it's just they're no longer willing to be aggressive at these prices okay now remember the Market's job is to facilitate between buyers and sellers okay so if we were to call this buyers and call this sellers we can see That this Market's doing a very good
job of that now in terms of when we get responsive to responsive type price action what you're likely to see is you likely to see dark colors at the extreme but then the market rolls back over and dark colors at the extreme and the market rotates back higher and dark colors at the extreme and markets roll back lower okay etc etc now the key thing about this type of support uh and resistance is that it isn't rarely Support and resistance okay it's merely just a pricing area where the market is reluctant to initiate okay and
that's the key word all right in the first example we could see that there was real genuine buying coming in why because prices were at uh at a relative discount in this example yes the market is holding on to this price point but it does not call it it's not necessarily support just because the market cannot get Beyond this point right it can be as We see in this example simply because sellers are not willing to initiate below this price point and buyers are not willing to initiate Above This price point okay now what is
key uh and again and why we why I want to introduce this principle uh now is that what you're going to find in general terms is that as in the first example okay when we do have those rarely key auction lows uh those do act as very good longer term support and resistance okay whereas in This example these tend to act as much better breakout trade opportunities uh you know for us okay so that's the basic concept then of support and resistance right now that we've discussed that uh I want to talk uh about quite
an important term in the markets uh which comes from in fact the market profile and it's that term of balanced versus imbalanced markets now this is a crucial principle to understand simply because by the very nature okay trade Location okay the location of where prices will Define the kind of volume and volatility that we're likely to see okay in other words when you come in in the morning if you're not aware of the trade location of the market you won't you won't be applying the most effective trade strategies uh to that market okay and that's
what the balanc and imbalanced markets are all about so very simply a Balan Market is simply a market that is within the previous day's range Okay it's within the previous day's accepted value area uh and we tend to see relatively low volume uh low volatility uh and you know a lot of two-way trade so so if I was to illustrate that in terms of a Candlestick if that was the previous day's range uh and this is predominantly where most of the day's volume was then all a balanced Market is is it's a market that's simply
trading and oscillating within that previous day's Balanced area okay now you the most important thing and the rule of thumb with regards to balanced markets is that markets when they are balancing uh they are they are consolidating in other words there's a real lack of his initiative to the upside and there's a real lack of initiative to the downside okay now again that does change at some point and that's what the whole purpose of this course is about is that I'm going to show you the little Clues on The footprint chart you know particularly when
we start building the strategies I'm going to show you all those little clues that give you the hint when bang the Market's about to remove itself from a balance State into a more imbalanced State okay so with that being said then if I was to then illust what a uh imbalance Market would be it's a market that's trading on either the extreme point of the previous day or Even outside of the previous day's range okay now straight away uh imbalance markets uh you know the most important thing and the reason why you know imbalance markets
bring a lot of volume and volatility is because they are forcing participation okay so what do we mean by that let's say the previous day and I'm going to use the illustration of the uh the bottom imbalance let's say the previous day that all the buyers were positioned somewhere around this Price point now if the Market opens lower and opens out of balance there's a lot of buyers that are now caught offside okay so that by that very definition those buyers have an option to do one of three things they can either get out of
those positions in which case they sell they can add to those positions in which case they buy or they can hold those positions in which case they are neutral but the very fact that prices are lower is going to Force a decision and that's the key now if we look at on the other side sellers are also going to respond to the fact that prices are lower so if sellers are also responding uh because maybe they want to enter shorts maybe they want to add to shorts by that very definition we can see that a
lot of participants are being dragged in and being forced to participate at lower prices okay and that's why when we have imbalance markets we will always see higher volume And higher volatility okay so that's the basic interpretation of balanced and imbalanced markets and again the reason we go through this is because what you're going to find is that the strategies that are applicable to more balanced markets will be things like auction imbalance strategy and the failed break of the high and low strategy equally strategies applicable to be imbalance will be things like breakout trading and
the initiative Drive in other words as a rule of thumb when markets are not imbalance we will tend to see the initiative dve Drive strategy play out a lot better as well as breakout trading play out a lot better okay let's now move on to the next principle well actually let's have a look at a chart of a footprint balance imbalance uh so as I said very simply um you know we will just have the previous day's High and the previous day's low and we can see that the market simply Just oscillat between the high
and the low and again note the amount of overlap note the reluctance note you know how often the market might show us a signal to move up but then suddenly washes back down suddenly it sends a signal to be short and suddenly it rotates the other way okay a lot of chop uh a lot of two-way trade and a lot of lack of certainty in terms of Direction okay what you will also find as you can see in terms of the delta or the Delta day Or the cumulative Delta is we do tend to see
a relatively neutral Del Delta throughout a b balanced session as you can see uh in the uh this looks like the pound versus the dollar okay let's look at another example now of what an imbalance Market looks like so very simply uh we can see the market opened up uh towards uh you know the top half uh we then sort of sat on the top half all day uh and eventually the market went for the breakout okay and this is The key proponent is that you know Market can sit uh in the top range of
the previous day uh for some time and then when the timing is right when those signals get sent and the clues get sent we then get the very decent breakout uh and obviously the extension and aggression to the upside okay so that's just a basic understanding of a balanced and imbalanced market now um the next thing we going to talk about is is just general imbalances But within the auction footprint okay so remember we said the whole purpose of the footprint is we want to learn and understand the interaction taking place between buyers and sellers
now not only do you get a market that's trading imbalance uh or or balanced but you also get within each individual rotation you get an imbalance between the way buyers are executing and the way sellers are executing okay so the interaction between buyers and sellers sometimes Creates an imbalance okay now that imbalance tends to get creative when either buyers or sellers become more assertive in their execution okay so the when they become uh more assertive uh ultimately we need to know about that so we want to highlight that for ourselves okay because if all of
a sudden a buyer is becoming a lot more aggressive and a buyer stepping up the pace of purchases we don't want to be well one we don't want to be short but also we want to Make sure we taking advantage of that shift uh in buying uh execution okay now do note and imbalance just very briefly I'm going to go through it we look diagonally uh on the ladder uh I will obviously show you how to set up imbalances uh in unit um four and again we will talk extensively about imbalances I will show you
the imbalance strategy uh a lot later on the course for now however just understand that an imbalance we look diagonally on the Chart so for instance we look like that or like that or like that and what we're looking for is we're looking for a relative a very high relative difference between what a buyer is buying up here versus what a seller is selling down yeah in other words it's showing us when there's a sudden shift in the way the buyers are buying higher prices or the sellers are selling lower prices now in terms of
the chart it gets reflected in color uh as you can see on the chart and Again I will show you how to set this up but all we're looking at you now is as the market rotates higher when we see an imbalance suddenly come in from buyers okay it's showing us that the buyers are stepping up or changing the manner in which they are executing okay now if buyers suddenly start changing the way they're executing we need to be aware of that because it provides potential opportunities okay don't worry too much about what those opportunities
are but In a basic sense as a rule of THM you get an imbalance uh you don't want to be fading it you actually want to remain with the trend uh equally once the market starts to fill into to that imbalance it then tends to uh fill it out uh and we tend to see uh a little bit of two-way trade within that imbalance again I will show you that a little bit of a later stage uh in terms of where we see imbalances or why we see imbalances um note it comes from stops Okay
so sometimes you get stops in the market sometimes you get initiative from both buyers or sellers all right becoming more aggressive and sometimes it can be just simply because of noise now again I will show you in the course how to different differentiate between these three okay now note Just One Last Thing imbalances do create very key markers okay as I said obviously imbalances will show us if markets are moving quite aggressively higher as in This example imbalances will show us uh that we want to remain uh with that Trend okay so it sets a
key marker in the market equally we know that that imbalance uh equals you know a strong buy side response so by that nature once that buy side response is taken out out we do tend to get trade in the opposite direction okay and that's why we mark them that's why we utilize the footprint Tool uh to find these types of imbalances all right and where we're Going to apply this strategy is in the uh auction imbalance uh section of the course okay now Market context okay again something that not enough trade to spend time on
but very simply Market context is nothing other than the nature of the market okay what is the nature of my market just like you look outside when you go to work in the morning you say to yourself well what is the day like okay is it going to be warm is it going to be cold is it going to be windy Is it going to be sunny okay and you make necessary adjustments you take an umbrella you take some shades uh you take a jersey or you don't right there's no different in the market yet
we don't you know we don't look at the market context enough okay so what are some of the basic you know proponents of Market context well first and foremost is volume okay now you need to know what what is your market doing at this point in time is it showing high volume is it Showing low volume is it showing high volume at highs a days is it showing low volume at lows of days okay so you need to analyze the market in terms of where volume is coming in then flow Dynamics okay how's the market
flowing a lot of the time you know we look at a market and there's one big green day one big Trend and we assume the market just went in a straight line okay but if you go and look at it and you actually go and drill it down and look at the footprints It might be something like this where the market rarely has a horrible Trend okay simply because the flow Dynamics uh at that present time uh are not ideal all right then again in terms of auction Dynamics very similar how are buyers and sellers
responding in other words is the market auctioning up and we get a bit of two-way trade and auctioning up and two-way trade and auctioning up uh or is it again just auctioning deep retracement auctioning uh shallow Retracement auctioning deep retracement etc etc okay so what are the auction Dynamics like how are the buyers and sellers auctioning with one another are we seeing initiative are we seeing responsive right then volatility okay again not something we've seen a great deal of uh you know in in 2017 uh but markets do open up sometimes all right now when
markets are more volatile some strategies are going to work better right you're going to have to execute Slightly different when there's volatility on the flip side when there's low volatility we have to be more patient all right we can't afford to pay up in terms of prices so we become more passive in our execution okay now the other thing we need to determine is are our markets being driven uh by technicals in which case you know people are price sensitive right or are they being driven by flow okay now in flow Dynamics uh what we
tend to see is the Market doesn't really care much for technicals it just tends to do whatever it wants okay uh or are they being driven by fundamentals okay for markets being driven by fundamentals you're going to see a very trendy type moves and very aggressive type moves uh where the Market's trying to repic itself okay so it's so important to be able to differentiate uh between you know is the market driven by technicals flows or fundamentals right then is there Trend Or no Trend in the market and and we know why that's important because
we spoke about this principle a little bit earlier on okay so where we going to apply this concept of Market context is throughout every single uh you know one of the strategies that we can observe okay now the next principle is high and low volume okay something that's significantly important remember it's not just high and low volume it's relative high and low volume now if you Want to get good at this you're going to have to start marking down certain things in other words every single day you need to say to yourself in my market
what was the highest volume traded on a rotation what was the lowest volume Trad on a rotation now where I find uh you know again the certain charts to be very useful is I like to use color lines so let's say this was the volume histogram uh of the last couple of weeks etc etc I like to put a nice marker uh at certain Volume so that I can see when a market is trading relatively high volume versus relatively low volume now with a charting package you obviously can do that um so again you know
it's important not just to understand what high and low volume is but be able to know what relatively high and low volume is now note volume is a function of business activity and most people don't know this okay volume simply tells us there's more participation taking place now note Unfortunately as a day trader in a speculative Trader we always tend to assume that all activity is speculative okay it isn't in fact very little trade in the markets is speculative in nature most of it tends to be some form of hedge some form of spread okay
so by that very definition remember someone who's speculating or speculative in nature right tends to be uh you know very focused on price and manages risk very specifically equally they execute Very specifically compared to someone who say less price sensitive uh or hedging all right they're just simply hedging out of position so they're not too concerned about price now one of the most important things to understand is where is it that business activity is taking place in other words where is the high and low volume coming in right that's the important thing and the most
important thing is to say to yourself why why why why is there high volume Here why is low volume here right one of the things you're going to learn when we talk about you know breakout strategies is that what you need to see is I want to see high volume on the breakout why because high volume shows me a lot of participation now by the definition of a breakout a breakout means that we're seeing not just buyers buying through highs but we're also seeing sellers get out of their short positions okay so if everyone is
buying there should be a High amount of business activity and we should see how high volume so if we don't we got to say why why why all right now as a rule of thumb again a rule of thumb high volume tends to ACC company Trend okay low volume tends to a company distribution now uh one of the most important things is don't fade divergences okay one of the one of the again these Hocus Pocus things that they teach you in these very Elementary Courses this idea of you know when there's Divergence fade I.E markets
are trending but they're trending on on lower volume okay now what I am going to say to you is a market is trending because it's trying to find price okay it's trying to it's in a a discovery mode of finding price all right now when a market is trying to find price it can keep finding that price until such a point that someone is willing to sell it okay and we don't know what that point Is right so we can't suddenly speculate that just because volume is going lower that you know it might be ready
to turn around okay so so important don't fade divergences however OB observe the outlier okay so observe when that Divergence exists make a note of it and I will show you at some point what you can look at on the footprint to trade these sorts of divergences okay never fade flow okay basic rule of thumb we spoke about that in the trend principle Don't fade the flows why because they tend to take a long time to turn around uh and can be very costly right go with the flow now note relative volume is Paramount to
interpretation I've explained that and in terms so where we're going to apply this we're going to apply this everywhere okay the principle of high and low volume is going to be applied throughout now in terms of the basic example I just want to show you the relative shifts we can see really Really low volume here uh as you can see nice light colors uh showing us that relative low volume compared to the rest of the session we then suddenly get quite a nice pickup dark colors illustrating that real pickup in in the change in Delta
equally we can also see a relatively big pickup in terms of the volume now in terms of relative uh you know you can see that the shift is from 832 in this rotation to suddenly uh 1,893 so a real aggressive shift in the Relative change of volume now with that in mind just keep note okay I showed you two types of uh footprint rotations one is time based okay and the other one is rotation based now so important make a note to this if you are setting your footprint charts to time based you can then
look at these metrics on a relative basis why because you comparing Apple a with apple a okay if these however are rotations you cannot compare volume on a relative term why because you're Comparing Apple a with apple b okay so so important when you're dealing with rotations the relative term of volume and Delta isn't as important uh whereas when you uh referring to time the relative changes are a lot more important okay and again as you'll see I will explain to and I will show you within each one of the strategies when's it better to
use either a rotation uh or either a time and you'll understand why uh it's better to use a rotation or time In the various strategies okay now um the next principle we're going to focus on is volatility again uh volatility does not mean Trend okay that's the biggest mistake uh so many people make it does do not mean Trend okay volatility is simply A variation around a mean so if that's my mean my average price volatility is just telling me that if this is what it normally does and it suddenly starts doing that the market
is now more volatile now one of the Greatest tools for that is Ballinger bands it shows us that shift in volatility okay it doesn't give us a trade opportunity it just shows us the market volatility has picked up okay so like I said volatility does not imply volume okay so just because a Market's more volatile doesn't mean mean there's going to be more volume in theory there should be why because like we said when price moves very far from you know or or when prices break out and become Imbalanced then we should see a pickup
in volume so as a rule of thumb okay when we have volatility in an imbalanced Market okay let me erase this so when we have volatil and imbalance Market you're going to see a high amount of volume when we have volatility in a balanced Market we can still see relatively low volume okay and that's the key where is that volatility occurring and that's why we talk you know we spoke about the Principle of you know trade location or Market context okay because the context of the market is crucial to understanding where we could see volatility
and where we could see higher or lower volume okay so why does volatility occur well it's very simple the participation changes okay so it's very simple as a basic example let's say it's 130 non-farm payrolls we know it's a relatively large data piece what happens well the entire Or order book disappears okay why well because no one wants to take the risk so the participation changing simply creates more volatility once the number comes out obviously all those uh you know automated programs come in first then maybe we see the flows from the big institutions and
that's what's creating the volatility it's the change in nature of participants coming in and out of the market okay now obviously you know we tend to see uh pick up in volatility When there's big risk events we tend to see volatility when maybe markets move uh Beyond certain price points okay so again it's so important to understand if a market breaks out of maybe a 5year uh resistance point or or high uh of course there is potential for higher volatility why because the nature of participants are changing okay now note um the most important thing
is to identify those potential triggers like I said to you if we have a 5year high uh you know there Is potential for a shift in volatility so we want to be prepared for that shift uh and ultimately make sure that we apply the applicable strategies when we see that shift in volatility okay some of the key places you will see pickups in volatility obviously when we have key Central Bank decisions or key economic data uh when markets Gap open either higher or lower or when we see potential stop runs in various markets okay now
just to illustrate to you uh you know a Good example of volatility uh this is the gold market quite recently uh and what we can see is you know we had a a real good selloff in the market it sold off almost a good 50 ticks uh and again sucked in a lot of participants we can see the volume picked up the Delta picked up um you know and more importantly we had quite a strong positive Delta on the day reflecting maybe more buy side positioning uh and all of a sudden the market just reversed
On a dime okay ultimately we can see also look at the number of imbalances here okay lots of imbalances going through the market uh you know when it was showing us potential for short side trades right the market then obviously got or stopped out anyone short maybe got a few people long and then reversed in the opposite direction again okay so real volatility but note this volatility doesn't occur outside of a range it actually occurs in a relatively balanced Market okay so that's kind of why I wanted to show you this chart volatility doesn't necessarily
have to come in the form uh of of inside the previous day uh or imbalanced markets it can also be in uh balanced and imbalanced okay um next principle is initiative and responsive price action so I'm going to go through this with you I'm going to explain this again uh and I'm going to talk about this in terms of obviously orderflow Dynamics okay so Orderflow Dynamics is simply just Trend volume and Delta now initiative is where buyers or sellers step in and they ini iate the price to move in One Direction okay why do they
do this well let's use a very practical example Goldman Sachs okay they get an order early on on a Monday morning and some pension fund wants Goldman Sachs to execute 10,000 Lots okay now Goldman Sachs has to execute that in the most efficient manner possible right now one of two Things can happen Goldman Sachs enters the market they begin the process of buying now if someone is willing to sell and respond to Goldman Sachs provide Goldman Sachs with liquidity right then what's likely to happen is the market is likely to buy until they find that
liquidity in which case we start to see the market moves sideways however once that liquidity Runs Out Goldman stack still has to finish that order so they continue the process of buying okay and Again they'll go in Search and they'll keep buying until they find the necessary liquidity now what can happen sometimes is those orders can simply be met straight away with the liquidity and we get something like this so we get the market coming up and it gets hit back down comes up gets hit back down comes back and so forth and so forth
now in this example this is perfect for Goldman Sachs why because they're not having to Move prices too far and they're getting their fill relatively easily sometimes however what happens is Goldman Sachs can't even get any liquidity and the markets very quickly navigate higher okay and this is all it is initiative is just simply an order being initi initiated the market markets are initiating some sort of a move uh whether that's an order whether that's a break of a key level it's initiative okay buyers are taking the initiative to Move prices higher or sellers are
taking the initiative to move prices lower now as prices move up and down people are going to respond to those prices okay and they're going to respond for a number of reasons maybe they feel it's discounted premium uh maybe they feel the Market's gone too far maybe some short-term strategies maybe some hedging okay but as prices move we get responsive type behavior all right now the three General types of price Patterns you're going to see is the first one initiative responsive initiative the second is just simply responsive responsive and the third is initiative initiative now
before I showed it you in the footprint I'm going to illustrate it for you so initiative responsive initiative is simply initiative taken the market responds to the higher price and we initiate again and respond and initiate okay that's the first type the second type is respon Responsive so the market moves up and simply we see response from sellers moves down we see response from buyers moves up moves down moves up now what's the difference between the first and the second well in this example what's happening is that as price is moving up the buyers are
backing out of those Longs and selling and equally the sellers are responding to the high so the first thing is as price comes up we run into sellers who Are responding and then obviously the buyers take their profit and we move move back down same thing happens when we get to the low we first run into responsive buyers and once those responsive buyers start to buy the market up those sellers then to take profit and the market moves back up and so forth and so forth so the nature of price action in terms of responsive
responsive is very different and unique to that of initiative responsive Initiative now the third type uh which is one of the most aggressive which is what I Illustrated to you uh in the uh in the very strong V reversal inverse V reversal is where we get initiative taken and initiative in the opposite direction okay or likewise initiative and initiative now this is one of the strongest types of orderflow price action you can see and I will show you an example of this now in the next slide okay so what we can see uh is obviously
On the first slide here we can see again a great deal of initiative taken the market runs into that liquidity okay so this is uh the initiative uh initiative we could see the market runs into that liquidity uh and then straight away the sellers step it up and they sell back down okay and we can see those sellers stepping it up why because initially we get the response from sellers okay they absorb the market where and we can see obviously that very dark color scheming And then the market starts to sell back down now note
you if you look at these couple of prices look what the buyers are doing relative to the sellers in other words the sellers are selling a lot lot more than what the buyers are buying okay and that's the key is that we can see a great deal more initiative being taken from the sellers then being taken from the buyers now you say to yourself well why are there so many buyers there well it's very simple when The markets come up such a long way in an initiative fashion there's going to be a lot of shorts
that are caught offside okay so that that uh very aggressive uh buying there or bids being hit by the sellers that's simply just what we call resist residual uh buyers okay it's not necessarily uh people actually physically buying the market now one of the most important things and I will show you this a number of times in this V reversal is this secondary Section yeah okay and this is the real clue to an initiative initiative so initially the market comes up it runs into responsive sellers those sellers initiate back down but what we always see
is we always get that residual first section and then the key is once that resid ual section is done we then get the second bit of initiative and that's what you're seeing in that square block there you can see how we rarely seeing some initiative being taken from the Sellers uh and that initiative a lot of the time will also be seen as imbalances okay so we'll see some real sell-side imbalances coming uh when we get initiative taken from the sellers okay now again I'm going to illustrate this for you a lot more time so
don't worry um you know you will start to get the hang of it okay so again he has another very very good good example of um you know initiative initiative and again what we can see Market comes up nice and aggressively the first thing we see is responsive type price action so we can see right up here real aggressive absorption but note again look at the left side versus the right side note how much more selling is taking place than buying okay so we're seeing real initiative selling taking place at the high once that secondary
uh buying is done or in other words they've been cleared out notice what we get we get real initiative being taken from the Sellers again notice how the sellers are hitting every one of the bids uh versus buyers doing absolutely nothing okay and obviously in terms of price response we get that very very beautiful inverse vshape okay now in terms of uh just volume and all that again like I said this is one of the highest volume uh you know principles you're going to see we do tend to see a very very large pickup in
volume but also we tend to see a large pickup in volume on the reverse Side okay that is the key to an initiative it is initiative high volume in the One Direction and again in the opposite direction now very traditionally and typically as a rule of thumb any Delta that accumulates on the way up will effectively unwind on the way down okay now if you look at the right side example this is more a bit of a a sort of a response of responsive so what we can see is the market comes down uh we
see lower prices being absorbed uh Market then extends a little bit but again we just see a lot of absorption um uh you know a lot of two-way trade someone accumulating the market once that accumulation taken place note we get a little bit of a push back higher the market runs into higher prices we then get a gain the consolidation taking place at the high a lot of absorption uh and the market then begins responding to those higher prices the market then obviously rotates back lower and again We see those buyers responding at the lower
prices okay and that's the real key difference uh is as the market comes down we watch for that response being taken uh from uh we watch for the response being taken from uh you know the buyers they start passively buying the market once it starts to go back up the sellers take profit and that's what creates that rotation to the upside okay so that's our basic uh you know understanding of initiative uh and Responsive price action right now our last two little principles of uh this part A of unit 3 uh high volume and low
volume errors particularly important um and in terms of high volume it's simple uh it's large relative concentration of volume very simple uh it's price areas with Dark Shades okay so if I was to show you in the chart there's a high volume error there's a high volume error there's a high volume error there's a high volume error there's a high volume Error okay now darker Shades or darker uh you know groupings of prices the more dark uh and the more volume uh the more relevant that high volume area is uh to other areas okay so
obviously we can see this is probably the most you know the two most significant areas uh relative to say this uh this example now these are simply just High participation zones okay remember we said volume equals business activity therefore high volume areas are very high participation zones Now that's important okay because we always have to ask ourself why was there so much participation taking place at this point okay what was it that brought the buyers and the sellers together to participate in this manner right and those interaction points you know we want to identify who's
taken the liquidity and who's provided now this is this is a really key thing to understand okay remember as markets are moving up someone is a taker of liquidity and Someone is a provider of liquidity right the taker is the person who's initiating who's buying the market up and as he's buying it up whoever's on the offer whether it's market makers Hedges whatever it might be they are providing the liquidity so again in terms of learning about positioning of markets uh and certain trade strategies it's important to understand who is taking the liquidity and who
is providing it okay in instances when no one's Providing it that's when we're going to see principles like trending markets okay in instances where there is uh you know both people providing and people taking that's where we're going to see more balanced consolidating type markets okay so again as we said uh the net positioning uh and the delta in the market that's quite important to understand what you'll see is when we do get these high volume areas as I suggested here you always want to pay Attention to what the Delta is doing okay why well
because as price is moving up here if there's a high degree of volume taking place but price keeps moving up we can see that there must be a lot more buyers then sellers taking place uh and that's ultimately something we want to pay attention to okay um in terms of where we going to apply the strategy absorption and auctioning hiding behind the elephant as well as the footprint Delta unwind okay now our Last strategy before we take a break um it's very simple uh it's the low volume era so this is low relative concentration of
volume and the lighter shaded areas on the chart okay uh effectively what these can be is uh you know footprint imbalances so a lot of the time low volume shaded areas can be imbalances okay now these are also low participation zones and very simply no liquidity is being provided now the question is why okay so as price is Moving up and down why is there no liquidity being provided okay in the instance where you know maybe a market is trending and no liquidity is being provided or maybe there stops there's very good reason for that
right in Balance markets you know we also need to ask ask why is there no liquidity being provided now remember a lot of the time low volume errors can be a result of stops or noise from algorithms or it can be because of aggression uh in the Execution and again we will go through these when we start to develop our strategies now low volume Errors Act as key initiative zones as well as position unwind zones and this is the key I'm going to show you I'm going to illustrate you so as we can see in
this rotation we get quite a bit of initiative taking place we can see real low volume area yeah not much volume taking place uh you know real aggression in the cell side from uh the sellers and Um ultimately this acts as a very key area why because this shows us where the positioning of the market has occurred in other words we can see the sellers have stepped up the selling around this price point uh and by that definition if it does come back Above This price point we can potentially see a bit of an unwind
of those short positions okay so where we'll apply this again in the initiative Drive the auction imbalances and the footprint Delta Unwind okay just another example there for you um again what we can well actually that's the exact same example just uh made it a little bit bigger so there you can see that low volume area uh and obviously the prices sell off uh and then that acts as a very good uh uh resistance area for the market okay so this is the end of unit 3 part a um now I know this is an
information overload this was an hour video hour and A bit video so I know a lot of it might be uh you know might seem a little bit uh too much take a break okay uh if if this is all you do for today that's fine take the break come back when you refreshed and energized okay the principles is one of the most important units uh for you to understand before you start getting into the strategies okay so take your time um now note you're going to see these PR principles time and time and time
again throughout The strategy section okay so don't fuss too much I'm going to go over them a lot in the strategy sections unit 6 to 15 um and what I want to suggest is once you start seeing certain strategies that you like they make sense to the risk profiling makes sense to you come back and revisit the principles okay because what you're going to find is that as you begin to understand the strategies you're going to start to understand the key principles behind that strategy okay So and then most important um guys you can read
visit this unit okay so don't worry about it you can revisit this uh on your first rest day uh which will be day uh 7 of 30 okay go take a break and I'll see you guys again for Part B