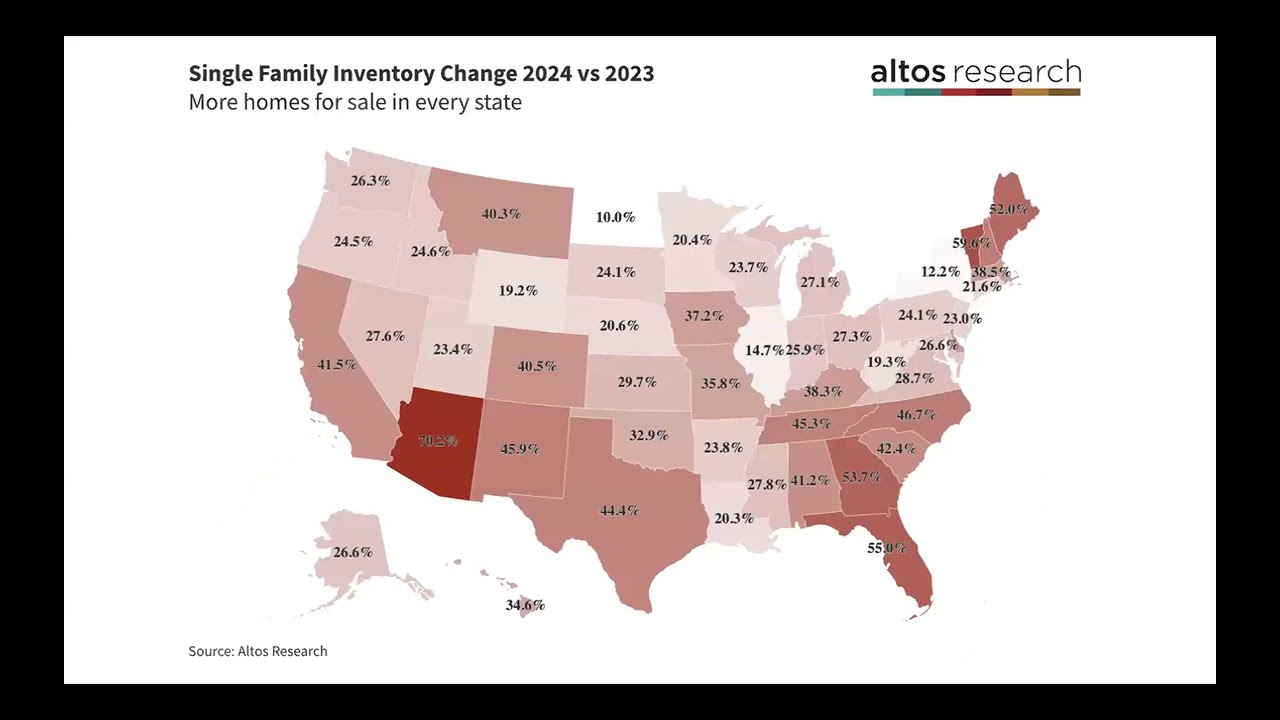
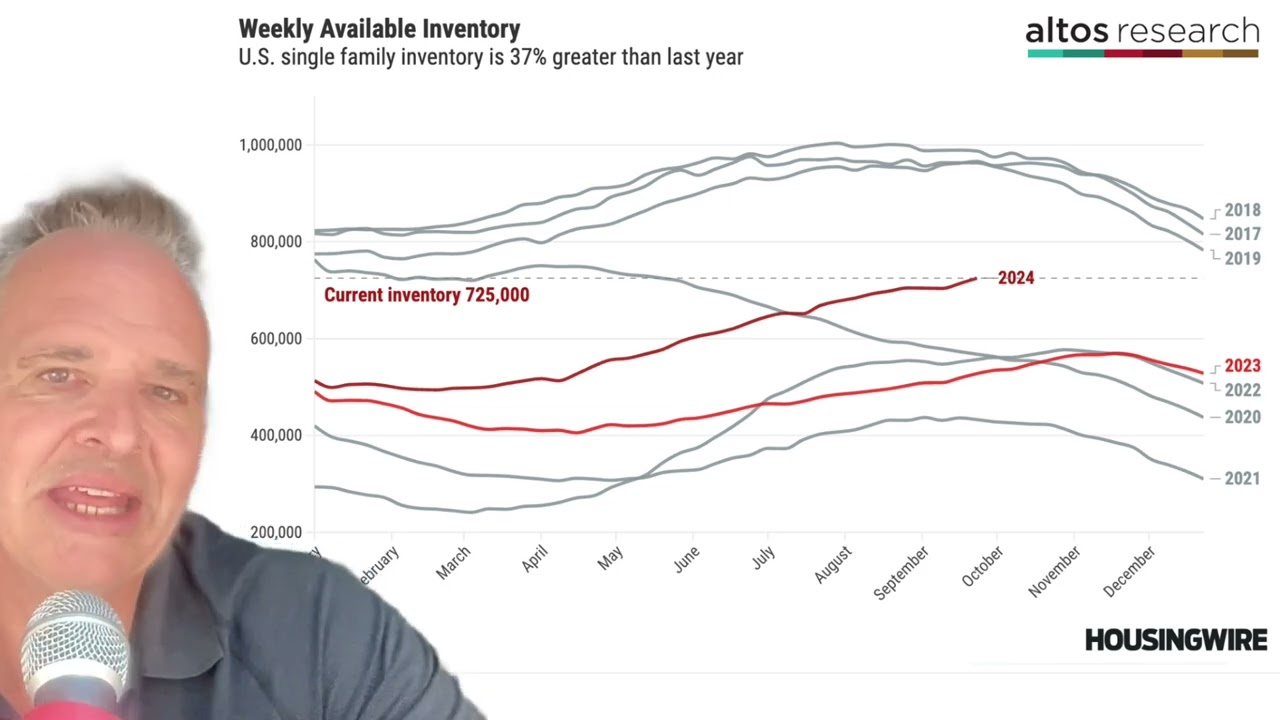
the hardest position to take in analyzing the market is one that is contrarian and bullish when everybody knows the housing market is sluggish and weak but the data shows surprising strength so that's kind of where we are right now home sales are significantly better than they were last year at this time and no one is reporting it yet because the traditional data takes so long to reach the headlines but the fact is as of this week we 14% more homes in contract pending stage now than a year ago uh the these are the homes that will generally close transaction in November and December so we'll probably hear the headlines in like December and January another tricky part of communicating this is that home sales aren't like suddenly great this isn't a strong Market it's just better better than last year and last year it really sucked so last year was super weak as mortgage rates were hitting 8% uh but they're back up to 7% now so maybe this strength is fleeting and will evaporate as we close out the year so we're going to have to keep our watch out for that to happen meanwhile the national home price signals had another positive week this week too and inventory is past Peak for the year so the momentum looks to keep the trends in the positive direction at least for now it is a time for our November monthly webinar next Thursday November 14th at 10: a. m. Pacific so we're going to review all these sales changes we're going to see if we can see uh observe consumers backing off again with surprising October jump in the cost of money we'll look at a bunch of price signals it can sound uh like a bullish housing market for the country with sales prices and up but that's not true in every local market so we'll look at those a lot of those local markets as well well at any rate these conditions change quickly and they keep surprising and that's why at Alto research we track every home for sale in the country every week all the pricing all the supply and demand all the sales all the changes in that data so that you can understand the changes in the US housing market immediately as they happen I'm Mike Simonson I'm the founder of alos research and let's take a look at the data as we're already in November 20124 so let's start with uh Supply today there are 73600 single family homes unsold on the market in the US that's a couple thousand fewer than last week and it's down again from the peak two weeks ago the unsold supply of homes on the market now has passed its peak for 2024 the inventory Peak came a month earlier than it did in 2023 so there are 29.
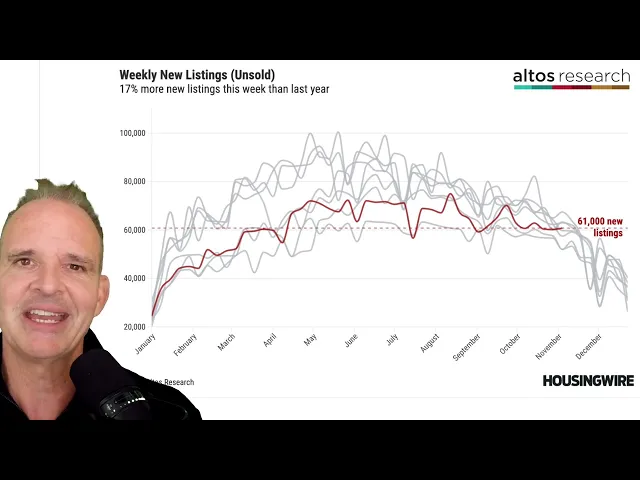
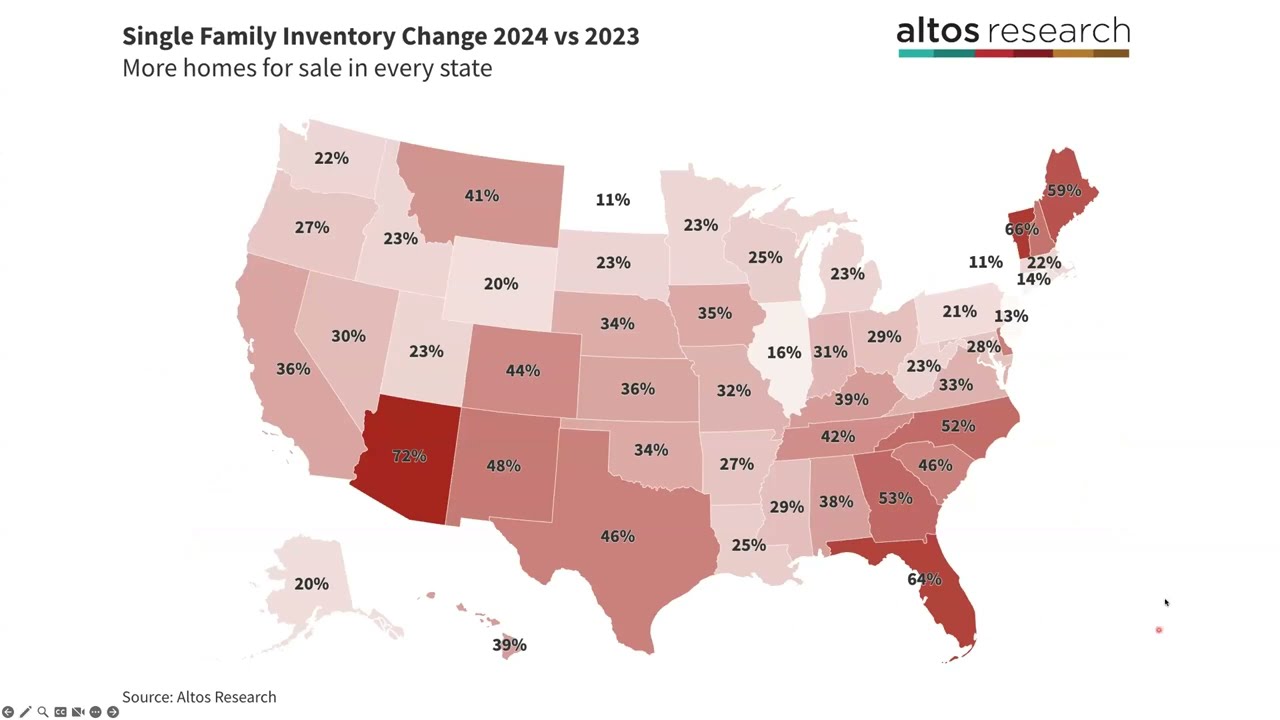
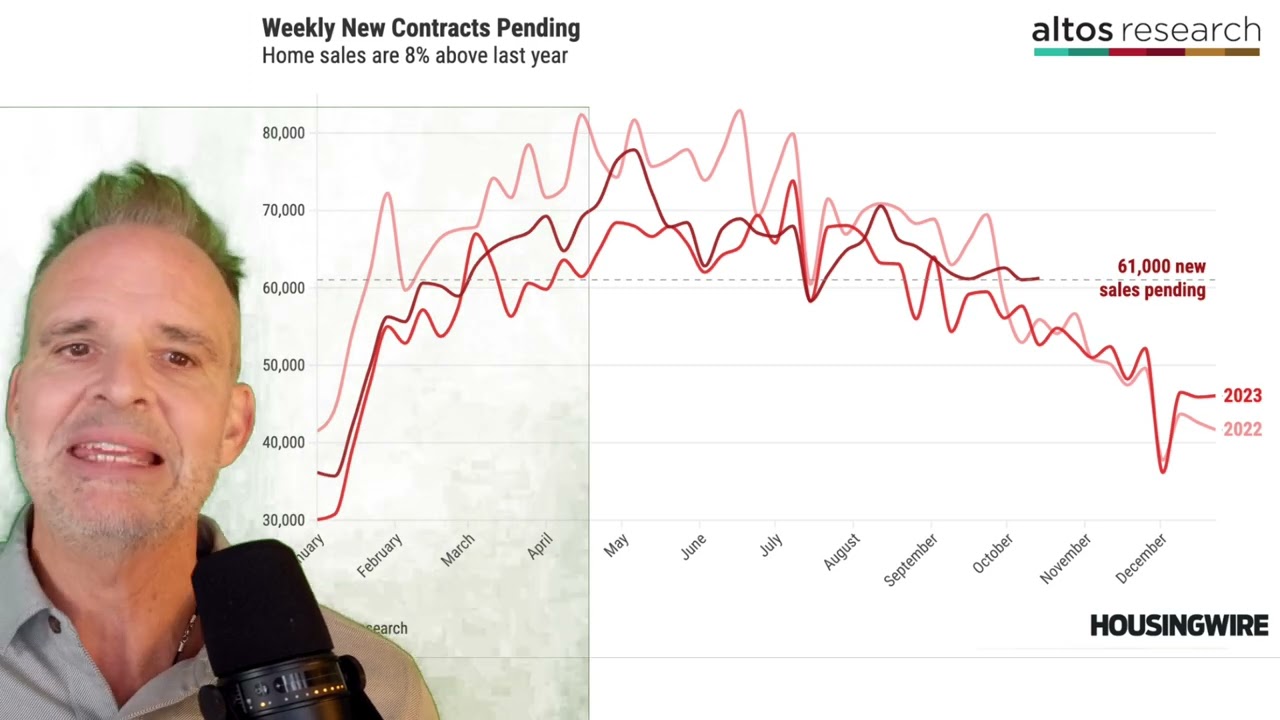
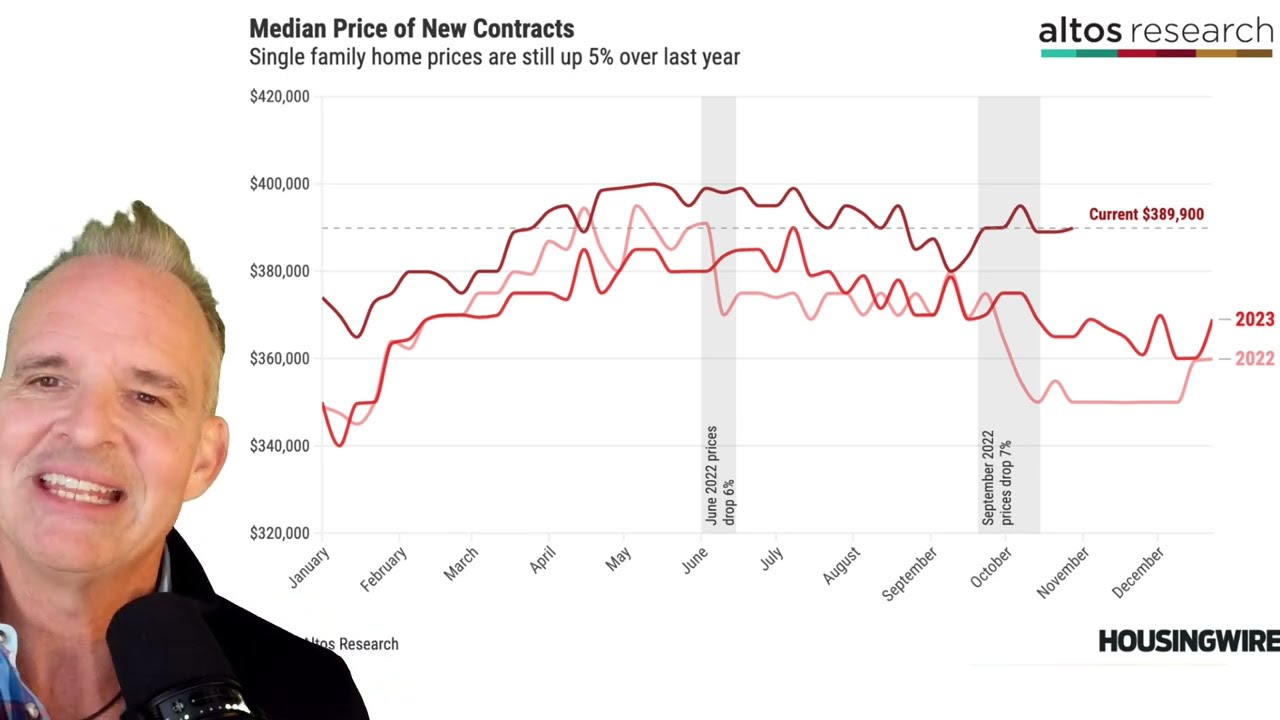
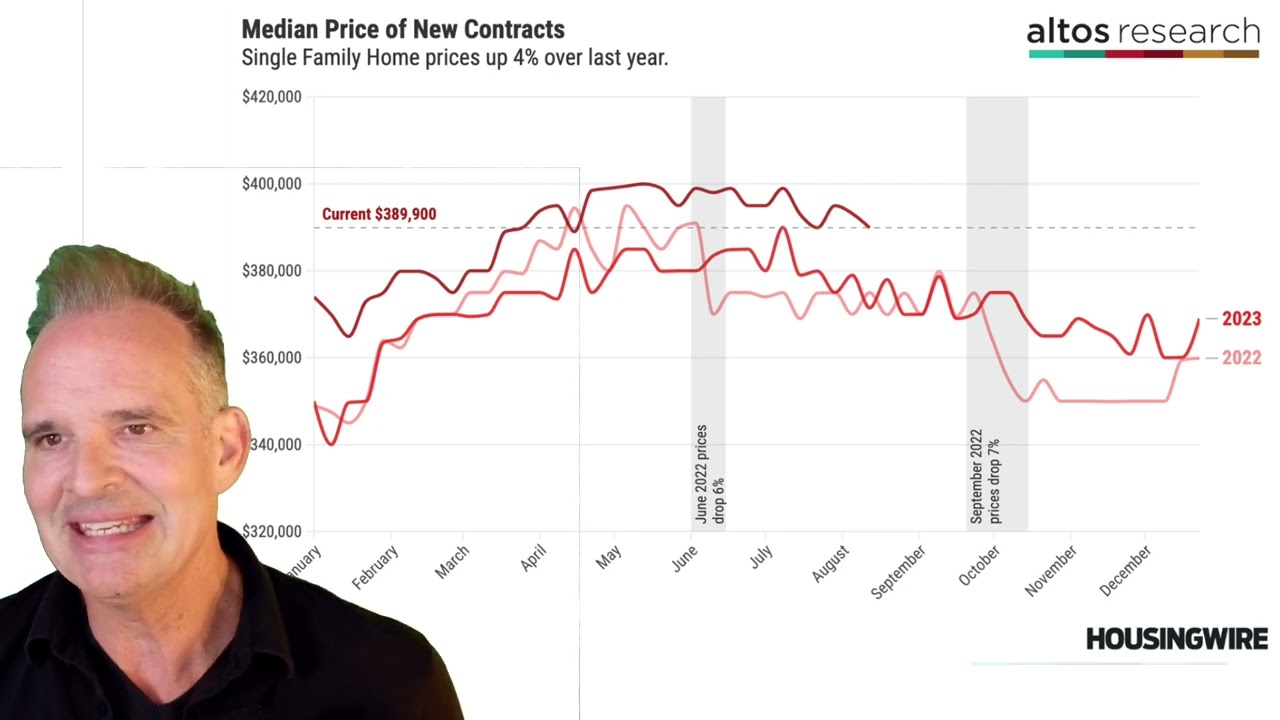
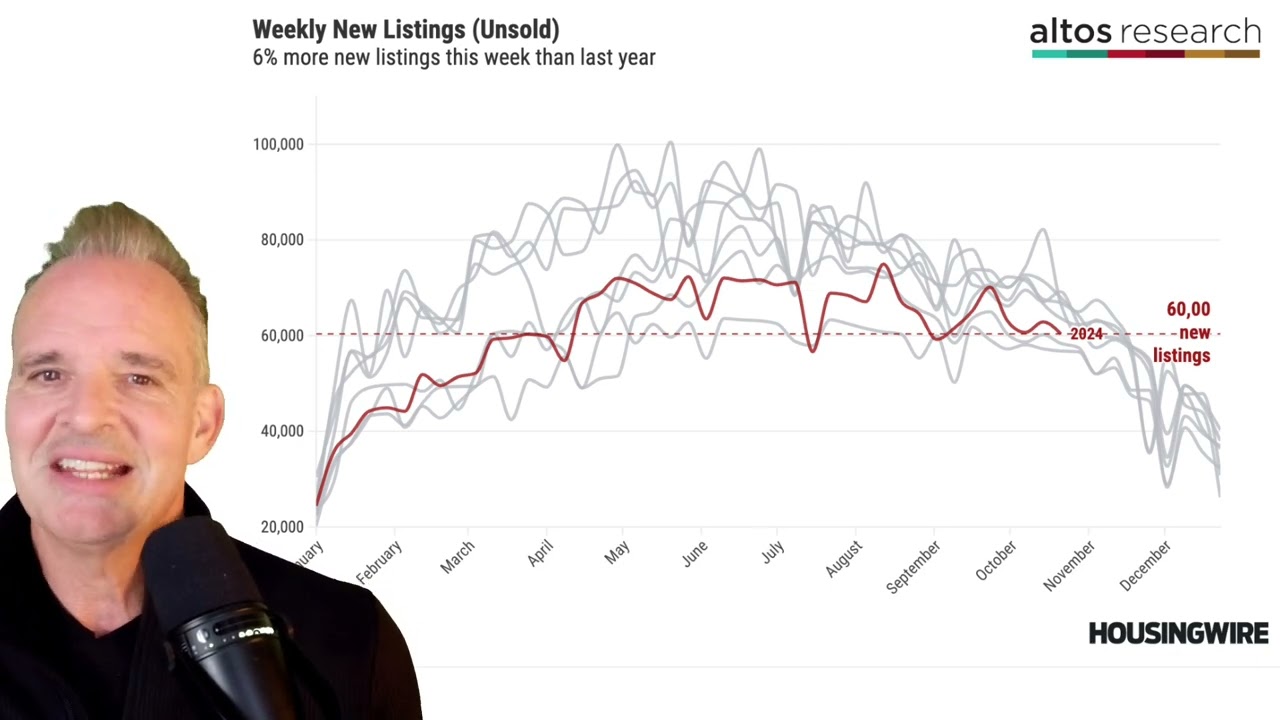
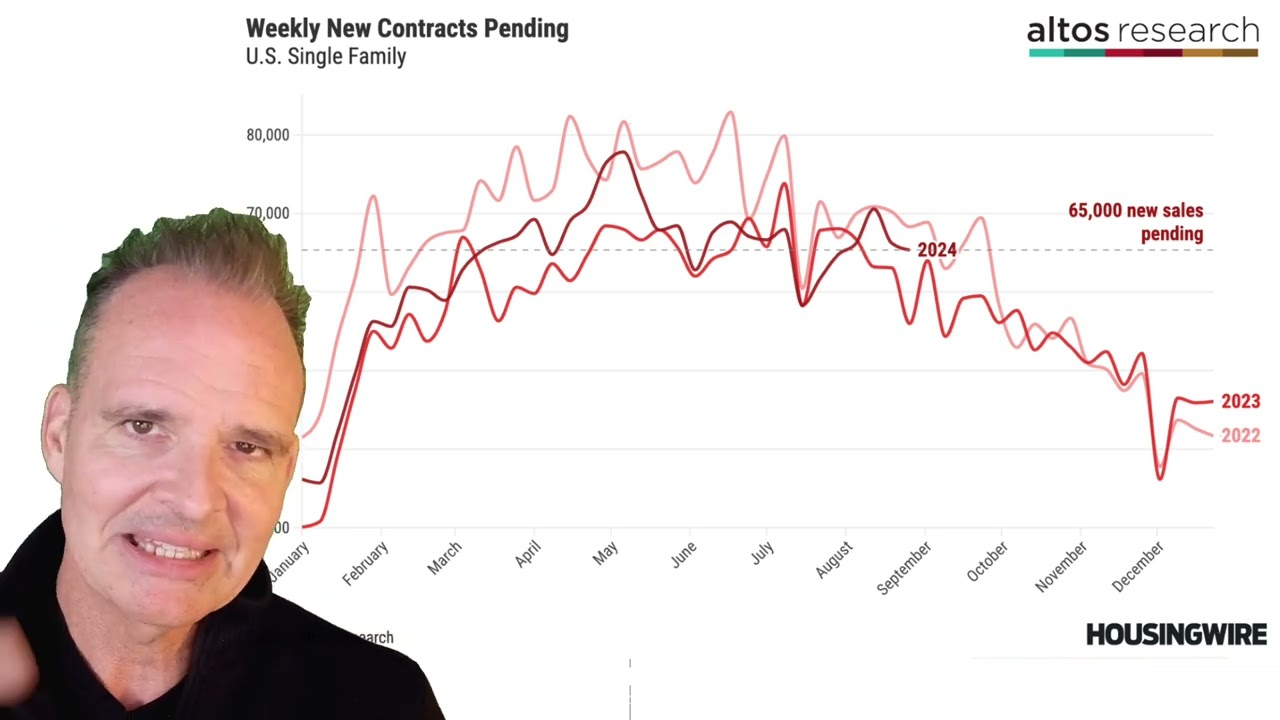
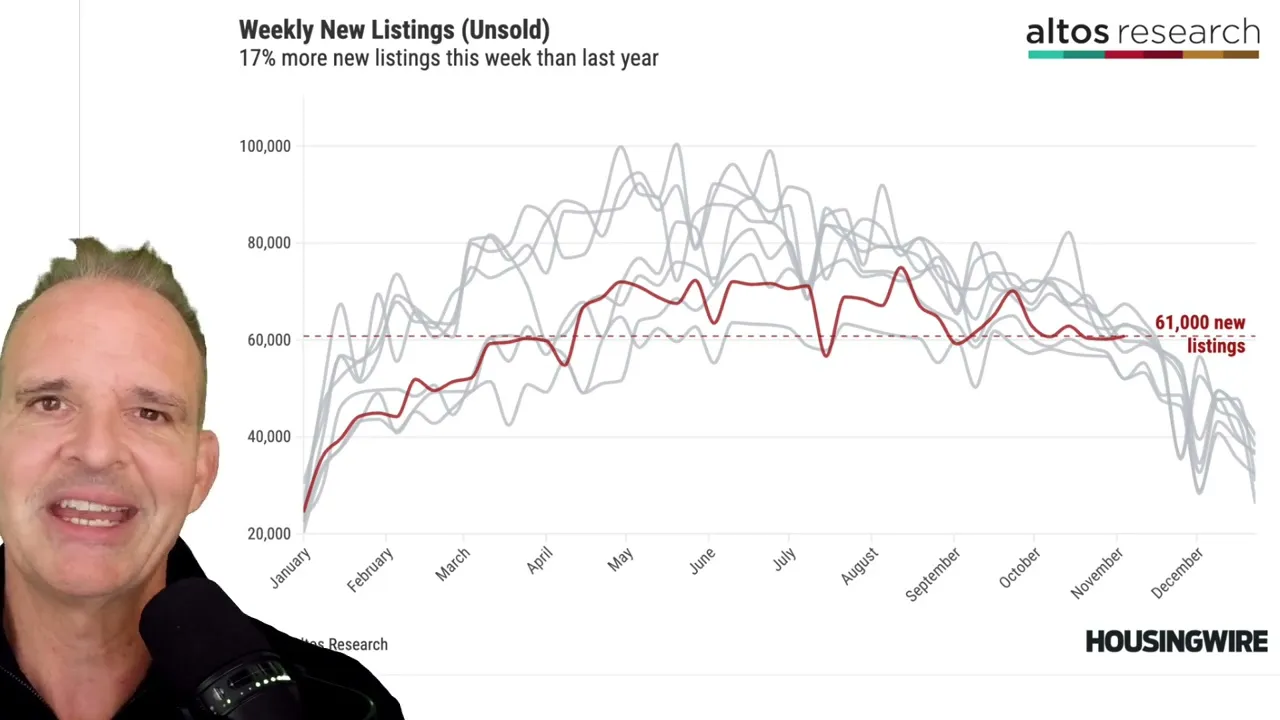
8% more homes on the market now than last year at this time remember that in September we were at 40% more homes on the market market and now we're under 30% so that's uh because in the fourth quarter of 2023 the market was grinding to a halt mortgage rates were super high inventory was building and the market is different now the uh the market peaked with almost 740,000 single family homes unsold it was a few weeks ago uh that was about 6% more than we had anticipated earlier in the year like we modeled that the peak would be more like 700k the difference is really that impact of mortgage rates staying higher for longer all the way into September and higher rates create more inventory uh while the uh there the the market peaked uh with more unsold inventory than we'd forecast the seasonal decline is now underway so that was not true last year at this time so in this chart you can compare this year's dark line to last year's bright red line you can also compare this year to the previous years like in the last decade we'd normally have maybe 900,000 single family homes unsold on the market and it would be dropping quickly in November one reason inventory can't drop quickly this year is because in much of the country like the Midwest and Northeast we don't have very many homes on the market right so we'll review this in more depth next week in the webinar but in places like Chicago barely have more homes unsold on the market than during the pandemic so it's very hard for inventory in Chicago to fall for the holidays when there's already no homes on the market so it remains to be seen if this recent spike in the cost of money in mortgage rates is going to reverse the supply Trend uh for whatever reason the trend seems to be holding forward now remember that the rule is that higher rates create more inventory and uh that will certainly be true as we roll into next spring if mortgage rates are still over 7% so fingers crossed for more affordability in 2025 rather than less there were just under 61,000 new listings unsold this week that's a touch more than last week and it's 177% more than a year ago so when you include the 9,400 immediate sales those are new listings that are sold already the total is 133% more sellers than a year ago last year at this time the market was in deep retrenchment both buyers and sellers were walking away so the new listings Volume last year was low and dropping this Market feels marginally healthier now and in fact while it's late in the year you could say that the weekly new listings are they're they're in the old normal range now many years of the last decade there would be 60 to 70,000 new listings per week in November and so we'll see if that Trend continues because consistently more sellers would signal a transition to like new market dynamics than what we've lived through for basically three full years now so what we're watching for here is whether the dark line here that that that's this year's line stays elevated in that that cluster of gray lines across the top like through the end of the year and you can see the last few years are the lowest gray lines on this chart and so we'll we'll get seasonal declines of course fewer fewer sellers each week as the year WS but if we see the path of 10 or 15% more sellers in late 2024 that would set 2025 up for some very interesting Dynamics now I shouldn't oversell this trend uh maybe this year's strong showing right now is just a reflection of the country finally getting some mellower weather it's really just really just one week sellers could dip again next week uh but maybe it's an early sign that we're witnessing the slow erosion of the lockin effect uh our homeowners tired of waiting on the sidelines for conditions to improve well that's what we want to watch for and in this chart it's that red line like Landing in the upper cluster of the gry lines rather than the lower cluster that's the transition we're watching for on the demand side the market showed a jump in new transactions just as it did a jump in new listings this week so we counted 63,000 new contracts started for single family homes this week so this may be evidence that actually the activity is a little bit of a noise some fluctuation caused by for example the Hurricanes people had deals to do but they got delayed for a few weeks and now they're getting done the key with the newly pending home sales data is that we want to keep our eyes open for conditions where sellers Are Climbing but buyers are not and this week both sellers and buyers accelerated so there are now 354,000 single family homes in the contract pending stage that's the the chart where we're showing here is the total homes in contract pending notice how this year's Line is now steadily above the last two years and we've been talking about how the 4th quarter is easy comparison compared to the last two years those years were the worst times and as I said this year feels like we're finally maybe transitioning out of the worst times one thing I find fascinating now is that even though mortgage rates have jumped back up close to 7% we haven't yet yet seen a Slowdown in that sales volume uh as rates rise and home prices stay elevated mortgage payments for a typical buyer have inched back up close to the highs from a year ago affordability is getting worse right now uh but we haven't yet seen a correlated slowdown in buyers so I don't have a great explanation for this maybe buyers are just slow to respond to Fast Change in mortgage markets but here's another data point that emerges when we examine the pending home sales in August the withdrawal rate these are the the listings that never got offers uh and are not pending the the the withdraw they're no longer for sale or withdrawn so that withdrawal rate was higher in August than in previous years and it is uh one reason that inventory didn't grow more quickly at that time if if a seller is not happy with the market condition and chooses not to sell that inventory goes down Supply is limited so in August we could see more withdrawals but it no longer appears to be that way withdrawals were climbing in the fourth quarter of 22 and 23 but they're not climbing now we will review withdrawals more closely in the webinar next week all right let's switch to home prices I've recently shared how the median price of homes in the US is staying resilient right now that uh and and how that surprised me given the obviously weak demand of the first three quarters of the year so this chart we're looking at here is the median price of the newly pending contracts for single family homes uh that and you can see that resiliency the the price is $389,900 again this week that unchanged from a week ago and is running 5 to 6% above home prices a year year ago uh home price gains in the US are about 5 to 6% over 2023 now the uh home price strength has been the most surprising development in the housing market this year and when we're looking at this is we're looking at the national average of course there are some regions where home prices are down anytime I publish the data that shows home prices up nationally there's always people in the comment sections pointing out that home prices in their neighborhood are crack cring right now so that's a legitimate anecdote to pay attention to now I'd argue that home prices aren't crashing anywhere in the country there are local markets where home prices have declined in the last two years and have not found a bottom yet some of those markets I've looked for signals of price upturns I don't find them in the webinar next Thursday November 14 we'll spend time on each of those markets we'll look for the bottom and we'll also look for condition where home prices might continue to fall in 2025 so register for that webinar and join us next week There's a link in the description below to to save your spot for the webinar November 14 price Cuts dipped again this week fewer home sellers found the need to reduce their asking prices the market is almost at the lowest level in two years at November level in two years uh like the other price measures this is super surprising to me me 39. 4% of the homes on the market have taken a price cut from the original list price next week we could be fewer that price Cuts than than either the last two years at those times 22 and 23 price Cuts were accelerating late into November as the market was weakening this year is different we use price reductions as a leading indicator for future home sales and here's what the trend says to me I see a market that stayed frozen for much more 2024 than anyone expected buyers waited on the sidelines for cheaper money that mortgage rate dip finally emerged like the little groundhog seeing a shadow in September uh and that was enough to motivate some home buyers we didn't see motivation when rates were at six and a half but when they dipped closer to six we saw the motivation uh then we also see some slow response time from buyers and sellers so the price resiliency we see now is because we shook some Demand free in September and early October but if that's the case that is rolling into 2025 we're currently positioned for weakness to start the year what if we start 2025 with mortgage rates over 7% and I think that's the key it's wild how quickly sentiment can change that as of now 2024 looks like home prices are holding steady fir nationally and inventory has peaked for the year but what if econom IC news or the election drives mortgage rates back over 8% 7% uh so potential home buyers and sellers need to hear the data directly from you so they know how to act if you need to advise people in the real estate market you should join us at elos go to elos research.