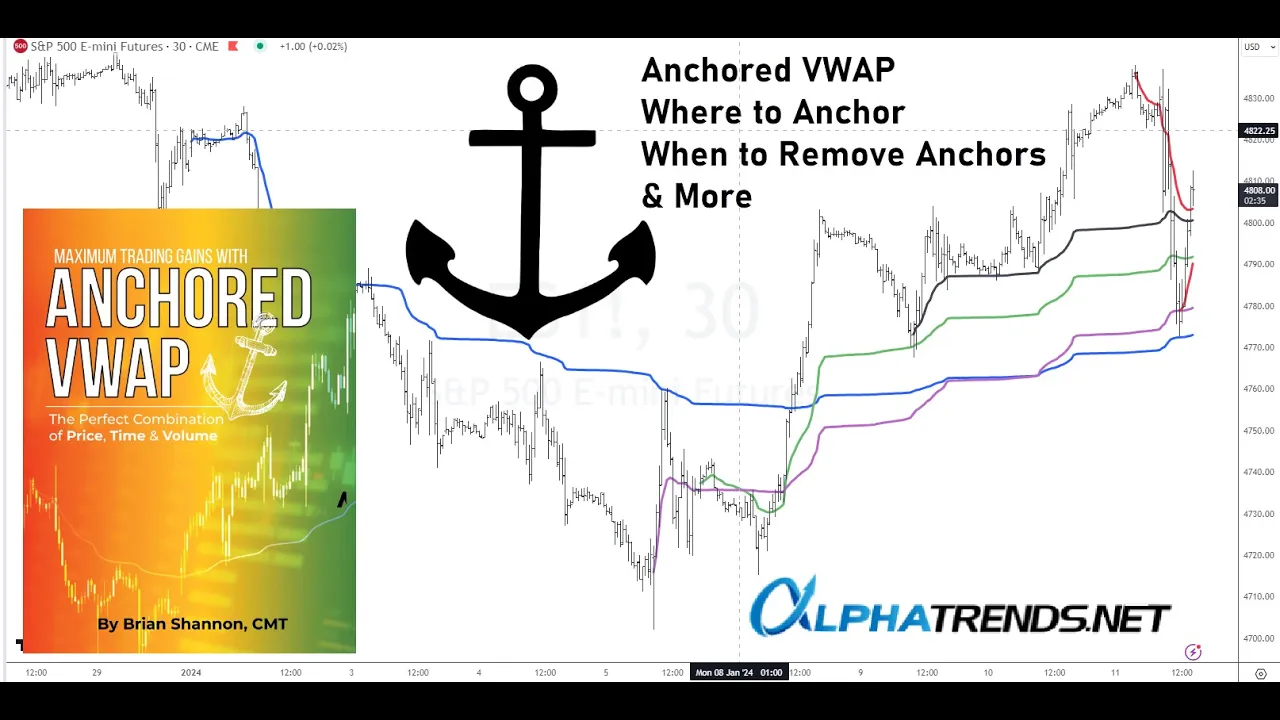
hey everybody Brian Shannon here today is Thursday the 11th of January let's talk a moment about where to set an anchor uh for our analysis we're looking to start here with a 30 minute time frame of the S&P 500 futures the es the e- mini began trading on Monday the first day of the year uh equities of course only started trading on Tuesday this is where the first bets on the S&P 500 were made that is the anchor from the very first trade of the year when we saw that happen I was first using the
anchored vwap from the beginning of the year on a one minute chart because you couldn't find Value looking at a 30-minute time frame with only 2 minutes into the trading year so as time progresses I've moved over to a 30 minute time frame and you can see the value of this year-to dat anchored volume weighted average price the sellers took control and we saw a pattern of lower highs and lower lows with that anchored volume weighted average price providing resistance until last week where it popped up through that level now looking at it we've seen
today we've pulled back all the way into that year-to dat anchored vwap and the buyers were there to defend it so what was once prior resistance now seems to have become support So once this Market started to Rally like that I figured well that is the lowest low we had this high that took out that high we had a higher low so this was the low of the year so far and still is so I put an anchor on that I want to see how the market responds to it it doesn't mean I'm automatically going
to buy pullbacks to that level but it's as I always say a level of interest and same is true of course for the year-to-date anchored volume weighted average price this green one I put on the chart on Sunday evening the first trade of the week for the S&P futures so Sunday evening when the uh S&P 500 futures open the sellers were in control until they regained control for the the week right here at this point now the week had only just begun of course and the equities weren't even open yet this is uh you know
just prior to the equities open uh on the New York Stock Exchange 9:30 a.m. eastern time what we have now is that's where that began and we saw the pullback I did not buy over in here I mentioned on Twitter you know here's the level of Interest I had purchased as the market rallied from that level I didn't try to buy as touched that level because just like this time this morning it might have sliced right through that instead I look at it as a level of interest and when it hits that level of Interest
I switch to a very short-term time frame to look for evidence that maybe I'm going to purchase it now if you go back to the charts I had posted I had also put a anchor at that point right here on that Peak now I had had it colored red so let's just change the color right here and this is uh trading view they allow for futures uh trade um uh charts that is um we saw that the market rallied off of this anchor and straight up through that level so this is where the new momentum
campaign began that's what I refer to as a handoff the handoff of the momentum occurred back up into the upside here at this point and then it held above that level on tests now that first in second day yesterday we saw a powerful move beyond that range finally and that's where the buyers re gain control I took this anchor off because this morning it was in the same place as the anchor from that low and I wanted to keep my chart simple so when do I take an anchor off well once it gets in the
way of your analysis or no longer has any value so we came down to the year-to-date anchor and what do I do there do I look do I buy right at that level you can look at it and say well you should have and hindsight is always perfect to say that instead what I do is I look at a very short-term time frame I look at the one minute chart and you can see it didn't actually touch right there instead it bounced a little bit I had made a purchase over here I've sold most of
it right now for two reasons one we're up against the anchor from that handoff point that black one and this is from the high that it's made uh here just uh yesterday and that high yesterday is of course the high for the year so right now the purple is the year to dat low point and this is the year-to DAT High Point point I'm going to keep that on there as a level of reference to say since that prior momentum campaign began right over here at that handoff now we're up against that level we have
three days worth of people who purchased in this area who might be looking to break even we have people from the absolute High who now it's getting up to that average point I look at this and say these two anchor points come together here's a potential level of Supply that's why I'm out of most of my long right now I have a little bit in case we continue to Rally up through there and just completely ignore these I don't look at as a place to necessarily sell all my position but to say here's what could
happen in here so now what I would prefer to see happen is we pull back down a little bit maybe towards 4780 rally back up create another higher low at maybe 4790 in the coming day and then resume the upside these are the scenarios you have to outline in your head I will add new anchor most likely if the buyers can maintain control I think that you want to add an anchor here and there perhaps we see that we get a pull back down towards that level and then we bounce then we rally up pull
back towards it and bounce again then the buyers can take control these aren't predictions this is how I look at the market and try to anticipate what its movement will be we're in a primary uptrend on the longer term time frames it's the buyer's game to lose so when we see these quick sell-offs I like to get stopped out of my long positions reestablish down here see if the market will allow me to hold that small piece that I hold right have right now and it's up to the market to tell me whether or not
to hold hope that was helpful uh you can always of course read more about it in my book maximum trading gains with anchored vwap