hello and welcome to biostat squid in my previous video I explained the main Concepts behind gsea so if you're not familiar with this type of pathway enrichment analysis method you might want to check it out first in this video I will focus on how to interpret the results from gsea and to interpret the plots let's Dive In so there are four key statistics that Gene session enrichment analysis will give you so we have the enrichment score or yes the normalized enrichment score or NES the false Discovery rate FDR and the nominal p-value we will go
through each one of them and explain how they relate to this beautiful gsea plot now slots always remind me of mountains and in a way Gene set enrichment analysis is a bit like hiking for each gene set or pathway you test you go for a hike but there's a trick you don't know how tough your hike is going to be in other words the shape of the mountain will depend on the gene session you're testing and your list of ranked genes and contrary to actual hiking you want the mountain to be as tall as possible
okay so we said that for each gene set you will go through your list of ranked genes if the gene is not part of that Gene says you go down the hill if the gene is part of the gene set you go up and this is how gsea calculates the running statistic as it goes down your ranked list think of it as you tracking the altitude while you hike basically this running statistic increases when a Genus in the gene set and decreases when it is not how much you go up or down actually depends on
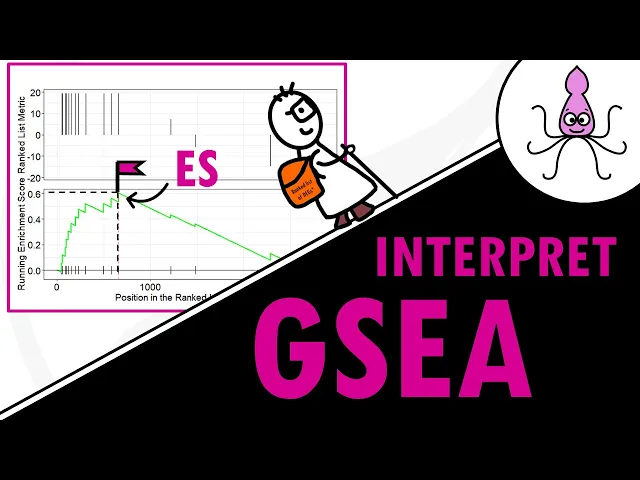
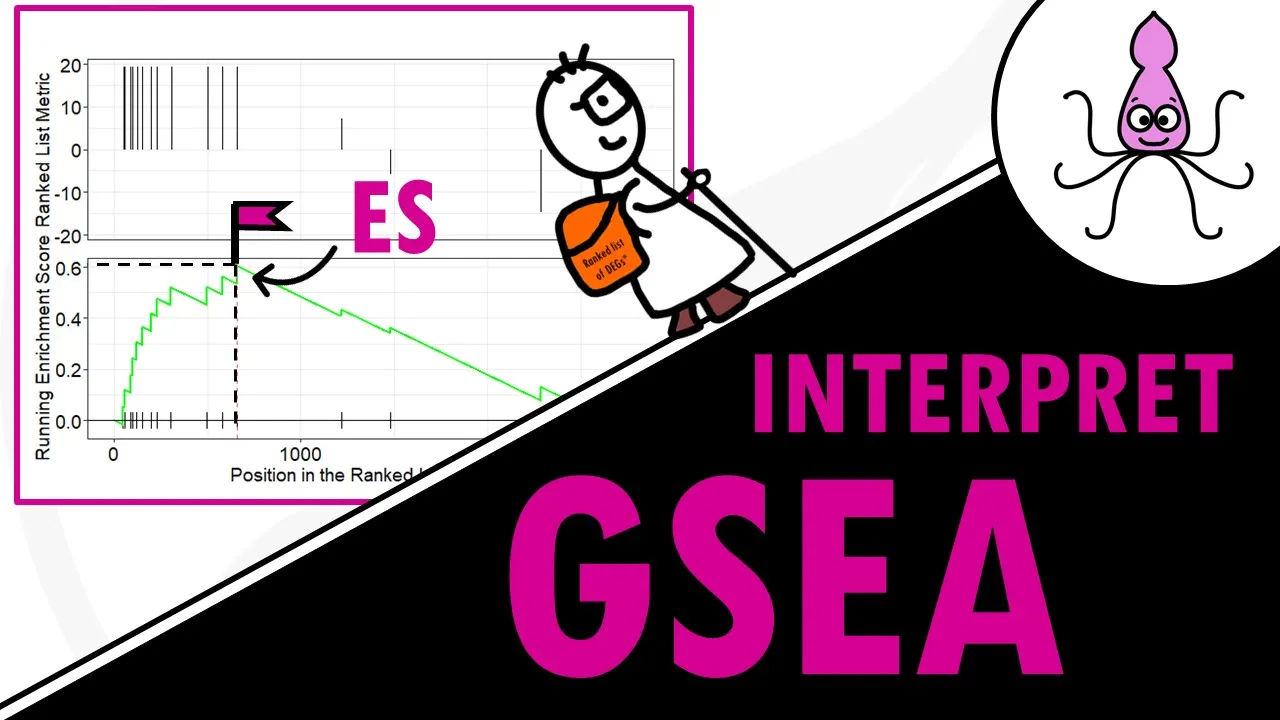
your differential gene expression analysis results that is also why the ranked list is very important where genes are ordered by for example full change with larger positive or negative fold changes will result in larger increases or decreases than genes with lower ranking now once we reach the last of our genes in our Gene list we have the results for that specific pathway looks familiar it's basically our pretty enrichment score plot the enrichment score plot shows how this running statistic changes as we walk down the ranked list but what's important is the maximum altitude you reached
that is the enrichment score or ES well technically the enrichment score for a gene set is the maximum deviation from zero basically the score furthest from zero so if zero is C Level let's say the enrichment score for a particular pathway can be the peak of the mountain or a very deep valley Jean sets with a distinct Peak at the beginning or the end of the ranked list are generally the most interesting the enrichment score tells you how much the gene set is over represented at the top or the bottom of A ranked list of
genes so a positive enrichment score indicates Gene set enrichment at the top of the ranked list a negative enrichment score indicates Gene set enrichment at the bottom of the ranked list now it very much depends on what your ranked list actually shows but for example you could place op Regulators significant genes at the top and down regulated significant genes at the bottom this way the enrichment score you obtain for each pathway will tell you if that pathway is upregulated in for example your tumor cells or down Regulators in tumor cells nice now the upper part
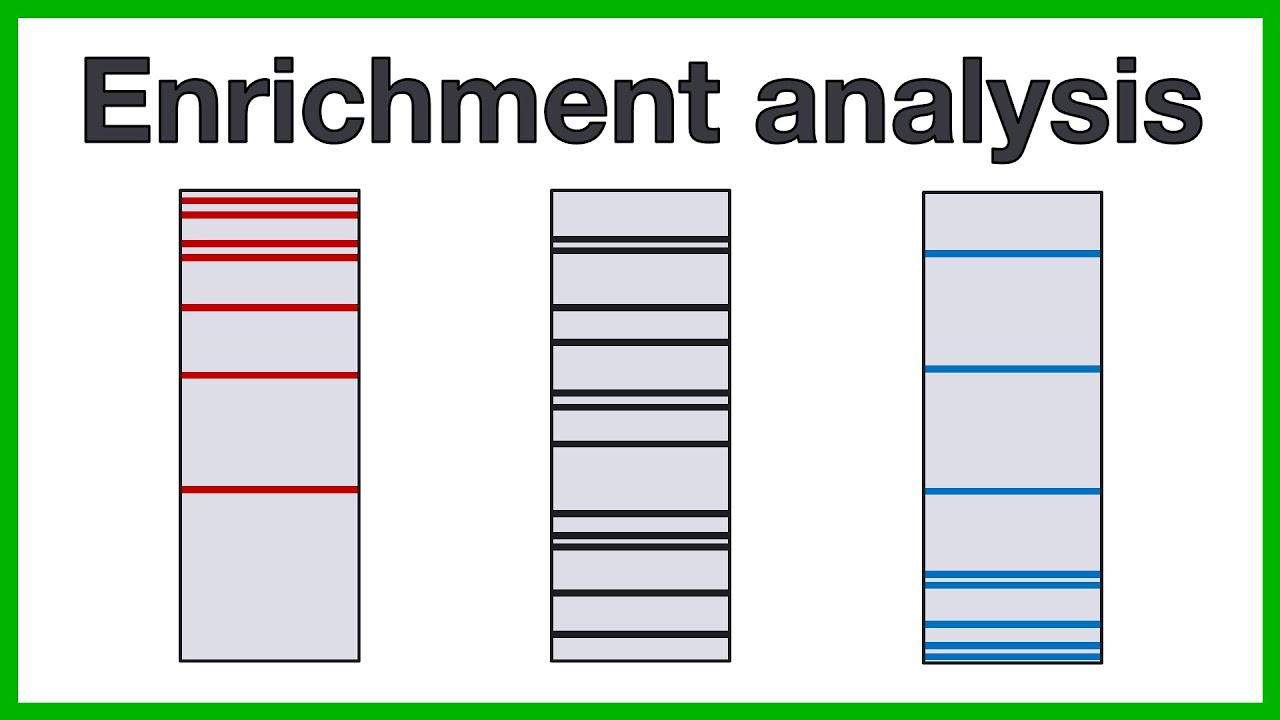
of the plot shows where the members of the gene cells appear in the ranked list of genes each bar is basically a gene so it's a nice visual way of identifying where the genes of that pathway fall in our ranked list so if they fall more towards the top or towards the bottom or if they are evenly distributed so for example if we were testing the Genesis glycolysis it would tell us where the genes for glucose isomerase glucose phosphatase and so on are in our ranked list where do they actually fall Greece so if you're
dealing with gsea results you will often see Leading Edge subset what is the Leading Edge the Leading Edge subset of a gene set is the subset of members that contribute most to that enrichment score so for a positive enrichment score the Leading Edge subset is the set of members that appear in the ranked list before the peak score for a negative enrichment score it is the set of members that appear after the peak score but what is the Leading Edge subset good for what is its use so in a way it tells you which genes
of that particular Gene set or pathway are the most important for you because they are the ones that contribute most to that positive enrichment score for example so they contribute the most to that pathway being up regulators if we go to the original publication of Gene 7 enrichment analysis we will see they also mentioned correlation with phenotype you can also see in some publications of Gene Center enrichment analysis plots done with the gene sets enrichment analysis software now the correlation with phenotype basically shows your ranking metric As you move down the list of ranked genes
now you can rank your genes by different metrics but if we go with our example where genes are ranked from most of regulators to least then the ranking metric will give us an idea of the genes correlation with a phenotype in other words genes at the top of the list or this area over here will be mostly operations in tumor cells genes at the bottom of the list or this area will be mostly correlated with a healthy phenotype nice so we already covered the plot but jean said enrichment analysis covers many more statistics let's see
what they mean we already covered the enrichment score of a pathway as we said the bigger it is the more significant that pathway of a gene set is positive means most of the genes were found at the beginning of her list negative at the end so if you use the sign of the fold change as a ranking it literally means the pathways upregulated or down regulators but actually if you want to compare your results for different Pathways you should not use the enrichment score use the normalized enrichment score or NES okay I sound like a
cheerleader but anyway as the name indicates it's a normalized enrichment score basically you cannot compare an enrichment score for th1 differentiation and riboflavin metabolism why not simply because their Gene sets with a very different number of genes that is why we need to use the normalized enrichment score the NES accounts for differences in gene set size and in correlations between Gene sets and the expression data set so in summary they can be used to compare analysis results across Gene sets nice so we've basically covered most of the important statistics from Gene set enrichment analysis and
before we finish off I would like to show you what typical results of gsea look like these are gsea results of differential gene expression analysis of lung cancer cells versus normal cells now the table might seem a bit overwhelming but we've actually covered most of it we have the list of Pathways we tested so you see we also have the ID of the pathway in this case they are IDs from kick database the set size tells you how many genes are involved in that pathway and the enrichment score and normalized enrichment score which tells us
if they are up or down regulated in lung cancer cells versus healthy cells and of course for each pathway we also get a measure of how significant they are the p-value remember that for each pathway we're statistically testing if it is over represented or not in our list but sometimes the statistical test is wrong it concludes that a pathway is over represented when in fact it is not and it was just by chance the p-value is the probability that that happened that the pathways found over-represented just by chance so smaller P values mean we can
be more sure that the pathway is actually enriched but if you're checking multiple Gene sets do not use the p-value you must correct for a gene set size and multiple hypothesis testing since we're carrying out many statistical tests repeatedly for each pathway the probability that some are wrong gets higher so to say so to correct for that it is better to use P adjusted values in this case P adjusted values are p-values corrected with the benjamini hawkberg method and the Q value might be a better option it's also a way to correct the p-value but
it is less stringent you might know the Q value by the name false Discovery rate or FDR again it's just the probability that a gene says with a certain enrichment score is a false positive for example an FDR of 25 indicates that the result is likely to be valid 3 out of four times you basically want an FDR lower than 25 percent more or less but you might want to be more stringent if you have less samples or you want more robust results anyways if you're comparing multiple Gene sets use the FDR and that is
all for today squidtastic I hope this video gave you a clear overview on how to interpret gsea results if you like this video please let me know and if you would like me to cover a specific topic leave me a comment down below oh and if you're new here don't forget to subscribe have a great day and see you in the next one