okay folks this teachings going to be specifically dealing with higher timeframe concepts you okay the points in focus this module will be talking about key levels what makes a key level price rejections all right Sookie levels we're looking at yearly highs and lows that means the last 12 months and this is a rolling calendar not a specific January to December type of phenomenon so whatever today is go back 12 months and we'll see what the yearly high in the low is respective to those points okay monthly highs and lows and finally weekly highs and lows
so what we're looking for is the long term macro yearly highs and low to quarterly monthly highs and lows and the individual monthly highs and lows and the weekly highs and lows now what do I mean by weekly highs and lows we're gonna look back last week's high and low very simple monthly high and low we're gonna look at the last three months high and low and we're look at just the last 30 days or whatever the previous month is it's high as tying this low and slow and yearly again is a rolling calendar from
whatever today is go back 12 months whatever the highest high and the lowest low is we'll use that as a reference point okay price rejections double-top sweeps that means when we see price action creating very clean equal highs or relatively equal highs we're expecting that phenomenon to take place for a price would drive above those equal highs reject and trade lower double bottom sweeps in other words just reverse what it just said anytime on the price action we see equal lows form we would anticipate should price trade back down to that level close to it
it would sleep below it run the cell size below the equal lows and then reject and go higher and a simple run on old lows that means running out a previous low and then rejecting that going higher and then runs on old highs which is the obvious reverse what I've just mentioned in Olos an old high gets traded through pulse breakout and then returns back into the range trading the opposite direction so I'm thinking kind of a field trip if you will through price action we're gonna go through the majors tonight and I want to
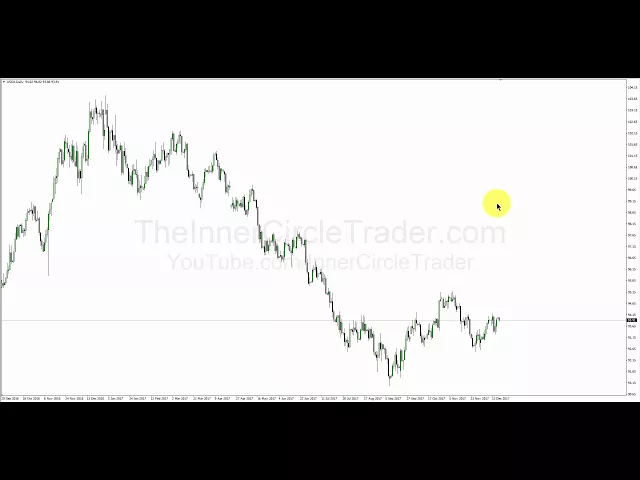
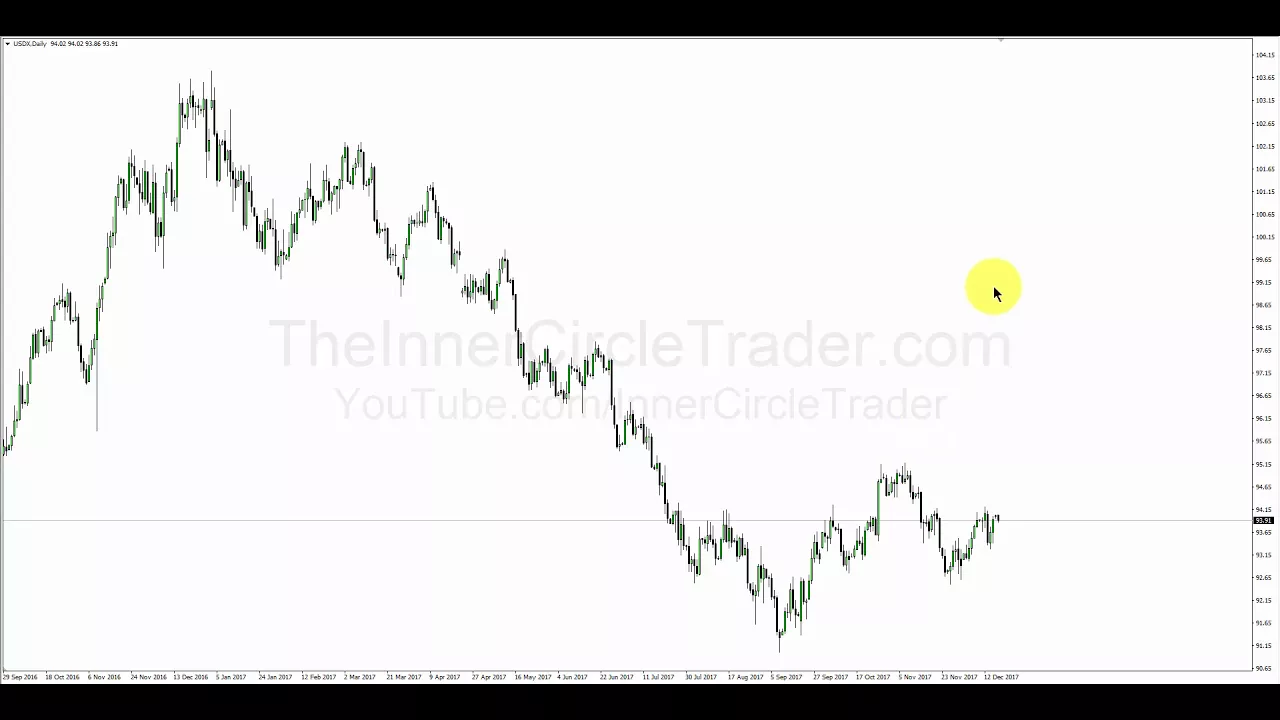
talk about some things that I think that a new traitor should be focusing on and how to use some of these things to formulate an idea or understanding to build foundation and then start building on that with more than concepts I'll be teaching in my continuing series okay folks we're looking at a dollar sharpness is the daily and when we sit down to begin our analysis lease for a higher time frame standpoint this teaching is going to be really aimed at those individuals that cannot do a whole lot of intraday charting or trading or day
trading or scalping so climate analysis concepts where an individual that has that limitation it has that limitation what is available in terms of analysis or techniques that we can more or less ferret out an opportunity to practice with our demo account so what I like to do is number one I like to cycle through all the majors but I begin with the dollar index and from a dollar daily okay we can see that we have been trading lower ever since around August we've been consolidating and going sideways now the prevailing trend has been down for
the entire year on the dollar and we created a rather significant low here and we've rallied up so we've broken this high so since this happened we've been consolidating sideways but also notice that we have traded below this low and we've been inching higher so using the things that I mentioned on beginning of the video we look for relatively obvious support resistance levels okay long-term yearly highs and lows monthly highs and lows quarterly highs and lows and in previous weeks highs and lo I'm not going to draw all those levels on here I'm not going
to draw all this on there because this could turn into a four-hour video and it's really not essential you can go through the charts and do that and I'll do it with one chart in this presentation real quick but the the idea is first and foremost you want to see where are we trading right now are we in a trending model are we in a trading range market right now we're in a range bound market or could potentially be a reversal so if we look at the trend it's been lower we have potential reversal point
down here and we've gone sideways so what could eventually happen is we could shoot higher and aim for these equal highs or we could roll right over and make an attempt to go lower and retest this low or try to trade down to it and fail okay we don't know that so but you don't need to know that see the question I get a lot is well how do I know if it's not gonna go below this low with it wasn't stopped or if it goes to it and continues well you have to figure out
where the market is right now and if you believe it's going to go down there that offers up a range so you look for opportunities between where you think it is right now if you think it's going to go down to that low that's your opportunity okay that's your range of potential profit but as it is here I like to look at what was the most recent run on liquidity most recently we've had it trade above this high and we sold off a little bit and then we came right back roaring higher trying to maybe
run through these equal highs again and if we do that we may be reaching for these equal highs notice also this low was traded through with this slow so we've already tried to go lower below this love and it rejected it handsomely we try to go above this high here try to sell off but quickly came back now this could still roll over and go lower but right now we're at a crossroads where if it goes any higher from here and always we trade up above these equal highs that may warrant a run to these
equal highs and if it does that that may be a precursor to a run even higher okay or because the time of the year we're at the end of 2017 we're late in the month of December this thing could just go sideways between the high and the low defined here and just stay at equilibrium now the things you'll learn with experience is there certain times a year when the market is predisposed to do certain things certain times of the year is supposed to trend in certain times a year it goes in the consolidation right now
typically we're in a consolidation time okay if you look back at the previous years okay we have the market trending prior to it and then went into consolidation then around March we start trending down to around August or September then it goes into some consolidation again so the idea of profiling I think is beneficial for you because if you're looking at higher timeframe charts but the main thing I want you to take away from this presentation is even though you're not looking at lower timeframes you're not scalping or day trading those same price action concepts
still applying because price is fractal that means the things that we would see and expect to see unfold in the lower timeframes just not tied to any real time element we would still expect the same phenomenon to occur on higher timeframe charts like the daily if we go over to the euro dollar you can see the opposite has happened this market has trended higher as the dollar index itself traded lower we've seen the market trade sideways as we saw on the dollar index now again let's take a look at some ideas here we've had a
high traded through it broke down took out that swing low traded back up and here broke it now we broke this high we try to go higher and now we're sitting with equal lows we have these lows taken with this low so again same scenario we could be stuck in this range for the remainder of December if I were a betting man and forcing myself to take a trade where we're at right now I would have let them expect it to trade lower now will it gun through these relative equal lows well it looks a
little bit cleaner for that to occur in the opposite direction with the dollar index because it equal highs up here and the market could in fact try to trade about these equal highs and reach for that on the euro we have a slightly lower low comparable to this low but nonetheless we could be overall retracing now why would that be most likely took her and not higher is because we've had the market move one direction all year long then we went consolidation and we broke above this high here should I ran higher but now we
keep breaking a low okay so any further movement below these equal lows I would see that as momentum building to make an attempt to get below these lows here now how much further below that we had to weigh that out and measure it at the time but for now I would anticipate because of the time of year we're in late December the markets already moved were kind of like long in the tooth if you will for that move it would be reasonable or healthy to expect it to have some measure of retracement now if it
trades above this high then we would be aiming for these highs to be taken out and probably a measured move something like this low to this high add that range this low and you would get some kind of a projection okay but right now I'm thinking neutral to bearish on the Eurodollar Kable we've had a nice uptrending market here and this one I had an ability to get above and outside of this range in here and we trade up into almost this swing high being taken out but this one's actually a very difficult market to
be in right now it's not clear it's not obvious as to what it would want to do so even though we've had a nice move earlier this year we've gone into a condition where it's highly suspect in terms of what would be the most likely or probable direction it's gonna move next now this looks like a classic chart pattern where folks would probably see that as maybe a bull flag and maybe continuation the upside but thinking about what I showed you in a dollar index that kind of like negates this doesn't mean it can't spike
up air and you do whatever it wants to do and run against the scenario with the dollar index for now I just think tit we may end up seeing this thing go sideways still or try to make an attempt to go back below these equal lows here because we've already cleared out the equal highs spend some time up here no follow-through yet but if we trade down and break the middle of this range defined by this high to this low if you go back below that okay easiest way to do if we get below this
swing low I think that would be fair enough if we break that well we would say price try to make an attempt to get down below here to get these get these double bottoms okay so we would expect a double bottom sweep only quality here because we've already seen a double top sweep here and we're in uncertain conditions for cable why because the dollar looks like it wants to go higher and even though the cable can go higher in that environment because of some fundamental factor that I don't know about and it could happen and
that's the risk we have in trading that's why we have to have stop losses and such but I don't see that that's likely to occur given the conditions in the market place here so this payer I wouldn't touch but if I hadn't gone to my head I would be reaching for these equal lows because of the dollar bullishness is outlined it became the video halsy dollar this market has gone back into the middle of the range it doesn't have any real clear direction we've had a move-up retracement move up and now we retraced we're essentially
in the middle of the range okay so in terms of trading this would probably be a good day trading pair but it's a short-term trading or a swing trading I wouldn't touch this one here why because of that doesn't have a defined movement and it's made an attempt to get quickly back in the equilibrium or the middle of the range and the range is defined number one by this low to this high and we're smack that right in the middle of it right now we tried to go lower but this run here we've outlined this
in a previous video with SMT smart mining technique and we value up taking out clean highs now it's uncertain as to where it wants to go so the move is done for Aussie dollar and we would have to wait for a new setup so the uncertainty and consolidation nature of this pair would keep me on the sidelines I wouldn't worry about trading this one New Zealand Dollars very similar we would be looking for similar conditions like with the Aussie dollar but for this pair it looks even worse because we've had an attempt to go lower
lower lower lower every low has been taken out and we don't have any kind of clear defined market structure in here to work with so it best we probably see it returned back to this low here and what happens out that it's anybody's guess so there's no real clear market structure here to frame analysis on whereas when we saw with the Dollar Index and on the Euro there's potential there so there's clarity in euro dollar wanting to potentially go lower and dollar going higher every other pair we've looked at so far is uncertain dollar cad
we've had an attempt to trade lower below this low progressive and then it came back roaring higher eventually taking out this swing high had a retracement nice optimal trade entry long in here and we also have a consolidation so it looks like we could be another leg higher on dollar cad if not for anything else i run on these double tops so a double top sweep we would look for that took her we've already had double bottom swept here and then rejection so we will be anticipating a movement higher to clear out the liquidity above
these equal highs and maybe they can attempt to go a little bit higher up from the range that's create from this high to this low okay so what I'm looking for is evidence of a clear direction where it wants to go and when we have areas where we just recently had these equal lows taken out we're here and we reject it we just recently had these equal lows taken out with this run here and it rejected and it's also left these equal highs in place so where is the most likely direction going to be up
and it's also in favor with what I find in the dollar index at the beginning of the video so we could probably see a run higher so there's two conditions that we were looking for word euro dollar lower dollar cad higher and dollar index higher now again this is the condition that I would see right now but the probabilities are not as high because we're so close to the holidays and it's the end of the year end of the month but I'm giving you how I would personally go through the charts and study and look
for opportunities for price movement just study how it unfolds in the daily chart okay and then we have the dollar Swissy kind of like what we've seen with the Aussie dollar and it doesn't have a real directional bias yet we do have price coming down below these equal lows we ran through that and rejected so we may have an attempt to get back above here but if you go a little bit to the left further we have relative equal highs here so if we have that dollar bullishness you could see another leg higher to reach
above these equal highs so I don't like that one so much but if we want to talk about probable levels to reach for dollar Swissy we could possibly see it trade up to that level great view and finally the dollar yen okay and this pattern is a really obvious trading range okay this payers had a real hard time finding its way out of this range and it's going to add on the levels to save time [Music] and what we're looking at here okay what we're looking at here I have the double bottoms and old highs
noted and also have the yearly high to find with this range here looking back 12 months and we have it defiant the end of this month here would be 12 full months and also have the ranges with the quarterly okay so here's March and it takes us to June September and we're in December now and then obviously you can go through and add the individual vertical lines the daleney what the into individual monthly highs and lows are I don't wanna hang and all that because it would make the chart really busy and the question is
just you know well how many levels would you have well you're only going to worry about the ones that's right now like right now where we're treating out here the range is defined by while we just recently came off this low and we just recently left this high so we're inside that range here okay we're a little little bit less than halfway below that so if we're expecting bullishness on the dollar we would reasonably expect the dollar yen to make an attempt to get higher the problem with this pair is it's really stuck in a
range so you don't want to trade it in the middle of the range you want to trade it when it gets down to an old low you want to anticipate it running a know low like it did these equal lows here run that and then we rally okay we have equal lows here we'd like to see it trade down maybe take those out and then rally up or just leave it where it's at and start running higher we had equal highs here it punched through it here and then trade little lower we had equal lows
here 1 2 3 4 ran through it and also reach below this low here so what we're looking for is bold lows to be ran out which it does here and then rejection what makes the rejection it trades back above it old low once that happens you would look for an old high or equal highs to reach for here's an old high it goes trade to that we have no high here doesn't get to that it fails here trades back down it goes back below this old hi what's it going to reach for possibly this
old low here he trades back up to this level here as a key level this is this reason why it makes these levels key by having defined ranges that are generic they're not dynamic they're not ambiguous they are specific okay previous weeks highs and lows monthly highs and lows quarterly highs and lows yearly highs and lows and by focusing only on those and trading when it gets to those levels and nothing else okay we're not trading in here because on a daily timeframe you're stuck you're you have to wait for longer-term setups so you're gonna
have to wait for these levels to trade back to this high trade through it maybe reject it okay and wait for that key a little close you'll come home from work and see that it's done that okay so what do you do in Asia you can go short or you can look at the open at Asia and maybe trade above the opening at Asia and then sell short there but I stopped above that high and it may be a lot of pips because of the daily range but again this is for people that cannot de
trade what you're gonna be looking for well we have this low down here we can hold for that and it takes a long time many many weeks go by before it ends up blowing out that low here so you could have made profit between this price point here and here same scenario when we see this low here price trades down below it we wait for it to do what come back above it it does it here so we could be a buyer on this day here and look for what price to trade to wear this
old high why because we have equal highs so price trades above it and there's your opportunity right there this becomes another trade because we have equal highs it's it's rally through that what you can be reaching for market below these equal lows so it could be a seller on the long position and go short looking for a run below these equal lows here and it does that here okay we take your profits and because we've taken equal loads we can anticipate a rally again since we had this high take out these equal highs here we've
never came back to this high yet so that would be the next level of upside I would expect need to be traded to and if we get momentum through that you can see these double tops taken out okay and that's pretty much what I teach new traders to start with they're stuck only on this timeframe it takes a lot of time for the setups to form they cannot do anything else until it trades to these types of levels why because this is a highest probability levels yes you can do day trading entries but again this
whole teaching was focused primarily on individuals it cannot be on short-term timeframes they don't have a lot of time and they have to be looking for something only on a daily chart this is how you would do it so there's a lot of things that you know we could add to this but I don't want to do too much of that because again if you're on this timeframe you're probably very new in your development and I don't want to give you a lot of things to worry with just start looking for double tops and old
highs and whole lows and double bottoms and draw circles on that make a notation on your chart this this lie this high here and this high here yes we went above a little bit and reject it but these are relatively equal highs so price could come back through that again and it does but notice it leaves this high intact so this is an untapped area of liquidity and you're probably saying well who has a stop up there large funds that's what the market reaches for it's not your retail stop now your retail stop is going
to be placed where the books tell you and it's going to be the wrong place but the markets go to large liquidity pools on the basis of other institutional traders or large funds the markets all designed to go after that okay your retail stop they can't see it they don't know where it's at it's not important to them because you're such a small little blip on the radar in terms of liquidity they can't pay anything out with you so large funds they're trading billions of dollars many times and that will have a large area of
interest for buying and selling and the market will gravitate to those levels but they're going to be relative to these highs these lows in these double tops and double bottoms and you can see how the market goes right to them and then starts to look for the other side of the marketplace so from a higher time standpoint basically all you're gonna be looking for our obvious double tops and double bottoms and single highs and single lows and where the market most recently came from just find the opposite direction where the liquidity would be below the
lows right here now this if it wasn't double bottom or equal loads like this say this was not a low this would be sufficient and not because that's where it sells tops would be after running buy stops above here the markets gonna go lower seeking what liquidity once you take that once it takes that liquidity out below that low it's gonna do what easy they're gonna keep going lower for a lower level liquidity which it shouldn't because we've already had many attempts to go here here here here and then we're out of the way so
if we go below here we want to see it trade higher what's it going to reach for we have this short term high it reached above and then we have this high rate in here okay so there's liquidity above that one and we certainly have liquidity about there and ultimately if we get momentum above that we could see these stops right yeah and that would be an agreement with bullish dollar as well because the first currency in this pair is the dollar against the end so dollar strength in the index would promote strength in this
pick hopefully you enjoyed this presentation and you can find more at the inner circle trader.com