I'm going to show you exactly how one candle has completely changed the way I trade for the longest time I thought I was taking good trades I had a good air of Interest while I was looking to enter after a shift of Market structure and I was trading with high time frame Direction but I just kept on getting stopped out before price went in my favor and I just had no idea why this was happening most Traders think they're taking good trades with an overall direction at a good ERA of Entry but they just keep
on getting stopped out like me and it feels like something is missing and you are missing something the most important factor and just by improving your understanding of one candle you can completely fix this become profitable so the most important factor will always be timing it's not what type of trade you take it's not where you enter that trade it's when you enter the trade that makes you money as Traders we are trying to time the markets which is really difficult but I found one fix that makes timing easy and it's called candle behavior I'm
going to tell you exactly how to use it explain what it is and how I use it for direction and entries and this is completely backed by data if we go onto my journal here I have a 90% win rate just by using this one simple cter Behavior entry model so first let's go over what actually is candle Behavior so candle behavior is just how a candle moves in reaction to that previous candle throughout the life cycle of that candle so how does it move in the first half first the second half if the previous
candle is a bullish or a bearish or a strong bullish candle close the whole point of candle behavior is that it makes it really easy to give timing to Market structure and let me explain you should already know by now that higher time frame candles are made up of lower time frame Market structure price is fractal so this might be the hourly chart where each each of these candles is 1 hour if we go on to the one minute what that would look like it would look like 1 minute Market structure making higher highs and
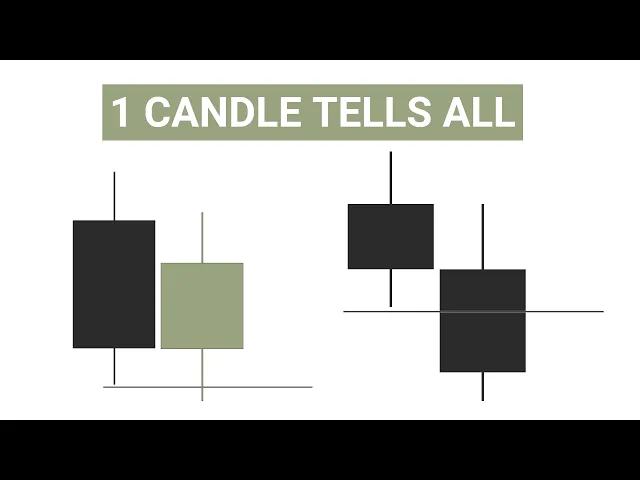
higher lows and just by looking at this one minute Market structure you could find a nice era of interest you could find the overall direction but you wouldn't be able to find the timing of when to enter that trade and this is where higher time frame candle Behavior comes in to tell you exactly when to enter that trade or when to expect a pullback as we in a bullish uptrend as the previous candle closed bullish as well so in the first half of this hourly candle I'm expecting it to First create a bottom Wick to
pull back on Market structure then around 30 minutes into that candle I expect it to then push up and flip and continue pushing bullish continuing this overall higher time frame uptrend so I expect around this 30 minute to continue pushing bullish you first want to see it create a bottom Wick in the first half of that candle in the first 30 minutes and then reverse around that 30- minute Mark and push bullish if we were to open and then immediately push bullish straight away this can be a sign of a reversal as price is a
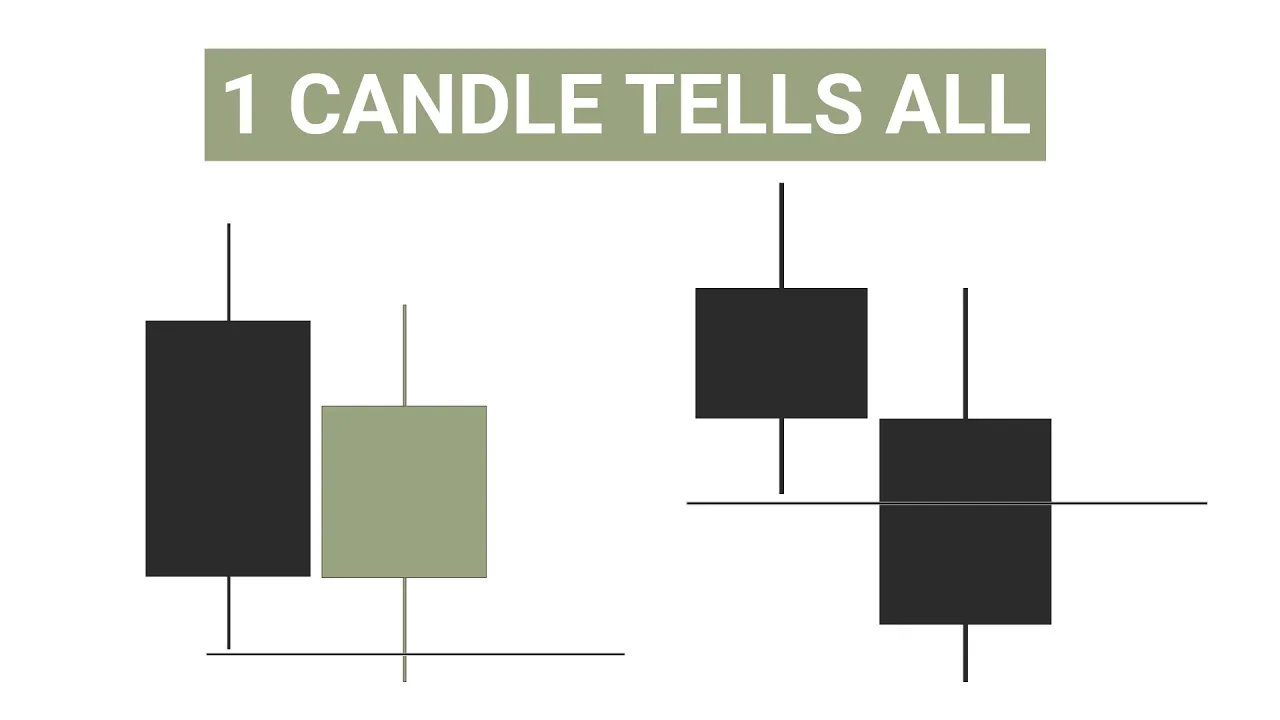
wrestle between buyers and sellers we will get we will get overly exhausted we're pushing in the first half of this bullish candle and it's more likely to flip bearish and close bearish in the second half more likely to potentially have a shift of Market structure what this look like on the downtrend where we're breaking a low uh for a reversal so just by looking at how a candle moves throughout the life cycle of that candle in relation to the previous candle close you can identify if it's going to be a continuation a reversal and when
to enter and exit that trade this can also be extremely helpful for direction I do not trade with the daily Direction I do not trade with daily bias I trade against that why is that because I'm trading a session so if the previous day closes bullish and I'm trading Asia session I'm trading in the first um half or open of that new day because the previous day closes bullish I would be expecting it to create a bottom Wick in Asia to then push bullish later on during the day so as we can see here previous
day Clos is bullish Asia session is bearish previous day is bullish Asia session is bearish um we're always creating that bottom Wick in the first half of that day this can also be really helpful for uh the weekly time frame as well if you're trading higher time frames the previous week has a strong bullish close we expect Monday we expect Monday Tuesday sometimes Wednesday to be bearish to create that Weekly bottom wi to then push bullish so just by understanding how one candle forms in relation to the previous candle you can time the direction and
you can also time your entry model and that's example here for a reverse we have this previous close bearish here but in the first half of this candle we push bullish straight away and then it reverses later on in that candle so really being aware of how that candle is moving in the first half whereas in this weekly candle here we push bearish straight away to fill in this previous uh weekly candle close to then push bullish later on so it's really important to understand High time frame candle Behavior as it makes it really really
easy to give timing to lower time frame Market structure so let's go into some live trade examples and we'll just recap this previous trade why was this actually a bad trade how could we have avoided this loss well ideally you don't want to be trading against the previous hourly candle due to Candle Behavior it's created this bottom Wick in the first half of the open and then we're flipping and pushing bullish looking to continue this hourly candle so we wouldn't want to be trading against that especially in the first 0 to 15 minutes of this
hour now we're approaching 30 minutes into the hour where we can look for more of a reversal we have a break this little low here so we could have taken an entry stop above a previous High to Target that same a of Interest as we've created this top Wick and now we're pushing bearish again to fill in that body so that would have been a pretty nice easy simple trade just using that counter Behavior by showing by seeing how it moved in the first open of that candle how it reacted after taking out the previous
candle high so I'm going to show how we could have taken a better trade at this a of Interest we could have waited for a previous hour close in our favor like in this scenario here so the hour has just closed bearish and we can look for it to create a top Wick first to fill in this body to create a little top Wick to then push bearish and flip that hourly candle because this is a smaller candle body we are expecting this not to take as long because it's not that big of a move
for price to fill lower time frame Market structure wise we also have a break to a high a break to a low a nice shift with this overall High time frame uh candle close in our favor so this is looking like a really nice easy trade we're still trading in overall direction at a nice air of interest but now we're Trading with that candle Behavior with that previous candle close in our favor so I'm just going to refine my area of interest to look for that entry it's just going to be at these one minute
candle lows where we're going to enter stop is just going to be Above That Swing high and we're just going to take an overall continuation of this overall of this bearish condition we can just Target some you know previous lows around here and we're just going to Target let's say it wanted to at around this previous one minute structure lows here so pretty nice uh RIS reward here and and so the new alley candle opens we create that top Wick we react to that lower time frame area of interest that we've refined then we're pushing
bearish here and it pushes nice and bearish in our favor so this is exactly how you can avoid being stop power and taking trade with overall higher time frame Direction by making it so much easier to time when that move will happen using higher time frame CLE Behavior so we'll just go over one more example of how CLE Behavior can be used for timing Direction and entry models as we can see here the previous candle closed bullish we immedately pushing bearish creating that hourly bottom Wick so we are now 29 minutes into the hourly candle
this is when you expect for this bearish candle to flip bullish in relation to this previous bullish hourly candle we have this overall nice break to these one minute highs we respected these previous lows here so one minute structure has also shifted bullish what we can simply do is just take an entry 30 minutes into the hour because we pushed bearish in the first half we're we're failing to break lows now on one minute structure and we've broken a high so one minute structure has shifted bullish it's a good time to take a reversal a
buy to create that uh top Wick and push bullish on that hourly candle because we pushed bearish in the first half um so we're using this hourly candle Behavior to make it really easy to take a good trade that will be trading with volume at the right time so it does eventually go in our favor maybe we could have had a bigger Target but it is what it is um works out pretty nicely and if you want a personal handbook so you can look at this and this and if you want a personal handbook with
a full breakdown of how to use candle Behavior how to analyze candle anatomy and my personal trading setups and explanation of candle behavior and how I use it there's a link in description below we can get that all for free so hopefully this was helpful if you want me to cover anything else just drop a comment and I'll cover that in the next video