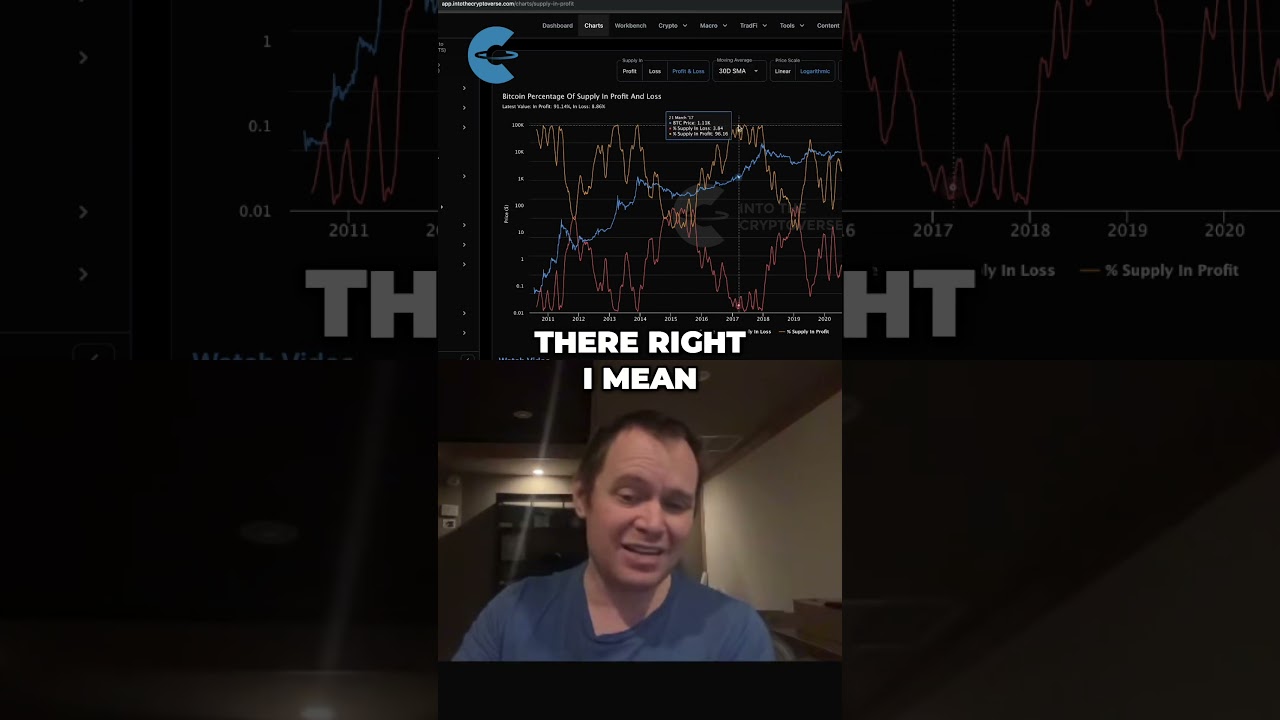
hey everyone and thanks for jumping back into the cryptoverse today we're going to talk about ethereum the butterfly effect if you guys like the content make sure you subscribe to the channel give the video a thumbs up and also check out the sale on into the cryptus premium at intothe cryptoverse decom I want to go through a pattern with you uh I've been following it for a number of years now I've talked about a decent amount on ITC premium but I would like to share it with everyone here so that you can see the market potentially through the lens that I'm viewing it in right now now I don't know if it's going to play out this way uh so obviously we can you know say that it's nothing more than dubious speculation right as the T-shirt says uh but I I just want to go through this and and show you what I'm thinking okay and we're also going to use prior Cycles by eth to also justify this potential move so there's something and this is where I'm going to lose most people because this where I basically Lose Myself there's something known as a butterfly harmonic it looks like this this what it looks like okay I've been following this thing for probably two and a half years the idea generally speaking is that you have a high you then have a low and then B is a macro lower high and then C is a macro higher low so if you sort of Zoom this out you'll see what I'm talking about now what we're going to do we're not going to just overlay it you're going to see these numbers and how they're playing out almost identically on the eth chart okay so you see the X to a b c and d and we'll talk about the Blue Line later on okay because I know I'm sure people are going to ask about it there's a tool on trading view right here where you can pull up this same thing right so and by the way I am not an expert at at butterfly harmonics or Elliot waves or anything like that so if if any of you are and I'm missing something feel AF free to to point it out right feel free to point it out okay so in this case you have X here and then this is a b could theoretically be any one of these Peaks right but that's B and then C would theoretically be theoretically the macro higher low and then D would be somewhere up here okay now what you'll notice is that there's numbers that correspond to these to these different and points right so the the retracement of x to B is the 786 right the 786 so if you look here at X and then you look to see where B peaked you can see it's right around the 786 right I mean you can see that first top was right around the 786 that's B that's this B right here right from X to B from X to B is the 786 you see that now here is where it gets tricky and and here is where it has been difficult but I think we've seen this also uh with the S&P 500 a few decades ago if you look at the distance here from a and sorry not the distance but sort of the the retracement level from a to c you can see that it varies right it doesn't have to go down to the 0 88 six it could go as high it could only go down to the 382 so what's interesting about this is the first top that eth had in March of 2024 that first low if you ignore this Wick right but that first low if that had been C that actually would have been right around the 382 okay so you can see how how this pattern it it has been relevant for a long time time and back over there I always thought that there was just no way that was going to be the macro high or low right I thought we would go much lower than the 382 that's why I've gone on and on and on for so long about ethereum needing to go home but the 382 see a to c right a to c the 382 is where it found support before going back up and then it came back down and found support around you know the 6 maybe around the0 67 or you know some if I guess if you don't include the wick if you look up here it's a little bit higher up but the point is that the C like a to c this can be as high as the 382 way up here or it could be as low as the0 886 now the 0886 would be all the way down here at around $1,200 okay now look guys I've gotten in a lot of trouble with people for a long time for saying eth could go that low it doesn't even have to go that low I mean it maybe it bottoms out before then but what I find interesting and if you followed me for a while you you already know what I'm going to say what I find interesting is that c the 886 actually just happens to correspond to ethereum's logarithmic regression band right you see that so this C right here of 12200 or so would actually be the lower logarithmic regression trend line now what's interesting with that is if you look at last cycle during quantitative tightening and if you overlay total assets held by the Federal Reserve if you look at at quantitative tightening right here there was this period where the Fed was reducing their balance sheet eth also formed a wedge that one point it broke out of and then after breaking out it came down to the bottom of the wedge you see that so let's look at that same thing has happened this cycle it just happened on a a much longer time time frame the reason it was on a much longer time frame is because well quantitative tightening went on a lot longer but the pattern is still playing out so what's interesting is that as eth fell out of the regression band like it's doing right now the FED then pivoted away from quantitative tightening relatively quickly um back then you know the eth fell out of the regression or out of the wedge in July and then the FED ended quantitative tightening two months later okay this time eth is falling out of it in like late February early March so there's a good chance that you know I I don't know exactly when but I would say you know sometime by the middle of the year if not sooner there's a good chance that the FED will end quantitative tightening now when that happened last cycle eth Bitcoin bottomed after this drop from the wedge was over the initial drop from the wedge and arguably that's exactly the drop that we're in right now so you could argue that whenever whenever this drop by ethusd finalizes by the time the FED ends QT that might actually be the bottom for eth Bitcoin that was the bottom for eth Bitcoin in 2019 right there right you see it fell out of the wedge quantitative tightening ended eth Bitcoin then bottomed eth USD got a rally it was a lower high and then ultimately the market went lower but what I find fascinating in this case is that after hitting the lower regression ban eth got a pretty big rally right it did I mean you know from that low it was around and what's really fascinating guys this is I mean it's it's really fascinating the low in December of 2019 was around 120 around 120 exactly 10% of where this lower regression band might be come this summer at around 1,200 you see that in fact a lot of the moves in the wedge are basically just a 10x difference right this low right here for ethereum if you look at a price label was around 80 this first low right there was around 800 the second higher low was around 100 the second higher low there was around 1,000 this final higher low before eventually breaking down was around 150 right if you if you look closely right there it's around 150 or so this one was around 1,500 and when it fell back into the wedge it was around 200 a little over 200 and here it was a little over 2,000 so this entire move by eth has just been the same thing we saw last cycle just taking place on a much longer time frame as crazy as that sounds and this is why I've never truly been willing to give up the monetary policy view because quantitative tightening never actually ended right and so because it never actually ended this was always going to be uh a you know an eventual outcome an eventual outcome even if it didn't happen as quickly as it did last cycle so I guess the question is well what happens if eth bleeds a little bit and then the FED ends quantitative tightening there's a rally into a lower high and then it just continues to bleed to the lower logarithmic congression trend line going back to this chart right going back to this chart now remember it doesn't have to go to the 0886 it doesn't have to go all the way down to the 0886 but remember the0 886 would be the lower logarithmic regression trend line right that that's where it would be at this point especially if it happens later on this year like in a few months it would be the lower logarithmic reg trend line would actually be the0 886 from that point the distance from b or not the distance right but the the FIB levels from B to D would be either the 1. 618 or the 2. 24 so the one sorry the 1.
618 would actually put it right here right right here around 6,000 right around 6,000 the 2. 24 if you to look at the 2. 24 that put it at over 7 around 7500 and you can also see how that's the same you know you can measure it from X to d as well it's either the 1 point27262 right so this would be closer if it's like this it'd be closer to the 1.
618 if it's down here it would be closer to the 1. 1272 okay now I want to take a step back for a minute this wedge if you followed it through the higher low structure and then you continueed to follow it that basically marked the cycle top for ethereum now technically it went a little bit higher later on but if you bought eth at 100 bucks and then sold it all at $4,000 back in 2021 who cares right who cares if it went a little bit higher no one cares so I've waited for this for a long time right what if we do the same thing here right and this support level ends up becoming a future resistance level and maybe marks a peak later on now it depends on how you draw the line if you want to draw it in a very negative way and you draw it say way down here to this Wick right there then obviously by the time you get out to uh to January 2026 it's going to be lower than it is right now but if you run a tighter ship and you sort of draw it out up to this level and say that these are sort of just fake outs below it but you connect this Wick to that right there then you could argue that this line here by early 2026 would get you to a little over 5,000 which by the way remember is one of the um you know one of those potential targets right it would be the 1. 618 as measured from B to D so I think about that a lot and now then I think like well how is that possible Right how how how really is is that going to happen you know what if we're in a left translated cycle for Bitcoin you know what if this is a left translated cycle what if the peak is in right I mean I think as an investor you always have to ask yourself these questions and it's one of the reasons why we talk so much about Market Cycle Theory there are examples in history when we're dealing with high inflation where the Peaks occur by the stock market in you know around the time that a new president takes office right this was December of 68 and then this right here was January of 73 so who's to say this isn't just bitcoin's first left translated cycle because we end up going into a recession in 2026 right you first you know you get first your first year you're not really in a recession but the Market's going down and then the second year you get into the recession in the midterm year right these lows were in the midterm years but the postelection year was still down it just wasn't yet a recession if you go look at the 1990s or sorry 1981 when Reagan took office the market trended down for a while eventually it went back up but it did Trend down for a while if you look at the QQQ it had a big top in 2000 and then a big drop potentially like what you're seeing with Bitcoin right now where it dropped from 120 down to 63 and then it had a macro lower high but I would say this if it is a right translated cycle and then Bitcoin goes on to put in a new cycle High later this year then it would absolutely make sense that eth could follow this this path right of you know continued drop into you know later like maybe by this summer or or you know it could end sooner I I don't know how quickly it's going to go down that's one option but you could argue and this might sound crazy but you could argue that even if it's a left translated cycle eth could get that move because the times that eth normally moves against Bitcoin are on bitcoin lower highs right so if it follows the QQQ then what if it's just sort of a Bitcoin lower high that ethereum gets that rally in after QT is over if it does play out like that then that gives you the answer as to why D is is a bearish harmonic and why eventually it just goes to New lows if truly it's a left translated cycle okay so you know this this analysis is it's got something for the Bears it's got something for the Bulls I don't know if it's going to play out like this but I would say if later this year ethereum is at the lower regression band right if it's down here and then if it gets a rally you know to to to a new all-time high um and then Bitcoin is unable to put in new highs or it starts to really struggle later this year and then there's signs of recession starting in 2026 then that's exactly how D could actually be a major selloff into a into really cryptocurrency's first recession potentially in you know 2026 right um how does that how does that work through the lens of of what we saw last cycle well you know after it hit this regression ban you see how eth was going parabolic right there right it went from like 120 to 300 that would be the same thing as if eth were to go down to 12200 and then rally up to you know to 3,000 right like down here and then back up but you could argue that the reason this rally was cut short was because the unemployment rate just went parabolic immediately there was no hiding from the recession right I mean the unemployment rate hell was like 14 15% the market will try to ignore it until it can't any longer and you could argue that the market could just simply not ignore the fact that the unemployment rate was parabolic at that point so you could argue that this if if this plays out through the lens of monetary policy You could argue that if we get that rally it could go on longer than what it did in in the 2020 rally right instead of lasting you know just like a couple of months maybe it lasts a few months like you know five months or six months or something where it goes like this you know it comes down and then goes up and then sells off now you could argue that if you were to go back to this pattern and this is what I'm not sure about right I I don't really know if it has to go down here I I don't I don't really know that the the there is evidence that something like that could happen but I I don't feel like it's we're destined for that outcome at this point but if you look at like the SNP in in the 1970s you know when it had periods of inflation issues and unemployment you would go to slightly higher highs in the in the bull markets but then in the bare markets in the midterm years you would go to slightly lower lows right this was 66 70 and then 74 right so separated by four years so if it is a left translated cycle then it could play out like that where you know ethereum goes down and then goes up here and then gets a a major selloff to a new low where it actually takes out that low right which would be kind of crazy I'm not really calling for that at this point but it is something to keep an eye on especially if the economy does sort of devolve into into recession recessionary outcomes in in say 2026 where you get you know something like this right where it it just sort of expands outward like the S&P 500 did but the reason why I'm I'm not married to that outcome is because in the 1970s when that outcome actually occurred it was during a period when the unemployment rate was going down that led into that type of drop and the reason why that was an issue is because that was when the inflation rate was Sky High right I mean the inflation rate in in you know December of 68 was at was at 5% and it was trending back up higher right it was trending higher um and and so you know you could argue and and then this one over here right it was it was starting to really pick up again as well so and the reason it was picking up was because the unemployment rate was going down which this cycle we're not we haven't really seen that we've seen the actual the unemployment rate has actually been trending higher not trending down so I'm not married to that outcome because I I do think we could deviate from what happened the 19 1970s and that sort of brings me to what happened in in 1991 or sorry 1989 to 1991 or sorry 1989 to 1990 where you basically had sort of a triple top and you had a low a lower low and then this final low was the recession low right so this here kind of reminds me of ethereum right I mean it it sort of does if you look at at at ethereum this cycle you know it it looks to me like you have a triple top right and then you have a low and then another low and then maybe you get your you know your final low over here right you get your final low and then you get a big rally up so it could definitely play out like that and if it did play out like that you'll notice in the 1970s it's not like or sorry in the 1990s it's not like the market then went to a new low it just got a big move up and then kind of sted out for a while so one of the potential outcomes for this if if if this harmonic does continue to play out is where it goes like this up and then it just goes back down into the regression band and then we just continue to watch it slowly Trend higher kind of like you can see it right there right so that is also I think a realistic outcome here um and and you know I've had a lot of people ask me like well why do you you know why are you looking at like 1990 as as sort of a reference point and I get like it's easy to to dunk on someone that's posting an analog I don't actually think the analog is going to play out exactly like I don't I don't really think that the outcome for ethereum would be um you know I I don't think it would just go like up like that and just slowly Trend up for the next several years I really don't because I do think that midterm years for crypto tend to not be that great um so I I I think it would either you know it would either be this right um and maybe that wouldn't go as high right but it it would either be like that or if it's a left translated cycle by Bitcoin then it it could still go up but then it could go to a new low right and then go back because when the recession occurred over here you know it was a pretty big drop but then they printed our way out of it and that's the thing that I I go back to right I mean like some of these patterns might play out if there's no intervention you know like you could have argued that with a pandemic had they not intervened ethereum could have gone you know much lower right it could have gone much lower uh but the FED ultimately intervened and and you know the rest is history so I do wonder if um if this chart is telling us what's going to happen it's just that the time frame at which it plays out is is very different than what I think a lot of people were thinking right we're still getting you know we're still getting this move there is the same thing as this one and now this move down is potentially the same move as this one then the question is is it how how low how long does the cycle or does eth need to bleed before it then gets this rally and if we get that rally does it occur from this low here does it occur from sort of the fair value right there closer to, 1500 and if it happens does it actually take ethereum to a new high and then sort of sell off and then we sort of pick back up again next cycle but you know how I was saying like a lot of people are sort of saying like why why compare this to the 1990s you know when I was looking at this I wasn't actually going through the through the stock market and figuring out you know what looks like ethereum it actually worked out like this what I did was I was looking at at us interest rates minus the 2-year yield that's what I was looking at and I was noticing that it just happened to be that there's been two times in our history where this chart looked like this where it hit this trend line and then had a big drop and then we saw this thing go back up one of the times was during the financial crisis right so the the outcome I'm giving you is the more bullish outcome even though it's bearish first the other outcome is this top right here which was the 1989 into 1990 and you can see that when it dropped and then it got this metric got this rally into a Mac into this lower high there that is exactly where the stock market bottomed into that final lower low that's where you had that right this low here correspond to the US interest rates minus the uh 2-year yield finding that lower high right there which is why I'm watching this chart as that comes potentially into a lower high that could end up being that final lower low for ethereum so it's it's a really interesting way to look at the market and and so I I know a lot of people like well are you just digging for you know in the S&P and fighting something so I I saw this chart and then I saw the S&P I was like oh that looks like ethereum you know but I found that through looking at at this chart I was like oh that triple top and lower lows that actually looks a hell of a lot like what ethereum is going through right now and then the other chart that we've been talking about this is something I've actually been following for a couple years now um and I I basically watched eth bounce at every single level along the way right it bounced right there at the 382 here and then it bounced a little bit lower and now it's potentially going all the way down to the 886 or as low potentially as the 0886 before finding some more renewed strength but I just wanted to make people aware of this view on the market and and to remember that a lot of what you're seeing this cycle actually played out last cycle the reason why this cycle feels different is because quantitative tightening never actually ended whereas last cycle quantitative tightening ended in the prehab year you know so there's a there's a there's a pretty big difference um that's why that's why sentiment is so bad you know because last cycle we went through the process that we're going through now we went through it in the preh having year so that by the time we got to the to the having year and the post having Year all that mess was behind us but now again you you know the market does eventually pay its dues right and I think that's what's happening right now the market was going to eventually break down eth was going to eventually break down from this higher low structure it just took far longer than I think anyone truly you know truly expected um so I I did want to sort of bring this to your attention to talk about this you know this butterfly harmonic um and to just say look I I don't know if it's going to play out like this but I've been following it for a few years and and we'll see if this is ultimately how the market plays out and and by the way like if it were to play out like this it would probably be you know sort of a drop at some point the FED ends QT then maybe a rally then a drop and then a big then a big move up and then you know back down something like that that's probably how it would you know play out if I had to guess where the high could just be sort of you know back testing this trend line just like the high last cycle was back testing the trend line and even the prior cycle I mean you could argue that this trend line right here right this higher low structure right there was arguably sort of you know where Where It ultimately went up to um but look those are my views I want to present it on the butterfly effect for ethereum we'll see if it plays out if you guys like the content make sure you subscribe to the channel give the video a thumbs up and again check out the sale on into the Crypt premium at intothe crypto.


![BITCOIN: WE GOT WRECKED!!!! [my insane gameplan NOW]](https://img.youtube.com/vi/VETCtL5lupQ/maxresdefault.jpg)