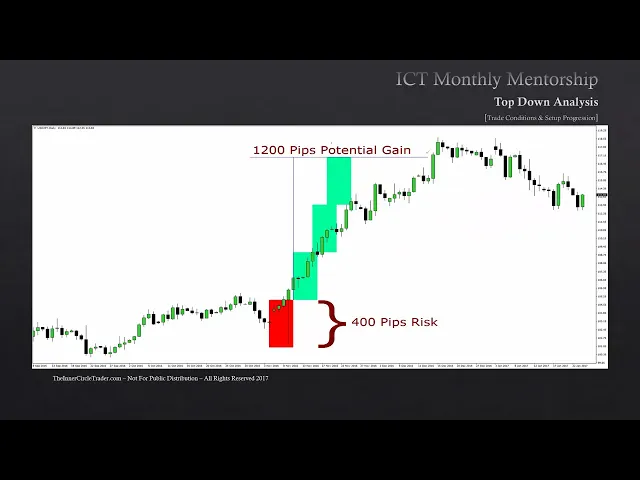
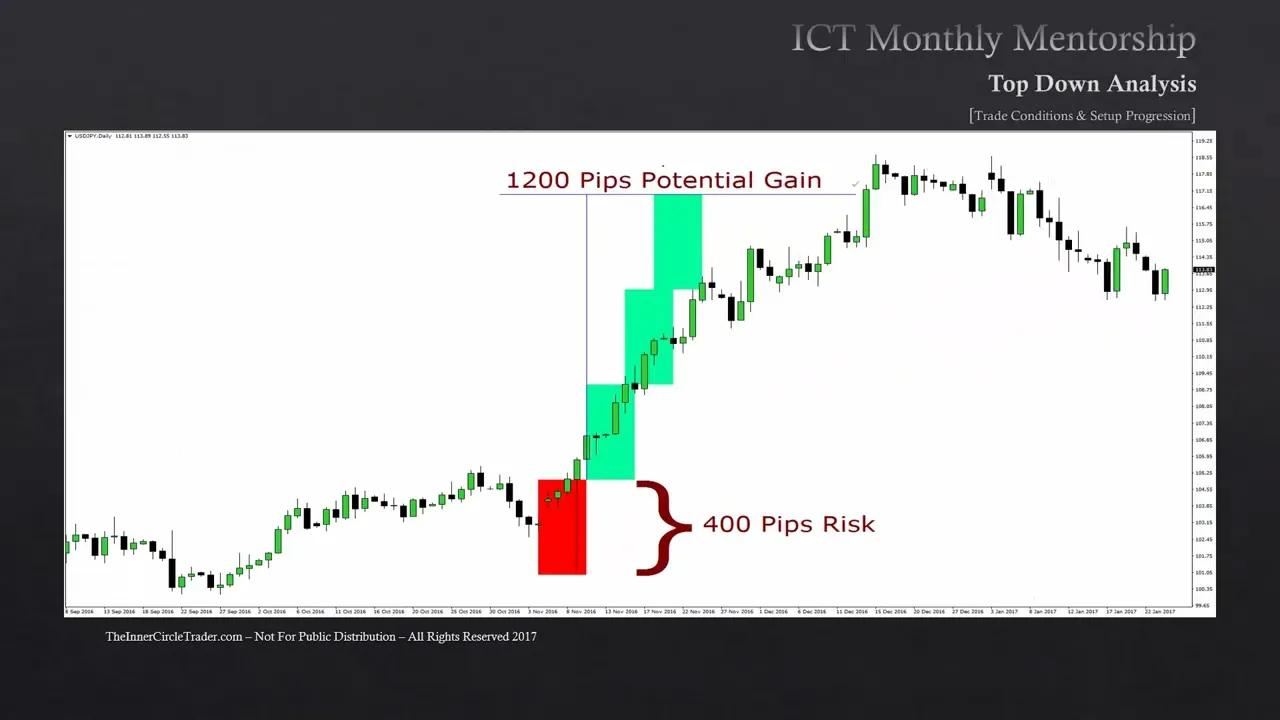
welcome back folks this is lesson 6. 2 of January 2017 ICT mentorship we're dealing with trade conditions and set up progression okay we're going to be outlining the 1200 pip move we mentioned in the money management lesson number five and obviously it's just a brief recap as a refresher just in case you came back to this lesson solo without going into 6. 1 when we're looking at a premium market and markets are trading near a premium and we have reasons to suspect that at lower future prices in order we don't know how much time it's going to be needed to get to that lower future price but we're looking for a displacement in price and vice versa in this example we'll be focusing on a buying opportunity when a market went to a deep discount on a monthly weekly and daily time frame and how we would use that insight to get to a higher Premium Future price and briefly just as a click overview again since this teaching's going to be specifically dealing with the discount opportunity buying at a discount and aiming for a premium objectives are focuses down here where mitigation blocks bullish Breakers liquidity voids fair value gaps bullish order blocks rejection blocks and old lows or old Highs are our focal point for entries on Long positions the idea is we're looking for something down in this list of arrays to Target one of the premium arrays now obviously the first one we'll be reaching for is a mitigation block that would be a first objective then if there's a breaker of any kind we would aim for that and we'd have to weigh out whether or not there's a significant force that would drive it through a breaker and we'll talk about that should we come to it in our example and then obviously looking for any range to be filled in for a liquidity void and aiming for fair value gaps in the premium range of the market and then we look at Value gaps bearish order blocks and then looking for a rejection block and or old high and old historic low so we're looking for bullish PD arrays to buy into with the expectation of selling it at one of the monthly premium arrays if we were looking at a bearish example which is what we're not going to be doing here but just for the sake of completeness we would be looking to sell short at a bearish PD array aiming to cover that short position with one of the bullish PD arrays mitigation block bullish breaker liquidity void fair value Gap bullish order block rejection block and or old low or historic High so selling at a premium and buying back at a discount before we get into our actual example I want to give you some uh study points so we keep it in mind when you are looking at price it's important to keep this as one of the focal points when you're studying when markets are at a premium or at a discount they're always going to initially look to rebalance that means the equilibrium price point between the last recent range so even if it doesn't go all the way up to a deep premium or down to a deep discount you can always reasonably expect it to go back to equilibrium and if that's all you aim for if you if you buy it a real deep discount and just get back to equilibrium you'll find a lot of Trades like that if you're a big premium in the marketplace you're at historic highs or a annual high or three month High you got a real good chance of seeing the market sell off back to some equilibrium price point of the most recent trading range when markets are in premium again and if you're in equilibrium you're gonna be focusing on the market potentially moving up into one of these monthly PD arrays that possibly may be a shorting opportunity when the market's at equilibrium can anticipate a market move down into a monthly discount aiming for one of the PD arrays as an objective so basically at equilibrium you can look for either expansion on the outside or downside now you're going to be Consulting the market structure on the monthly chart to determine what side of the marketplace you're going to be looking for so it's not indiscriminately going in there rolling the dice and seeing well I'm going to sell it short because it's at the middle of the range or I'm going to buy it at the middle range we have to look at some of the uh the criteria around that price action at the time you know weekly ranges just as a complete approach or overview all of the same PD arrays for premium and discount are the same and the same is said for the daily chart so we're gonna move through the charts now and look at the Japanese Yen cash price okay we're looking at the daily of a cash price for Japanese Yen this is seen at barchart.
com and historically uh last year in 2016 we made a high in August and the market showed willingness to want to start breaking down Market structure at this low here this low became broken at this moment here so Market structure on a long term basis on a daily chart had been broken bearishly and we see this Trump election rally up into bearish order block and then it sells off so we're gonna be looking at this move in here okay and we're going to go over to the Forex chart now just so you understand clearly because a lot of you may be knew and maybe you're used to trading the Futures Market or following the Japanese Yen cash price but when we pair it with a currency like the dollar Index the dollar Index is the front currency and then the Japanese ends the second so that means if we're bearish or expecting lower prices on Japanese Yen cash prices the dollar Yen pair is actually going to be inverted it's going to go up because if Japanese Yen cash price is dropping that means dollar prices are rallying and if the dollar is the first in the name of the pair dollar Yen that means when you're watching dollar Yen price action you're watching the advancement of dollar versus decline of the Japanese Yen okay here's a monthly chart of the dollar yen okay you can see how we've seen the market have a really nice rally up in here this is going to be again diametrically opposed to what we expected or just saw rather on the cash price on the Japanese Yen now as a reminder for some of you um we talked about the Japanese yen in the beginning months of our mentorship and I gave you some study points and gave some examples about this move higher and some of the levels that we saw a trade to the 118 for instance was one that was mentioned so if we look at what has happened and what's transpired we're gonna map out this this monthly chart and we're gonna get some some levels on here we have a high back here okay and I want you to take a look at these equal lows okay the equal lows in here we're going to be expecting what to be there cell stops so while the market was dropping last year we would be expecting it to trade down into these levels now what's this over here these two Down Candles that is a bullish order block when you blend both of the bodies together because it's two consecutive Down Candles okay and that gives you your equilibrium price point in here okay we'll take that off and round it to the full 99 level so we have a range here we have a high end or premium and a low end or discount what makes this a discount level the fact that we saw a price move away from it here now this could be a discount level as well we want to go back to where the move originated here we saw a big move away here that left the Gap open so we saw the the dollar Yen leave the Gap open here where price is only delivered on the upside there was no down movement to counteract that up move that was seen here okay came down closing that little range in here okay so price comes down hits the full big figure 99 okay so we have a defined range up here this is premium on the monthly level this is discount on the monthly level so on this level down here we would look to see a move below these wicks in here the bodies of these candles we saw it right in here this candle comes in at November 2016 it went below the bodies of the candles in here that is going to be a rejection block it cleared out the bodies of the candle on a monthly chart rejected sent it higher okay we have a range up here we also have this down candle which is a breaker why is this a breaker because we have an old high here old highs anyone that gets short they're going to put a buy stopper is resting right above that the market rallies above clears out those buy stops here and then trades down through it once this down candle is violated rate here it becomes a valid breaker if it trades down below it comes back to it here we have it middle of the body of the candle extend out in time it would give you a level of watch this is actually a weekly level we're going to see very clearly when we drop down into weekly range but we also have notice we have a gap in here which I'm not going to add all this on this chart to make it way too busy but we have a gap in here price has only been delivered on the downside between this candle's low and this candle's high it's been delivered down here as a gap so that would be one reasonable objective to look for when price was rallying but what makes the buy down here we're going to discount on a monthly let's change it over to a weekly okay here's the same dollar Yen just in a weekly format okay you can see here we have an up candle right before the down move okay that's a bearish order block so we're mapping that opening out over to here okay and the reason why I'm using the open on this candle not the wick is because there's an absence of a gap the reason why is because we have a wick here and the market traded down through here so this is two times this little area has been traded to and it was blocked in with this candle's high so this whole little area in here wouldn't be viewed as a gap or fair value Gap it's it's been closed in because the the very bearish water block itself had a movement lower initially so it's been passed through twice there price comes up and closes it right to the opening so they also have a we have a gap in here fair value Gap here between this candle's low and this candle is high that would be an objective to reach for also but I want you to look at the weekly chart we're deep in a discount on the Range and the price shares of willingness to want to rally and comes back down into the down candle right before that move this is a bullish order block you could be a buyer here but we're focusing on that November loan that's this move right here it's trading right back into and recapitalizing an old weekly bullish order block let's see what's done it's hit that right there perfectly and rally away now on a weekly time frame this bearish order block which is the last up candle right before the down move this is what you could have on your charts as well this is how you map out the conditions okay so that would be a reasonable objective once the price comes down hits it this by here it shows it hit that but then we had this set up here so which is this is later on you don't really see this as an objective once it's already been hit this wouldn't be no resistance whatsoever so you can take that level move it over to here that would be a reasonable objective on the upside closing in that range but now look at the bodies here see that equal Body candles above that we would expect to see a rejection block price reaches through that as well another rejection block candidate here equal Body candles we can expect to see that as an upside objective as price continues to trade higher here and then we have that fair value Gap up in here where prices only delivered on the downside that would be an objective over here you can see that I'm not going to move this line all around and then finally all the way up here to the bearish order block which is the last stop camera before the down move so we have a discount to Premium using the monthly and weekly charts but now let's go down into a daily time frame after I add one more little thing to this we also have this last down candle right before this buy occurred so right in here we're going to map that out with a different color so that way we can see the hierarchy between the weekly and the daily let's use a different color that a little bit darker maybe a little a little too dark for some of your personal tastes but we're just going to deal with that won't we I'm going to go over to a daily chart okay and you can see here the darker area is a weekly bullish order block this is the lower weekly order block and this is the higher weekly order block price comes down it hits that and actually touches both it gives you the return back to lower weekly order block that's bullish so it trades two times into a higher order block on the weekly chart and the lower of the two bullish order blocks and price rallies away and through right here on this November bye same thing we start seeing here on the daily we see an old high here we see an old high here we have equal highs in here we have relatively equal highs here as well we have a fair value Gap in here this high and this low which is what that would have been on the weekly chart by the way and then we have the last up candle right in here that low comes in at 118. 55 so 118. 55 so you can see how prices reached up into premium level over here now important thing is is if we don't see any retracement to come back into for a daily bullish order block or or if we saw for instance um let's say it like this let's zoom in we have this down candle right here okay price rallies away from it every time you look in an uptrend you want to focus on the Down Candles because that's where institutions are going to buy either they're buying at the time of the Down Candles creation which is usually always the case and then if it comes back to that same down candle at a later time they will they will buy more at that time we have three consecutive Down Candles in here right in here okay the order block really begins at this candle's opening not this last one you can use that one but if you want to be ultra Ultra tight on your stops but you're really going to be using the opening on this candle because it's the highest open of the three consecutive candles so that's this candle right here open comes in at 113.
28 and this candle it's open was 113. 26 so it's only two Pips below it and you see look at the the movement off of that level one two three times you're gonna bought and caught that last piece now that's not a long-term position trade mind you but it is what you'd be focusing on to see more upside pressure on this move once you have already been in it every down candle here okay price trades through here and it comes back down to a hit rate there in that moment right there adding the spread you could probably get another position on there but more more likely this is one as well uh you have a down candle price trades through it come back down into this candle what is the high on that candle High concept 1 11 39 the low on this candle comes in at 1 11 36 so that's definitely an opportunity for you to get in and get new Longs on so having these levels from the monthly and the weekly on it gives you context to what to reach for on a lower time frame daily when you're executing long-term trades but more importantly not that I could show it here but if we would have lost say for instance this candle here in order to trade it down below it we could look for another return to this order block here as the high end not down this V but we could expect for it to trade back down here and give another Buy and what I mean by that any bullish order block or any supportive role from a PD array on a daily chart if it is bullish but it fails to give you a Buy Signal or a support price the next level you drop back to is a weekly PD array so you're going to be looking for something bullish to support price on the weekly chart if the weekly chart PD array has no support and it breaks then you'd get back to the monthly support so because you're trading off a long-term perspectives and higher time frame charts the retracements can go through what you see on the daily the daily isn't going to support a monthly retracement it just isn't going to do it sometimes this is going to give way it's going to break through it's going to pull all the way back to what you would otherwise not see unless you're looking at a monthly chart so by having the monthly PD arrays on your on your charts and looking for them also on the weekly chart and having those levels on both monthly and weekly on your daily now it's not going to be on your executable time frame chart okay it's not going to be there but you should always have in your platform the asset that your or the market you're Trading you should have these monthly weekly levels on regardless even if you're a day trader because it's going to surprise you how many times it has great impact or significant impact even in day trading or short-term Trading swing trading you're gonna definitely need it but position trading it's absolutely crucial you definitely need it here because it's going to frame what trades you're taking and it's going to provide you support structure in the form of support of resistance or natural support for price to find new buying and or new resistance to find new selling at the takeaway from this is if you're following the market on a daily chart just because there's a bullish order block or a void that gets closed in or fills in a gap and that supposedly is bullish doesn't mean that it's going to keep price up from that point price could come back on the daily chart and retrace rather deeply see this is a one-sided Market delivery here the Market's been priced in on one side they completely keep running it higher higher up to a logical level which was that Weekly bearish order block the market moved from a discount all the way up to a long-term premium notice on the daily chart understanding order block Theory you could see that as a viable upside objective but for those that simply look at the higher time frame weekly for levels to key off of this is a logical area because it's very clear and distinct it's last up candle right for the down sharp move so this is going to be your bearish order block the opening on that candle comes in at 1 1861. the high it comes in on this candle at 118.
66.