hey guys welcome back to another episode in this video we will be going through our very simple yet profitable hiking ashy smooth price action trading strategy as usual we'll have plenty of practical examples the idea is to fully understand this wonderful trading strategy and to make the most out of it if you want more videos more often please smash the like button subscribe and turn on the notifications bell and share this video across your whatsapp facebook accounts or twitter to show your support a very important point before we start everything we discuss in this video
can be used for currency trading stock trading and crypto because price action stays relatively consistent across different assets so we're going to go very in depth in this video haikenashi smooth price action trading strategy the haikanashi smoothed indicator is a modified version of the regular haikaneshi candlestick charts a product of japan the haikenashi charts are ancient and were brought to the west only a few decades ago the haikanashi is a type of chart used to analyze the price of a security unlike the regular candlestick charts the haikanashi candlesticks are used to understand the price trends
this is done due to the way the price is calculated and displayed on the chart unlike the regular candlestick chart which shows the open high low and close of the price during a session the hikanashi chart takes a different view the open high low and close on the high canashi chart is calculated as follows close this is nothing but the average price of the session open this is the average of the open and closing prices in the closing price of the previous session high maximum value of the height open and close low minimum value of
the low open and close what you can see from the calculation is that the high kanashii price chart gives attention to both the high and the low as well as the closing prices this leads to a different perspective on how the price is displayed on the chart the high canashi chart can be applied to any time frame and to any market like stock forex commodities and cryptocurrencies it behaves the same way as you would expect a regular candlestick chart to work the differences between regular hiking ashy and the smooth heiken ashy chart you might come
across claims that the haikanashi smooth indicator is a better indicator type compared to the regular haikanashi indicators while you can typically use the regular heikenashi chart all by itself the haikanashi smoothed indicator is added as an overlay on the regular haikaneshi candlestick chart by doing so traders believe that this will give a better perspective of the markets when price is trading above the haikanashi smooth indicator it is said to be bullish and when price trades below the hikinashi smoothed indicator it is said to be bearish but the main difference between the regular heiken ashi indicator
and the haikanashi smoothed indicator is that the second type of indicator plots the haikenashi candlesticks as a moving average thus you can see both the regular candlestick or bar chart alongside the haikaneshi smoothed indicator parameters the settings for the smoothed heikenashi indicator is very simple you can set the values of the two moving averages that are used the moving average method means the type of moving average you want to use moving average method one choose the moving average type to use in the calculation period one the number of bars to use in the first moving
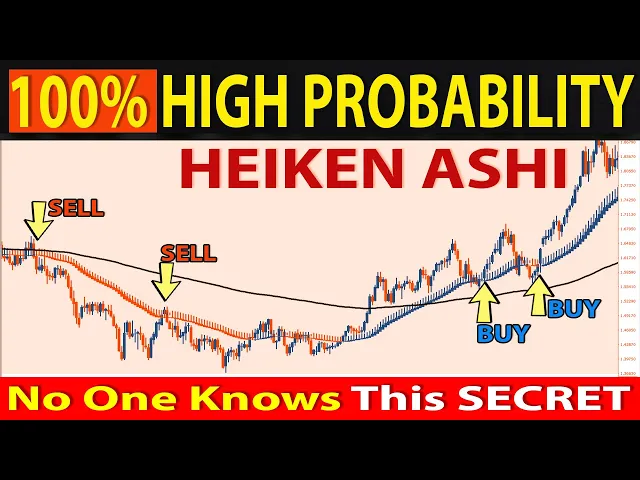
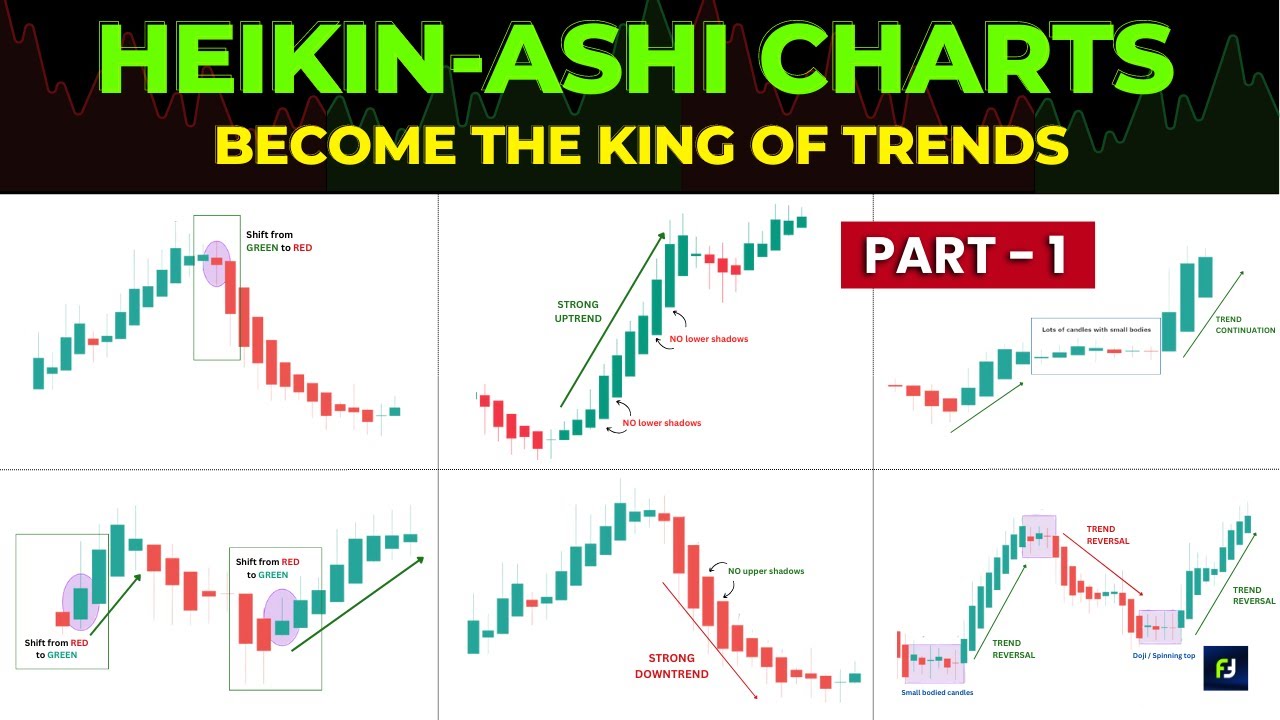
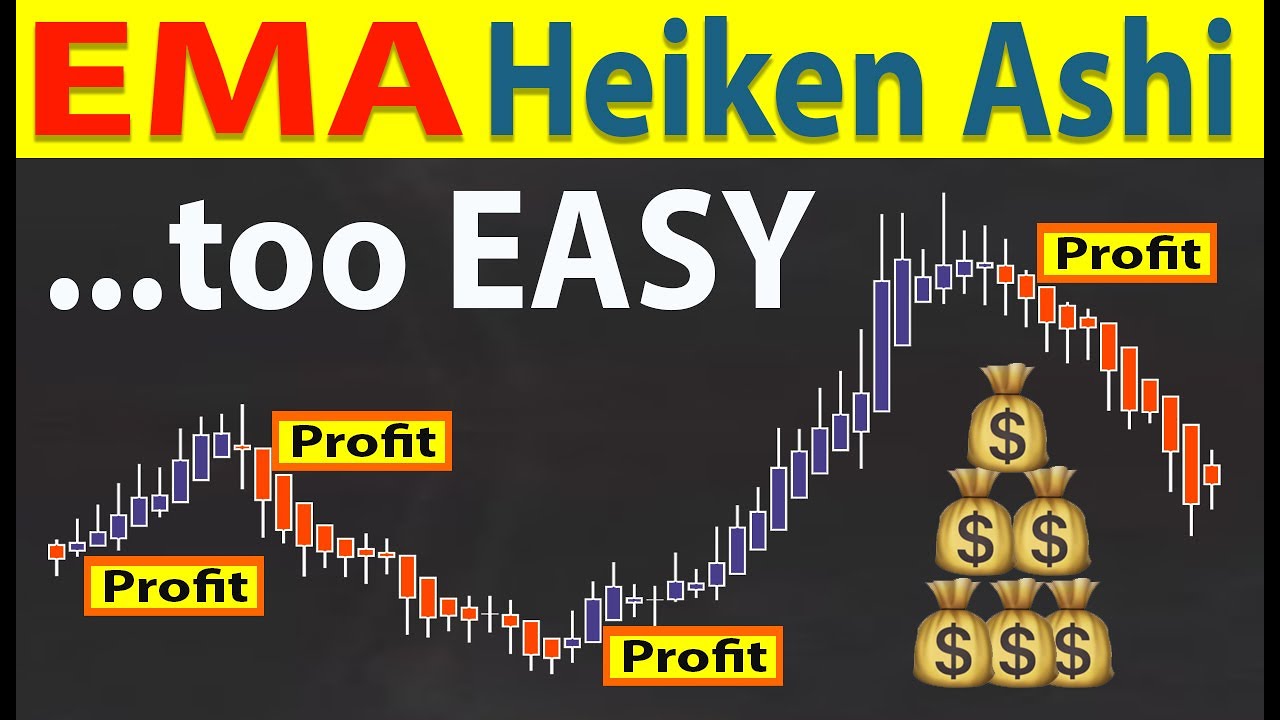
average calculation moving average method two choose the moving average type to use in the calculation period two the number of bars to use in the second moving average calculation you can also identify the colors of the candles up bullish candle blue down bearish candle bread one of the key characteristics the high kanashii smooth candlestick is that usually both in an uptrend or downtrend the candles have very little but in most cases no lower shadows while it poses extreme upward or downward interpretation the general rule of thumb is that the markets are in an uptrend when
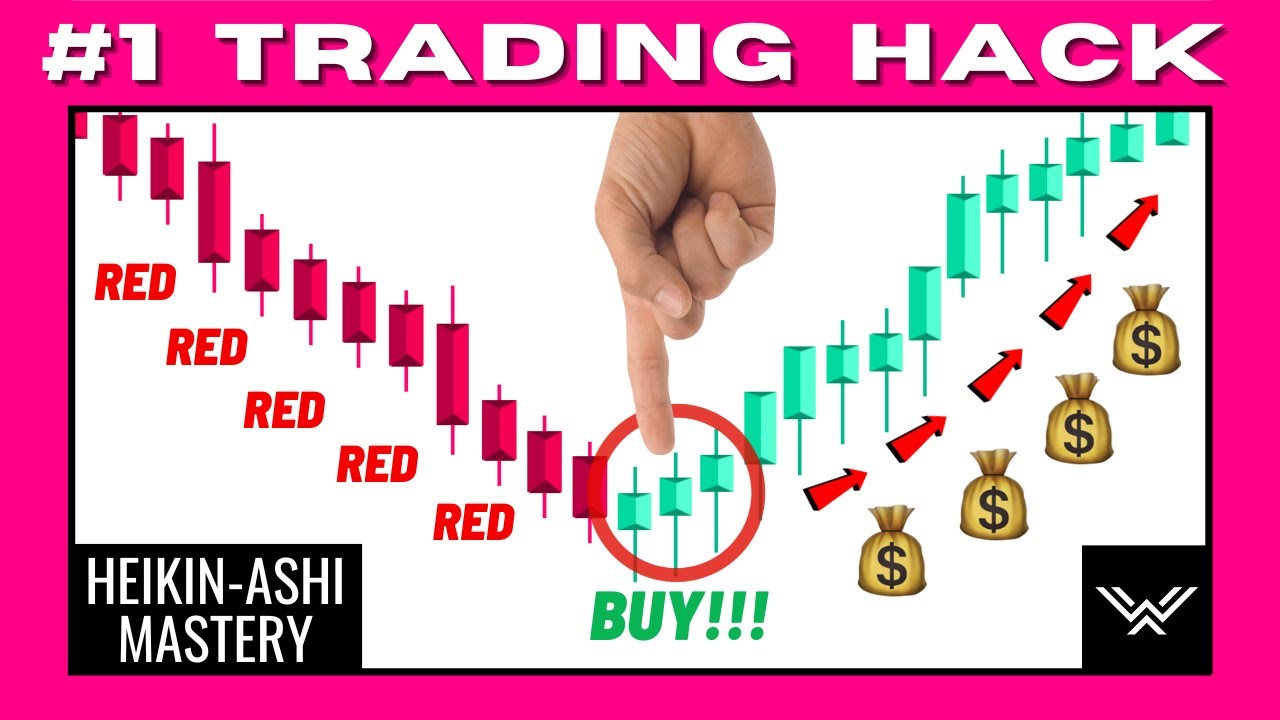
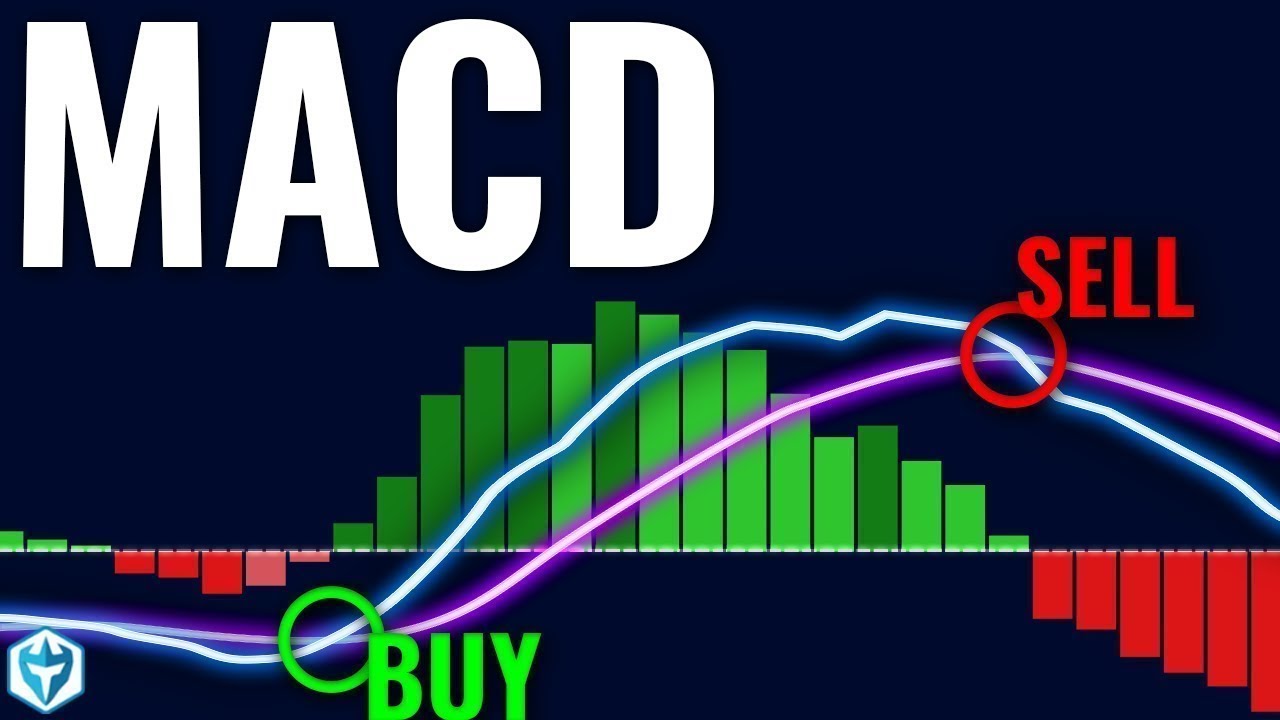
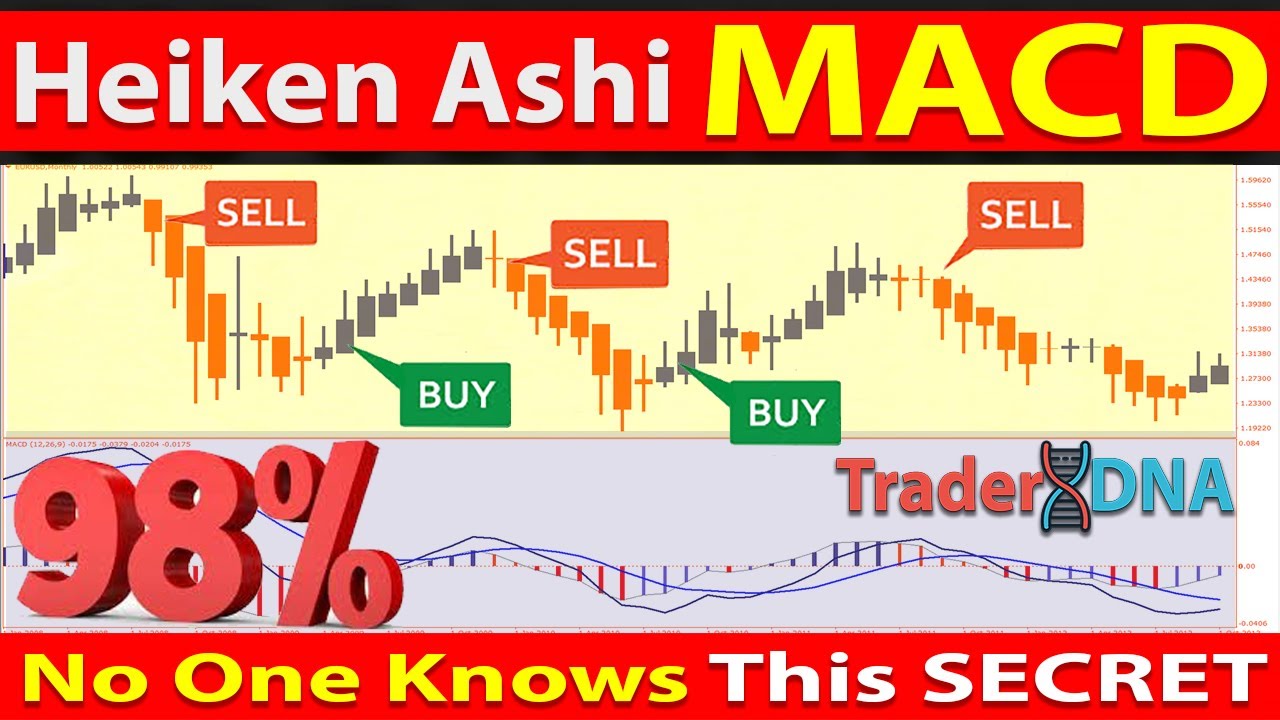
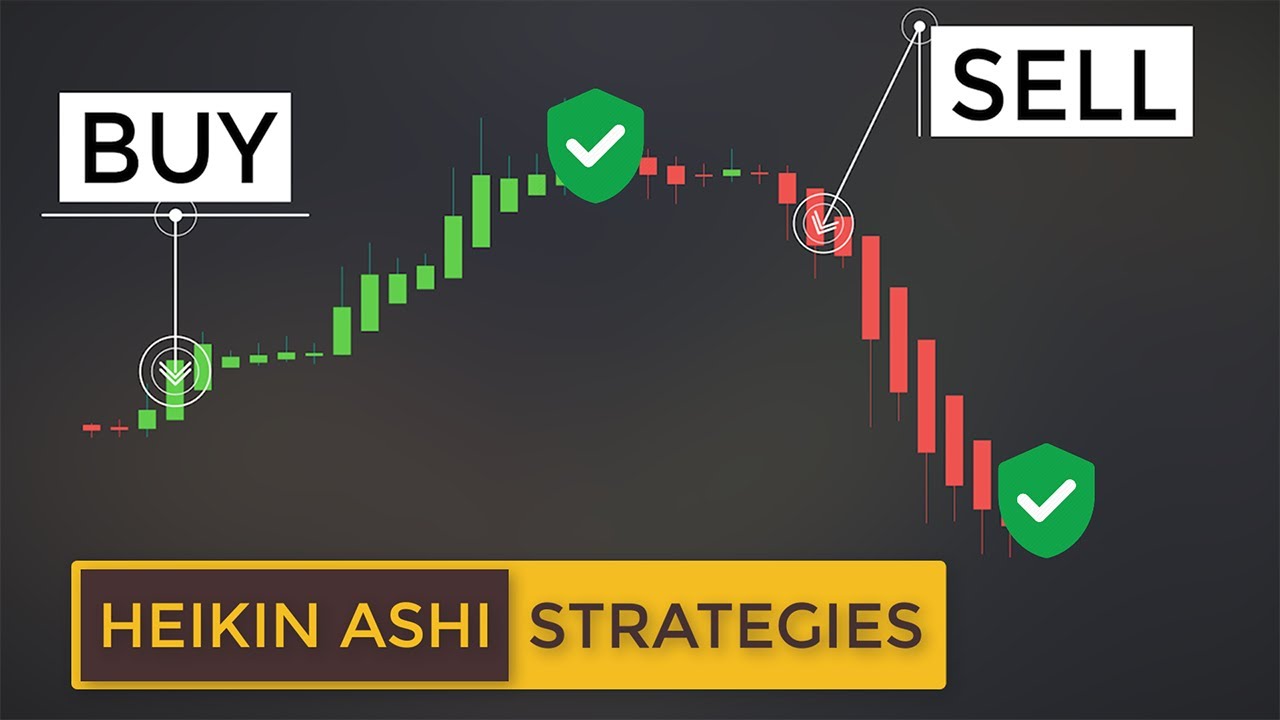
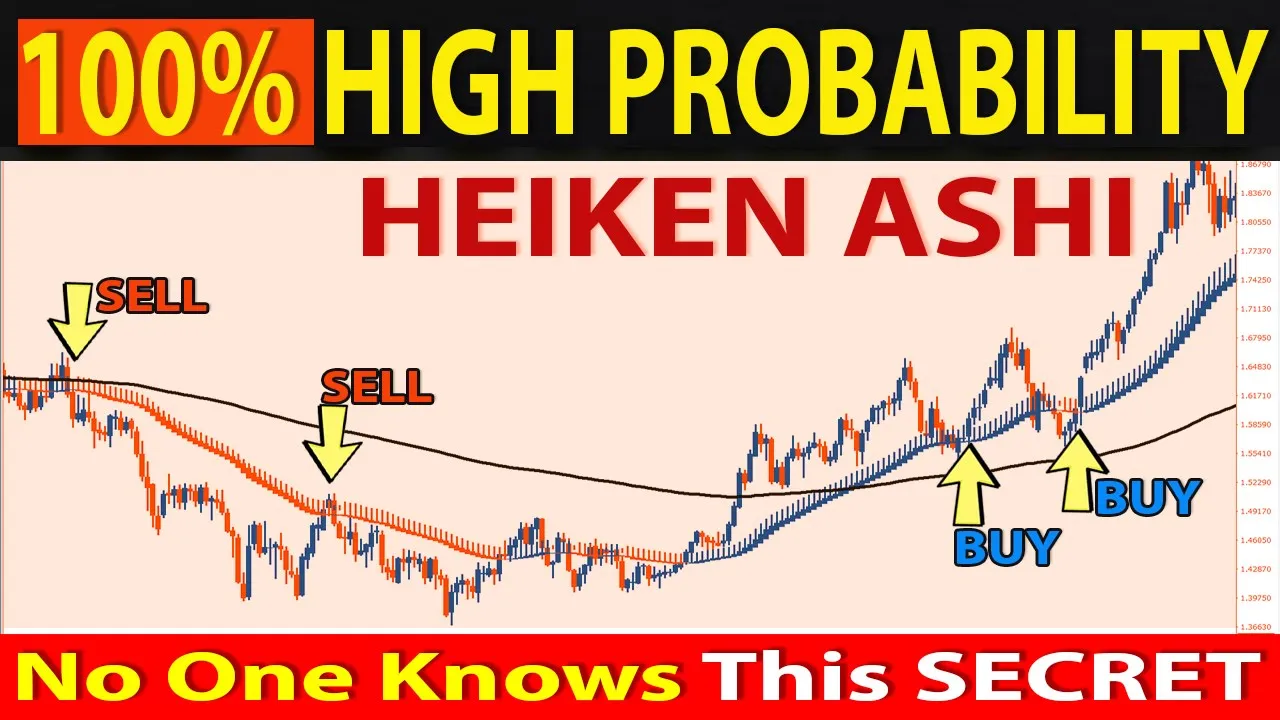
the smoothed heikenashi indicator is bullish for blue and the markets are in a downtrend when the smooth high canashi indicator is bearish or red buy and sell signals are generated based on this rather simple observation you can see that the smoothed haikanashi indicator shows the rising and falling trends with relative ease how to use the heiken ashy smooth indicator one of the major rules of using this indicator is in determining the trends in the markets it is a widely accepted principle that the trends change when you see two or more heiken ashy smooth candlestick in
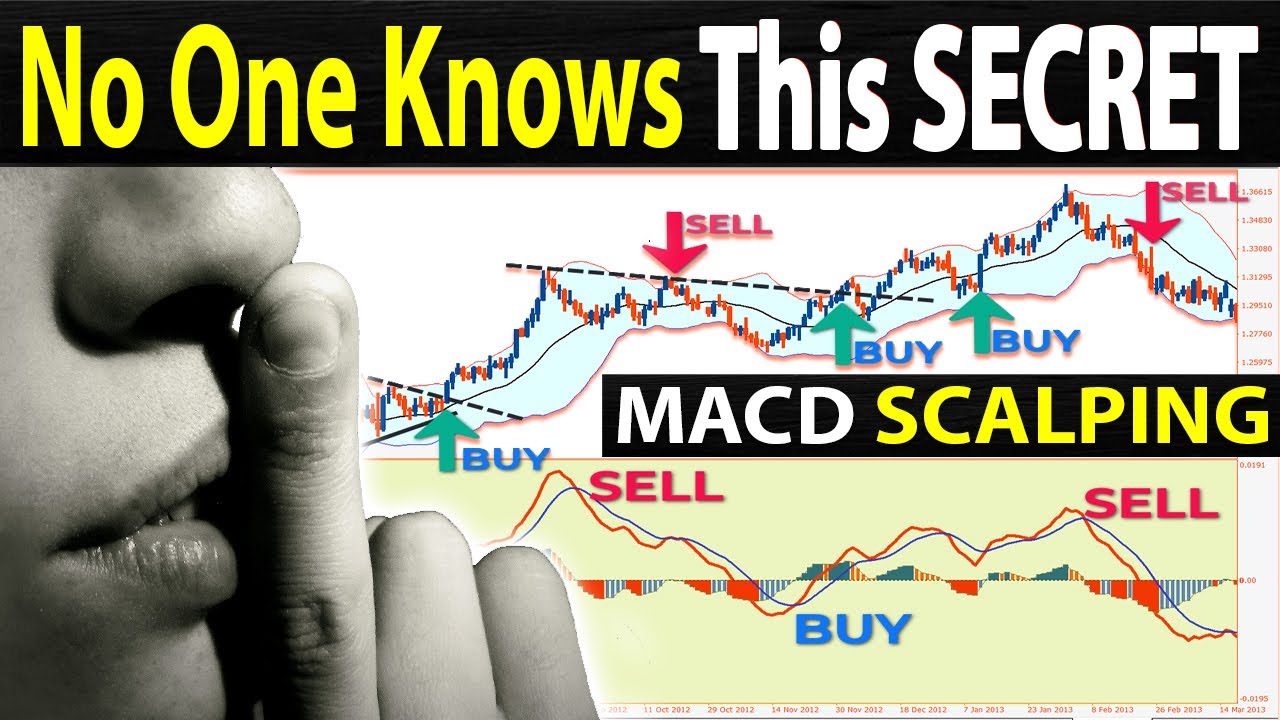
the opposite direction or color this is where traders either prepare to take an entry in the direction of the trend or the color or they can use this to adjust their stops bullish and bearish signals are generated when the moving averages mark a golden cross or when the short-term moving average cutting across the long-term moving average to the upside and the death cross or when the short-term moving average cutting across the long-term moving average to the downside but as with any trading strategy using just one indicator will not give you the market perspective this is
the same case with the haikanashi smooth indicator as well you will probably need to use other methods such as price action to determine the best momentum in the price of a security conclusion in conclusion the haikanashi smoothed indicator is a versatile trading indicator that can be used to build a new trading strategy or it can also be used to complement your existing trading strategy the hike and ashy charts are a great way to get a different perspective of the markets it can help you especially when the trends are strong and can also depict ranging markets
when you can see the high kanashii candlesticks changing color but price trading flat price action trading strategy with smooth heiken ashi indicator the high kanashi smooth indicator is really an indicator designed as a standalone trading system but in order to improve the performance of the indicator we're going to add the 200 period moving average because the 200 ema is considered to represent one of the most trusted moving averages going forward we're going to lay down an effective price action trading strategy using the hikinashi smoothed indicator in combination with the 200 period ema in this video
i've included a template with the system that you can simply upload to your chart and it will automatically plot all these indicators perfectly on your charts so there's nothing for you to worry about get the download link on the description trading rules only by above the 200 period ema once you have smoothed haikanashi candles pointing to the upside conversely we're going to sell only below the 200 period ema once we have smoothed haikanashi candles pointing to the downside please ensure you fully test the rules so you can do them without thinking selling rules or short
position rule number one twenty period smoothed heiken ashi crosses the 200 exponential moving averages to the downside rule number two wait for price to rally back to the 20 period smoothed heiken ashi rule number three wait for an obvious price action confirmation cell signal or up to form in the market once you enter the trade you can set an initial stop loss above the previous smooth taikanashi candle buying rules or long position rule number one 20 period smoothed heiken ashi crosses the 200 exponential moving averages to the upside rule number two wait for price to
rally back to the 20 period smoothed hikanashi rule number three wait for an obvious price action confirmation by signal or setup to form in the market risk reward ratio in many cases market strategists find the ideal risk reward ratio for their investments to be approximately one to three or three units of expected return for every one unit of additional risk here are other examples of the heiken ashy smooth price action trading strategy to fully understand this wonderful strategy and to make the most out of it [Music] [Music] do [Music] so [Music] so [Music] [Music] [Music]
[Music] so [Music] [Music] technically speaking you can use this indicator for all time frames however the shorter the time frame you will see more fluctuation and possibly more whipsaw which may cause small losses that can eat up your portfolio quickly as always if you learn something new or if you want more videos more often make sure you subscribe click the notification bell and share this video across your whatsapp facebook accounts or twitter to show your support see you next time [Music] so [Music]