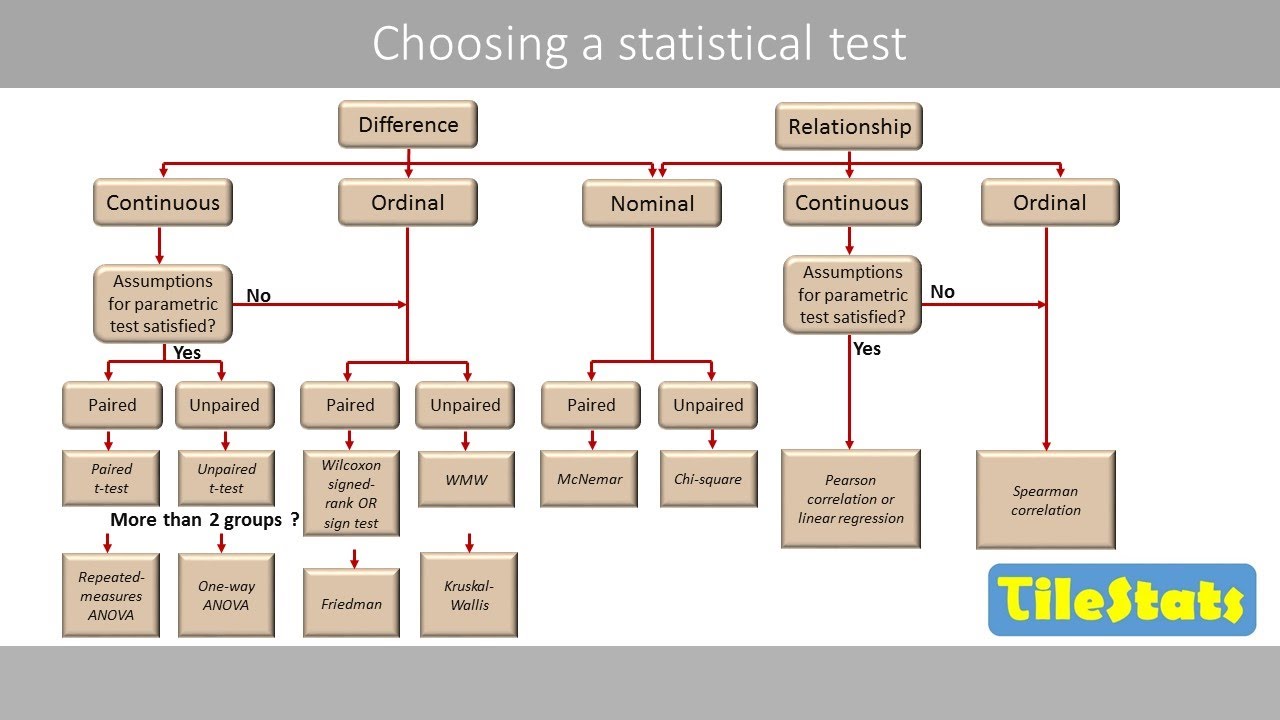
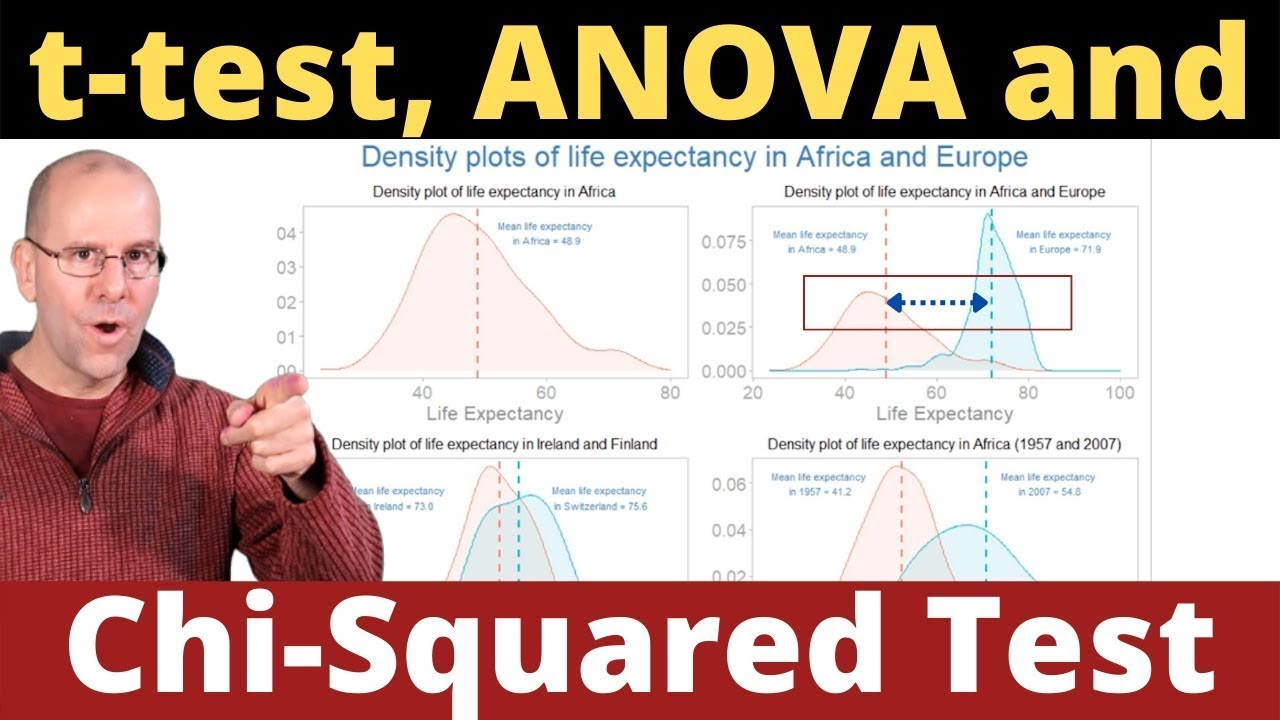
Now we think we can run the respective t-test as long as we know which one to use either pair samples t-test or independent samples t-test, depending upon the relationship between the groups being compared. However, it is not as straightforward as we wish them to be. The t-test we have talked about so far is one of the parametric tests.
The parametric test makes certain assumptions about the parameters of the population distribution from which the sample is drawn. So this is often the assumption that the population data are normally distributed and which is known as normality assumption and when the assumptions are met, then we can run the respective parametric t-test. However if any of the assumptions are violated and we run the test by just ignoring the violation and the resulting stats and the respective p-values will be inaccurate and which will lead to the wrong conclusion.
On the other hand, non-parametric tests are distribution-assumption-free and as such can be used for non-normal data. So in case the normality assumption is violated then we can switch it to the respective non-parametric test to achieve only the significance testing. So here are the assumptions you need to check before you can run the independent samples t-test.
So the the first assumption is that your data for both groups that you are trying to compare should be measured at least at the interval level. because you need to be able to calculate the mean and this is actually the same for the dependent samples, the paired samples. For independent samples, we have two other assumptions you need to check.
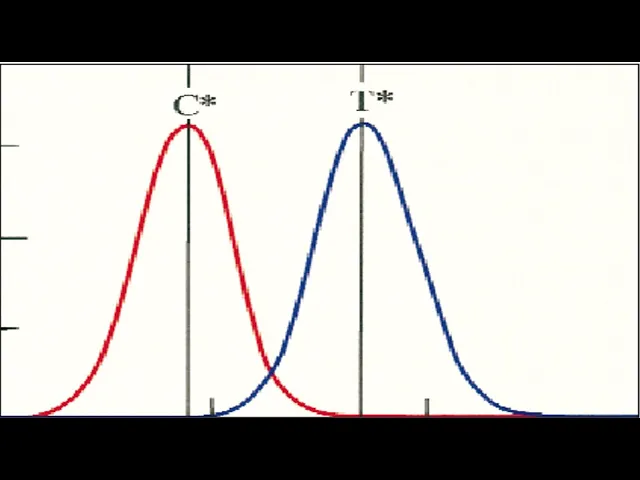
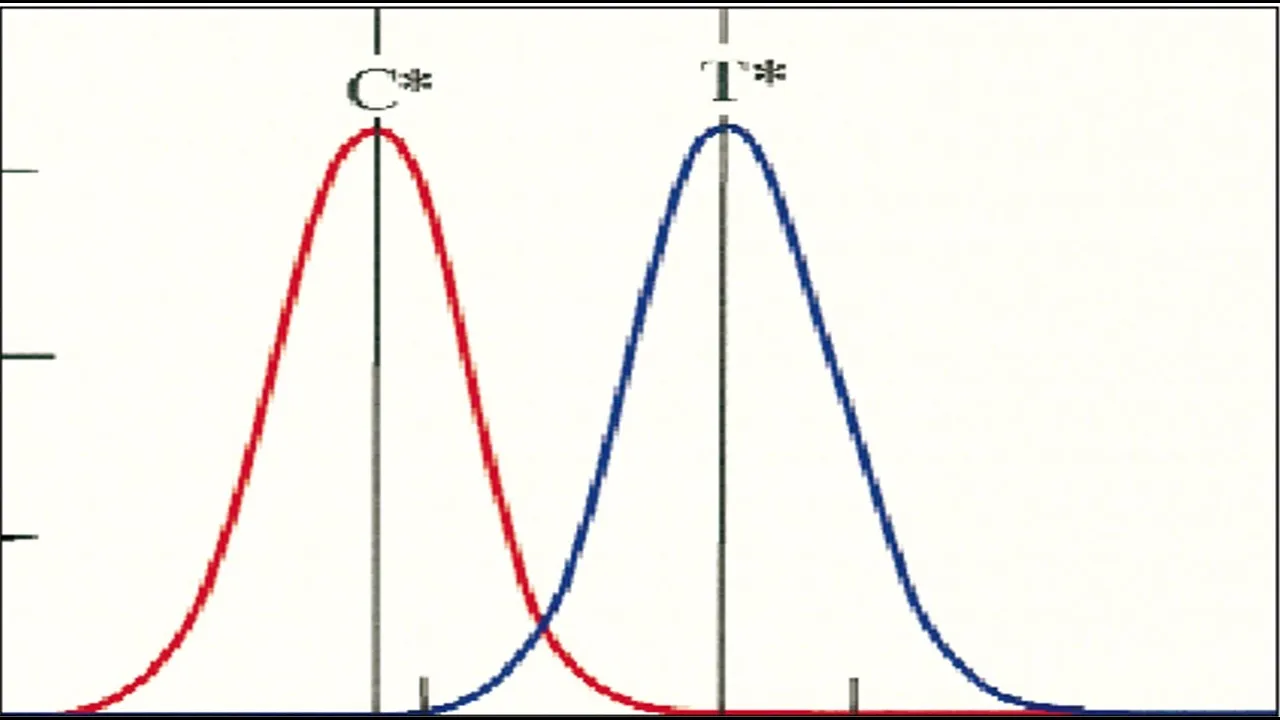
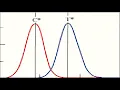
The first is the normality assumption. So both data sets should be normally distributed as you can see from this picture. So just let's just assume that any symmetrical distribution is normally distributed so here the distributions are normally distributed and that's what is presented here so the x1 bar is the sample mean of x1 and x2 bar is the sample mean of the second group.
So both of the data should be normally distributed and the second assumption is what's called equal variance assumption. So both sets of data should be similar in terms of variances or the spread. So the spread is represented by the width of each distribution.
So even though they are different distributions, as long as they are normally distributed and also their spread is kind of a similar each other and you can run the parametric independent samples t-test. So to illustrate this assumptions further, so these graphs show distributions of data from two independent groups and there's at least one violation of the two assumptions is going on in this case. So in fact they are exactly the same distribution but it is not normal right because we see this as skew the distributions are not symmetric around the centre.
So we know that the normality assumption is being violated in this case but because they are exactly the same distribution and we can see that the assumption of the equality of variance is okay, the variance should be the same between the two hypothetical population distributions. So in this case the normality assumption is violated. On the other hand, so we have another two different hypothetical population distributions in this case both assumptions are violated here so this one is not normally distributed and even though this one is so the nominal assumption for the independent samples t-test now both groups should be normally distributed right if one of the group is not normally is not normally distributed then the nominal assumption is violated for the independent samples t-test and looks like the equality of variance is also you know violated here right the spread between the two distributions doesn't look the same.
So in this case, we have the violation of both assumptions. So in this case you need to choose the respective non-parametric alternative. And finally it seems like these two groups are normally disputed i'm assuming that they're symmetrical around them in a centre and but in terms of variance they look different.
This looks much slender compared to the population too. So we can see that the equality of variance assumption is being violated whereas the nominality assumption is okay. So I hope you now understand what it means to test the normality or the equality of variance between the two groups but this is not how we actually check those assumptions in practice.
There are different ways to check the normality assumption and equality of variances and mostly we're going to use a statistical way to check the normality and the equality of variance. So that was assumptions for the independent samples t-test but we have another t-test, paired-sample t-test which has slightly different assumptions and actually it's simpler than the independent samples t-test. So like the independent samples t-test, the data are should be.
. . they should be measured at least at the interval level because again you need to be able to calculate the mean and for the dependent samples and the paired samples you only need to check the normality assumption but in this case it is the normality of the difference data set between the groups or conditions that are being compared.
So in this case it doesn't matter if this group is normally distributed or this group right you're not checking the normality of each group if they are related. What you need to check is to is the normality of the difference between the two. So here so before you check the normality what you need to do for the paired samples is that you take the difference between the two groups and have the difference and then that difference data, that's the data you need to check the normality.
That is the difference between the paired-samples t-test and independent-sample t-test and for paired-samples because we only have difference data, single data So there is no equality of variance check because there is no other data to compare the variance with. So that is the only assumption you need to check for the paired-sample t-test. So now let's look at how to check the normality assumption.
As I said, many parametric inferential tests like t-test are built upon the assumption that the values of interest in the population are normally distributed. However, we typically do not know the shape of the original population distribution from which our sample is drawn so what we do really is to check the normality of the sample instead, assuming that a sample from normally distributed population will also be normally distributed. So in general, there are two ways to check the normality of data either visually or statistically even though Jamovi can do both but we will only cover the statistical way to check the normality assumption because this is not the actual test anyway and also we just need just one result to show that you did check the assumption (sorry about the cut off).
So there are different tests you can use to check the normality and there's a different ways to actually bring up these tests in Jamovi but I recommend so you only need just one of them and one of them is enough and I recommend to use Shapiro-Wilk test and so the statistical way to check the normality assumption is actually subject to the same null hypothesis significance testing principle because these are the statistical tests too. So here the null and the alternative hypothesis are the following: the null in running the normality test is that the sample data are not statistically different from normal distribution or the sample data are more or less normally distributed. That is your null right so the alternative then the sample data are statistically different from normal distribution.
So this is a consistent with how you set up null and alternative hypothesis. So null is typically set up as there is no difference. So there's no difference between your data and normal distribution and the alternative is that there is difference between your data and normal distribution.
So in this case, you make this same decision,. . .
the decision rule is still the same. alpha 0. 05 so once you run say the Shapiro-Wilk test then it'll give you the statistics and the respective p-value of the Shapiro-Wilk test.
So you look at the p-value and compare it against alpha 0. 05 and if the p-value from Shapiro-Wilk test is less than alpha . 05 then you reject the null right what that means is that you reject the null and that means you have strong evidence to support the alternative hypothesis which in this case you're in trouble because then that is saying that the normality assumption is violated you're saying that your data are statistically different from normal distribution which is not what you want if you want to run the parametric t-test so p value is greater than alpha 0.
5 then that is when you say the normality assumption is met because now you fail to reject the null of no difference right so now you can say that your data are not statistically different from normal distribution. So in other words, it is more or less normally distributed. So that's what that means and you know this is how to report the result from the Shapiro-Wilk test so you have to report this whenever you run parametric t-test or any parametric test actually wherever you need to check the normality assumption.
so the S-W, the Shapiro-Wilk normality test show that the data are significantly or not significantly deviated from the normal distribution with p equals such and such. So you need to report the exact p-value wherever possible if it is not then you can just say either it's greater than or less than alpha 0. 05.
That's all you have to say you don't even have to report the statistics of Shapiro-Wilk test. Snd so let's just look at how to run the Shapiro-Wilk test in Jamovi. So what I have here is the previous pilot data, the pilot visual acuity and American jet fighter visual acuity.
So let's just look at if this data are normally distributed or not by running the Shapiro-Wilk test so if we go to analysis tab, go to exploration and descriptives, see we have under statistics there's normality and it has Shapiro-Wilk test. So you just tick this box. In fact, let's just do the Q-Q plot.
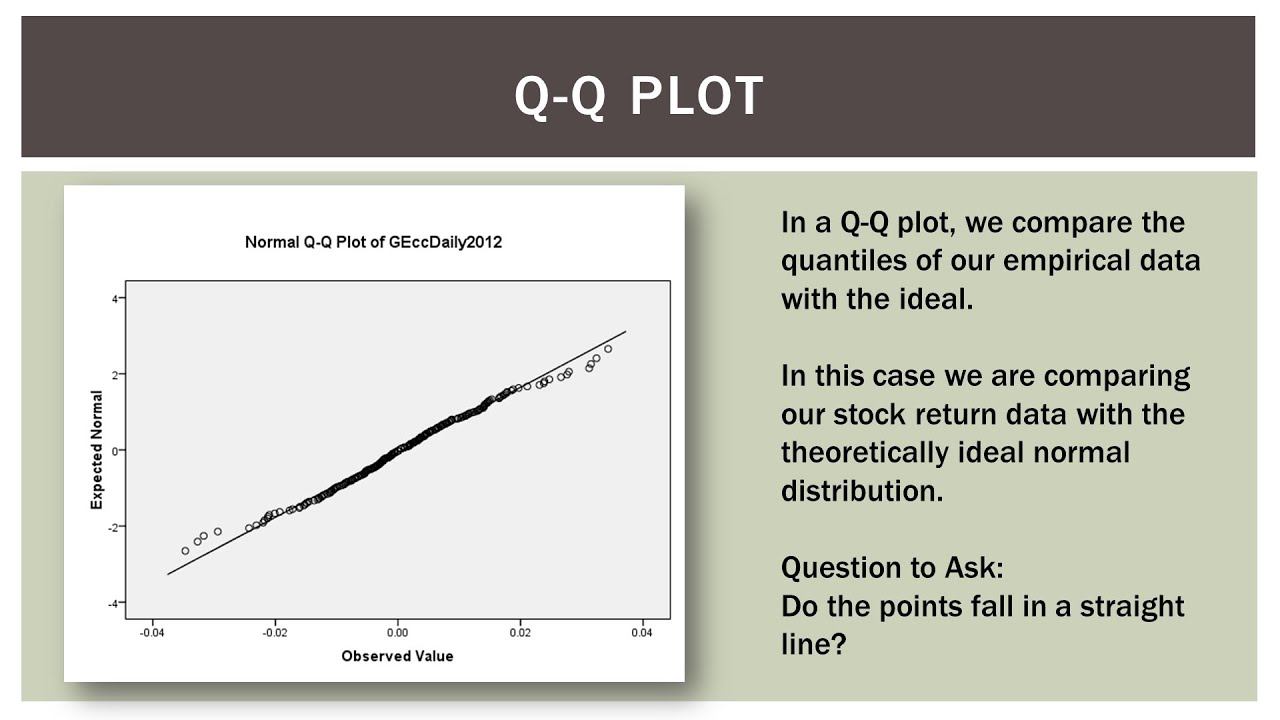
you don't have to really know this but just for the sake of illustration, I'm just showing you that you can do both in Jamovi. Now you move the variable and it'll give you the result. so this is a Q-Q plot and so what's on the y-axis is the standardised residuals which is deviation from the theoretical quantiles so this is kind of a perfect normal distribution and your data are standardised so this is actually your data showing the standardised deviation from the theoretical quantile.
So if these dots are clustered on this one-to-one line, this is what is called an identity line and then you can see that your data are more or less normally distributed. They are almost perfectly aligned on this line except for the few dots at the both tail ends but these are the tail ends of the distribution and it is typically the case that you see most deviation is coming from the tail ends but even the tails it looks good pretty good I mean it is just natural because the data are actually simulated from the perfect normal distribution anyway so it is only given. here we go.
I see okay so it is only attached to so you cannot just request the Shapiro-Wilk test only so let's just have other descriptive statistics yeah so that is only when so you need to actually request basic descriptive statistical quantity and then you can request the normality check and it's kind of strange but well now we have our Shapiro-Wilk test result. So Shapiro-Wilk W, so W is the statistics of the Shapiro-Wilk test which is 0. 998 and the p-value, the respective p-value that you will see this statistics is this which is p equals 0.
927. So if you compare this p-value against alpha 0. 05 then what do we do?
We fail to reject the null so that means the data, the pilot data, pilot visual acuity data are normally distributed and this is how you check the normality using Jamovi and this is only for the single variable but all these t-tests actually have the option to check the normality. See now See? Assumption checks, normally test, Q-Q plot, homogeneity test, so homogeneity test is the homogeneity of the variance, equality of variance test and you need to have two variables right two groups because this is for the independent samples t-test.
What about paired-samples? Again it comes with the assumption check right so all you have to do is just to tick the box the normality test and again you need to have two variables two outcome measures from different groups or conditions to be able to check this normality. So what do we do when the normality is.
. . normality assumption is violated?
So if that happens, so what that means is that your Shapiro-Wilk test result, p-value is less than alpha 0. 05 that means the normality assumption is violated if that happens then you have to choose the non-parametric alternative to the independent samples t-test which is called Mann and Whitney test. Jamovi also has this test equipped under the independent sample t testing procedure so it is just a box to click to get this test result and also even if I mean well you do not have to check the normality when you have a very very small sample size like four to eight because the normality assumption check the normality test is really checking the distribution of the data and but if your sample size is just is you know small like this then there is really no distribution to check.
So do not even bother to check the normality when the sample size is this small and just go straight to run the non-parametric alternative to the independent samples t-test. So for independent samples t-test you need to check the equality of variances too but that is an additional assumption that you need to check and this is also known as homoscedasticity or homogeneity of variance assumption and this is only for the independent groups, the between-subject data right you don't have to check this assumption for the paired samples right and to check the equality of variances another statistics called the Levene's statistics is used and again because this is a statistical test, this is subject to same null hypothesis significance testing procedure so what you want to show is that the variances in each group should be roughly equal statistically speaking so the null is that the variances in each sample is not statically different or that they're the same right they're not different and alternative hypothesis is that the variances in each group is statistically a difference so this is a consistent with how we set up null and alternative hypothesis okay but this is not in a serious assumption when it is violated compared to the normality assumption violation if it is violated then there's another parametric test called Welch's t-test which takes account into the differences in variance between the two groups. So let's just look at how to run this assumption check in Jamovi.
So here is another familiar data set sample logMAR data which we already have looked at before. Now we have three outcome variables which are visual acuities in different eyes. So right eye visual acuity, left high visual acuity and both eye visual acuity and we have one grouping variable which is gender so if you are to compare these outcome variables based on the gender then this is an example of independent samples t-test because the male and female these two groups are independent to each other.
You cannot be both male and female at the same time at any given time. So this is an example of independent groups and to check the equality of variance then. .
. Before we run. .
. Student's t-test, By default it'll run the Student's t-test that is our parametric independent samples t-test and we also have the option to run Welch's t-test in case the homogeneity test so this is the homogeneity of variance test right Levene's test in case this assumption the homogeneity of variance is assumption is violated then you can run the Welch's t-test when do we run Mann-Whitney U-test? That's when the normality of the data is violated right so that's the normality so let's just tick this box and see what it is giving us.
So let's just throw in the right eye and split by gender that is our grouping variable and there is the homogeneity of variance test so it's just another assumption check right and it says Levene's and so this is a Levene's test so F is the actual test statistics of Levene's test which is 1. 53 and degrees of freedom is one so this looks like a two minus oh no oh this is the between-subject, between-subject term and this is error term right this is actually the total number of data minus two and this is the total number of groups minus one right and then the resulting p-value so the likelihood that you will see the statistics as extreme as this one or more extreme is this 0. 219.
Now you compare this p-value against alpha 0. 05 and what do we do? this p-value is greater than 0.
05 right so we fail to reject the null of no difference in variance. So that means the equality of variance assumption is actually met so we're safe with this assumption. So let's check the normality assumption well we're going to just take a look at this next time but the normality test in this independent sample t-test is a little bit different because it is giving you only a single Shapiro-Wilk test result so the way Jamovi tests the normality of the outcome variable is a little different but there is kind of a different way to test the normality of each group data.
But it should give you the same result in terms of normality test but at this point I just wanted to show you how to check the equality of variance using Jamovi for the independent samples t-test.