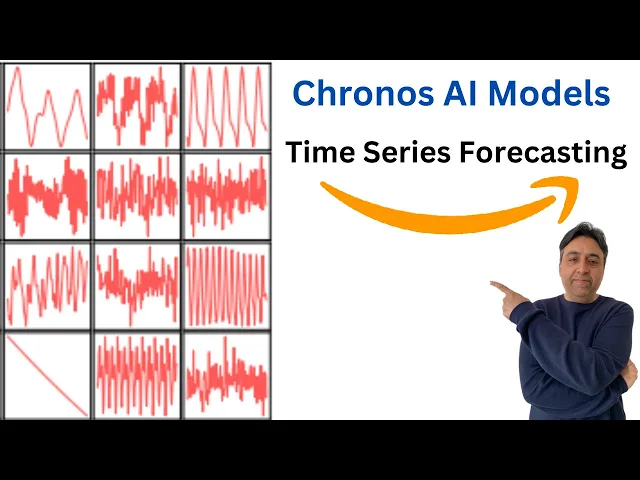
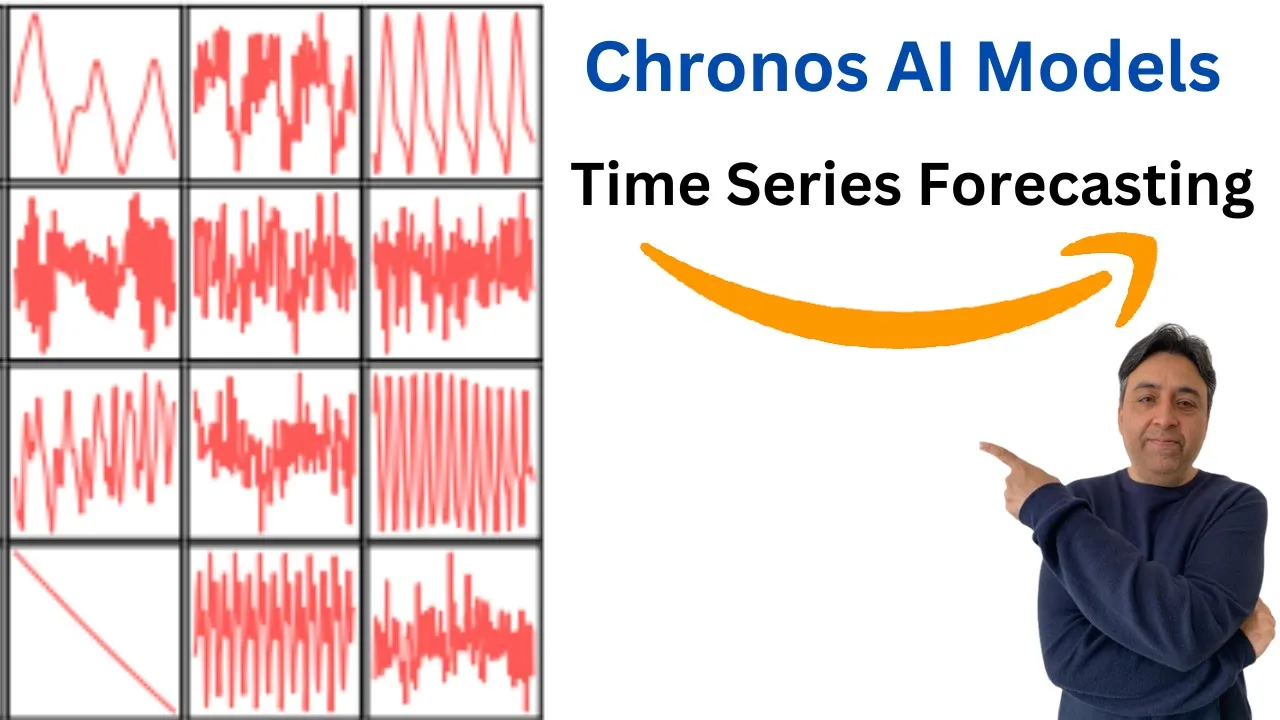
with the Advent of generative AI time series forecasting has become an area of quite an active interest over the last few months Amazon has recently released Kronos which is a framework or a family of models that adapts existing language models for time series forecasting tasks Kronos works by first quantising time series data to make it compatible with language models this quantized data is then fed to a pre-trained language model which learns to predict future data points unlike traditional methods Kronos uses categorical cross entropy laws allowing it to learn arbitrary distributions that may better represent unseen
data on your screen you can see the GitHub repo of the Kronos models I I will drop the link to it videoos description also you can find the Kronos models in various sizes on the hugging face for example those sizes are gronos T5 tiny 8 million which we will be installing today on our collab and we will also do the time series forecasting with it then they have uh Mini model small model base and large model the large model has 710 million parameters this whole Kronos thing is based on This research which is quite interesting
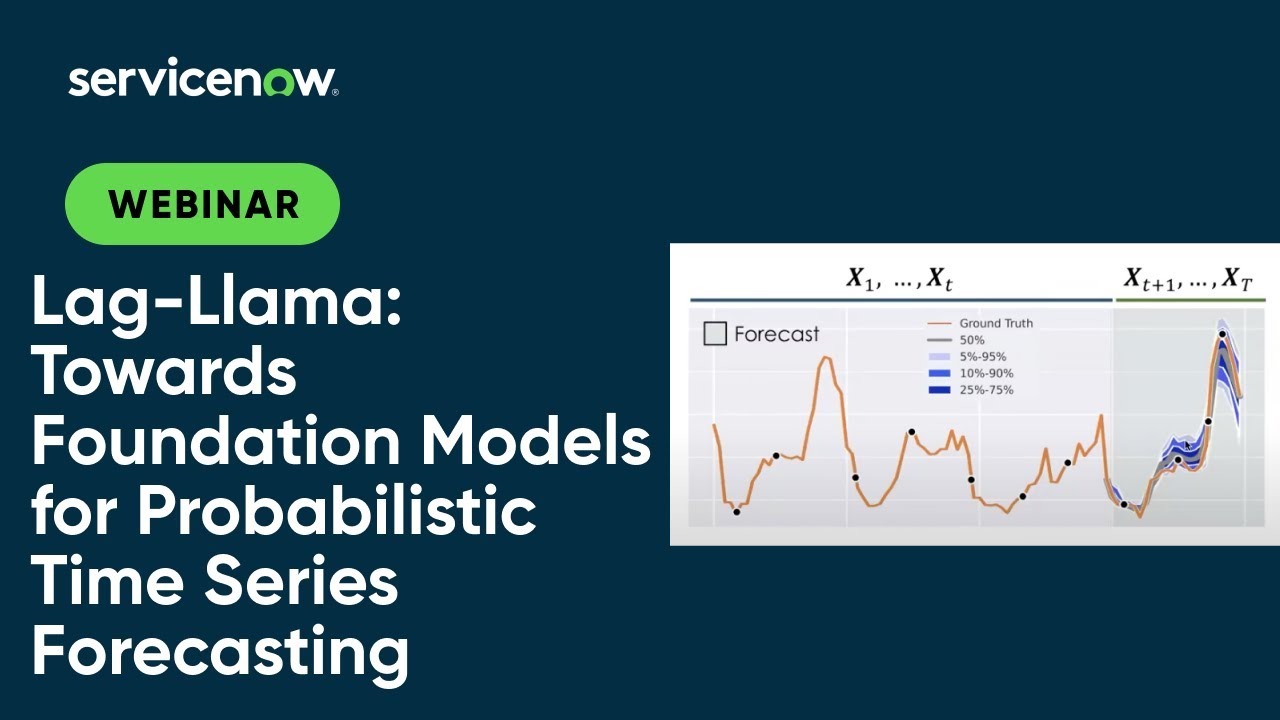
Kronos offers a userfriendly and relatively faster framework for adapting language models to time series forecasting compared to Alternatives like lag Lama time L llm and various other time series forecasting llms while Foundation models enable zero short forecasting they still fall short of data specific models in terms of performance due to their computational cost and time requirements despite the potential of Kronos framework data specific models currently remain Superior for more forecasting task now repurposing llms for General time series forecasting has been really good development in my humble opinion because this area still needs a lot of
innovation so let's see how can we get this uh Kronos D5 tiny installed on our Go app you can use the same instructions on your local system and then we will will be also plotting it out the data which I'm going to use for this is also a public data from Amazon this is a CSV file which contains month Wise from 1949 and the number of passengers only two columns and this is from 1949 to 1960 as you can see on your screen so this is the time series data which we will be fitting into
our model and then from there we will do that forecasting on the basis of fit so let's go to the Google collab and I will be using the free version of Google collab first let's change the runtime D T4 GPU and quite generous of Google to offers that this is really big of them first thing we need to do we need to get clone this repo and you will find these instructions in the GitHub repo which I will drop the link in video's description so let's quickly put an exclamation mark here and run it it
is is going to install all the prerequisites which are required I think I was doing it earlier so let me cancel my other session that is done hopefully this will work now okay this time it is working so let's wait for it to finish it is going to install lot of things including Nvidia Tron and pytorch so so and it takes around 3 to 4 minutes all the prerequisites are done now let's import all of the libraries which we have just installed now if you look here the we are using uh mat lab like plotting
with the help of this matte plot lip and then we are importing numpy Library which is used for numerical Computing with python and it is normally alas is as NP and then we are also importing the pandas is another library that provides high performance data manipulation and Analysis tools um using data Frame data structure and then we are importing torch which is another open source machine Library primarily used for deep learning tasks it also provides multi-dimensional array and tensor computations with GPU acceleration and then we are importing Kronos pipeline this is the class from Kronos
module and it is used for time series forecasting quite um frequently next we are importing or initializing the pipeline and we are also loading the Amazon's Kronos T5 tiny pre-trained model and also we are specifying that computation comput computation should be performed on GPU which is Cuda and that torch tensors should have the data type of floating point B floating point I think that the brain float 16 so let's do it it is going to load the model which is just very very small around 33.6 Meg very very small model and then let's get our
CSC file which contains the data and we this is a file which I already showed you and we are using pendas to get it into the data frame that is done and then let's also get the context or we are going to so here what we are doing it we are getting the context which is primarily we are creating a py tensor and the tensor's name is context and we are only getting it from the passengers column from the data frame which we defined Above So this column contains historical data of air passengers so let's
do it that is also done and now let's set the prediction length we are setting the prediction length to 12 and it indicates the number of time steps into the future to forecast so that is also done and now let's specify our forecast now if you look here what is happening that um this line is creating and this line is generating forecast using the predict method of the pipeline object and it takes the context the historical data and the prediction L as input and return the forecasted values let's wait it takes bit of a time
not much but still bit that is done and now let's specify uh our index for the forecasted value starting from the length of the data frame DF and editing ending at the length of DF plus prediction length that is done and now let's calculate the 10th percentile which is low and median which is median and 90th percentile which is high of the forecasted value using NP do quantile the forecast value are converted to a numpy array with num before calculating the quantities that is done and now let's create a new figure for plotting with specified
size of 8 into 4 in which is quite usual that is done and now once that's done let's create a uh let's plot the historical air passenger data from the DF data frame in blue color and then also add the label by simply using this command and you can see that I'm using royal blue here so let's wait there you go so we have plotted it and this line is plotting um the historical air passenger data from the DF now let's also plot the median forecasted values against the forecast index so let's and we'll be
doing it in red color as you can see the tomato color there you go and this is a forecast and now let's also fill the area between the 10th and 90th percentile forecasted value with a semi transparent red color and you can of course play around with it as you like there you go you can also display the legend if you like this is a legend we are plotting and then let's also Define the grid there you go so this is a grid we are defining and we can also show it off if you want
to show the whole plot there but we are already showing it so it's already shown so this is how you can download and install your uh time series forecasting model then you can feed the data to it create the data frame create the forecasting index Define the low and median high percentiles and then from there by using that Matt plot lip Library you can simply draw it out so it is as easy as that I hope that you enjoyed it if you have any question or thought let me know and I'll be happy to answer
if you like the content please consider subscribing to the channel and if you're already subscribed then please share it among your network as it helps thanks for watching