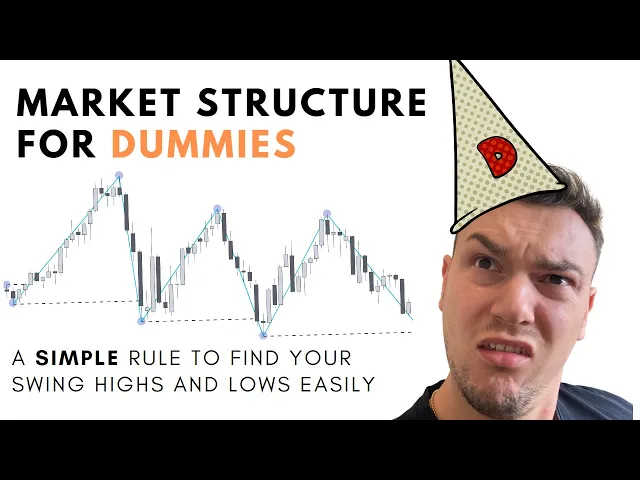
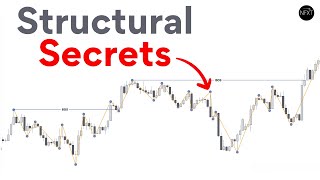
in this video I'm going to be giving you the most mechanical no-nonsense way of mapping your structure because I've seen loads of mapping structure videos and they do not tell you why your eyes are high why low is a low why a break is a break they can't tell you it but I'm gonna I'm gonna do it in this video watch it now [Music] [Applause] look at this zigzag line what does it represent well it represents price on a chart and in that price you can see we have lows and highs and lows and highs
all over the place so what we're going to do in this video is to establish what swing structure is so if we can establish significant swing points that is a good start so if we take the first low which would be the start right here and the first High that's formed okay right here we can say that that is a swing low and higher why because it's all we've got if we rewound price to this point it would be this low and this High okay and then we form another low and break that high okay
so we have our first break of structure here this swing swing low is formed after this previous swing high is broken now we have a new swing High when price starts to pull back you can see here we develop a high a low a high a low are these all swing highs and lows no because swing highs and lows are only created after a break of structure so you can see this was the previous swing high this was the previous swing low which gets broken first we can see it's a swing high right here okay
so we have our high we then have low high low what is the lowest point before this High gets broken well this would be the lowest point so this is a swing low not this nothing was broken here this is a type of structure but not something we're going to be getting into in this video okay then what happens we have a break of structure again right here okay so now price comes down comes up comes down okay we have our swing low and I'll swing High which gets broken first well I can see the
swing low doesn't get broken till over here the swing High if it's broken earlier here now we have all this between the swing low and height that break there so yeah you can see we have low high low high low high low high low high but our swing structure remains this high this low which is the lowest point and then this High which came after the break of structure this is all secondary structure it's either internal or substructure not swing structure okay so next up price which down comes up and come down we then have
another break okay if this was the swing low this was the swing High the swing high is broken before the swing low here you can see this is a bullish trend next up what happens next we have our swing low and I'll swing High we get a break of the Swing Low we switch to bearish bearish swing structure okay then price comes down comes up crazy high crates are low crates are high breaks the swing low okay so this is our highest point before that swing low break so if we go back and label our
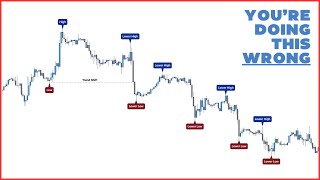
swing points here what we would see is we had swing High swing low swing High swing low swing higher swing low swing High swing low swing High swing low swing High and then potentially swing low as soon as it starts to pull back Okay so that's our swing structure it's um if we marked it on as a line it would be like this this is our swing structure movement everything in between that is is you know we can just consider it for the moment noise this is the actual movement of price that's going on okay
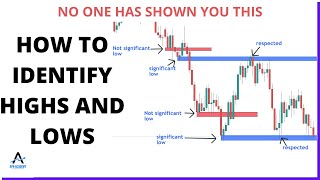
so I hope that's cleared up swing structure so now hopefully we've cleared up in theory what swing structure is and what we're looking for now the problem a lot of people have is when it comes to the actual charts with candles on it they don't know what how to define highs and lows in any way and there are multiple theories on this some people just use their site so they're just looking at this and they'll say right okay well I can see that's an obvious high low high low high low and you know that that
can work to an extent if you're just visual with me that's not mechanical enough that's not rule based and you know it can come into trouble if questioning the small little details um and I want to have a solid answer for that so another thing people use is pit count so if price has moved up uh in a in a bullish Trend and then it stops and it pulls back with some bearish candles they would measure the size of the pullback say this is the bullish move and the pullback starts from here and comes down
to here like measure that how many Pips is it if it's above a certain number of Pips that counts as a valid pullback if it's below it doesn't now I can see the logic in this the problem with it comes when a you have to have a certain number for each time frame that you trade on fine if you only trade in one time frame if it comes if you're trading multiple time frames you have to keep that in mind also another problem is that if you're trading multiple pairs there's going to be variations in
how many Pips uh counts as a pullback so you know that's going to change again if you just trade one pair on one time frame then maybe it's more valid but even then you will find that the volatility of price fluctuates quite a lot from day to day or even hour to hour minutes a minute and so what the London session might come as a valid pullback in the New York session might not because the volatility is different and if there's big news and all that kind of thing and so again not really how I
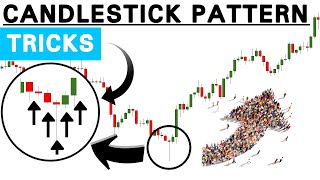
would do it I will now get into the one rule that I have and I've done videos on this before it's the very first video in my channel um but this is like the updated version let's make it as clear as possible and my one rule is that if we have a boost move up or a bearish move down price then stops and then what I call a cemented candle occurs and that's when we have a candle that engulfs the low of the candle immediately to its left so if we look closely at these candles
here we have this alone okay this is the very first candle we then have this candle yes it's a bearish candle but it doesn't close below the wick of the previous candle okay so this is just a continued move up next candle doesn't close below anything it's another bullish candle clearly another bullish candle another bullish candle and then we start having these bearish candles so we have this bearish candle but it doesn't close below the low of the candle so it's left so this is not yet a valley pullback this one also this is the
candle to its left doesn't close below it okay fine then we have a bullish candle okay obviously bullish candle would not close below a bearish candle and then we have this candle here now this candle does close below the candle immediately to its left so now what we can see is that we have created the highest point before this candle which was this High becomes a swing high in this move so we have okay let's mark that on take this we can now Mark that on as our swing High now we look and see okay
when is this swing High broken well it's broken by this candle this candle closes above this candle that's how I Define a break of structure price has to close above the swing High so once that happens that confirms the lowest point before this break between this high and the break what's the lowest point after the cemented candle would be this one right here okay so this is our low so it's the lowest point after the cemented candle occurs so it's not this low here because we hadn't had this candle yet it's this one right here
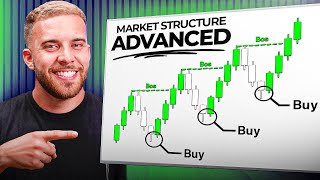
okay so then we have our valid break of structure okay so we have we'll mark this as our swing low because it's the very lowest point on the chart we can't go back any further then we have a high then we have a low and now we have another high this high is confirmed because we get a candle that closes below the candle to its left so we have a swing High created and then we see what gets broken because currently our range now is between this candle and this low and this High okay then
price pulls back and what gets broken next well the high does so we know we are continuing bullishly so now we are mapping structure mechanically using the candles in a very very simple way and showing us where our lows and Highs are actually occurring so we can keep moving up and seeing that after this breaker structure none of these candles closed below the candle to the left we didn't get any cemented highs okay surprise just keeps moving up keeps moving up keeps moving up until this point here where we get that candle that closes below
the camel to its left so our next swing High is confirmed as this one this is the highest point before price cemented okay so now our current range is between swing low because this was the lowest point before price broke up again and a swing High and what happens next the price changed to bearish because we didn't get a break of this high this break of this low came so now we wait for a confirmed swing low and when is the swing low confirmed it's when we get a cemented low so this candle closed above
the candle to its left this candle did not this candle did so now we have our confirmed swing low okay so we have low high low high low high and we get a bearish break low and then okay what happened next well we're still in this swing range from this high to this low and again this is where people get confused we are creating structure with cementing highs and lows within this swing range but none of this matters until we get a break of either the low or the higher okay and you can see we
get that break right here okay so now what is the highest point before this break is it's this right here so we can show we have our swing High confirmed then after the break of the low we're waiting for that cemented low so here we can see this candle broke structure did the next candle close above this candle no did the next candle close above this candle yes we have that closure body close above this candle's highest point okay so now we have our confirmed swing low okay and so price goes on this way you
can very quickly see now our current range would be between this high and this low and what comes next a break of the high or a break of the low well it's a break of the low so there we go so now after a break we confirm the swing high and then we wait to for a cemented candle to confirm the swing low so again this is looks very messy but we have a very mechanical way of looking at price so this is the lowest point does this candle close above the candle switch left no
does this candle no does this one no does this one no no no and we can see it's not until this point here the price closes above the candle to its left this didn't or maybe it did if we look at the text but okay this did so sometimes on the this is the monthly so you have to zoom in and really see whether that did so here we can see that this candle did close above the council is left so that is in fact that's something either way it doesn't make a difference because the
lowest point before that cemention was this one okay so that confirms our swing low is here and where's our swing high so now what we're doing is we are waiting to see because we've confirmed the low now and we've confirmed the higher so this is our range that's all we need to look at okay this was the lowest point before that cemented below okay so that's our swing low now I use body brakes to determine breaks of structure so you can see that we just had a wick break of this low here okay so this
doesn't count as a break for me so I just put my line straight through that but I can still see that before we got a break of the high we still did get a break of the loan so in terms of structure we are still bearish in the trend and what is the highest point before that break of structure well it is this point here so before the breaker structure and after the cemented uh low okay we can finally put that as our swing High and we can see after this break we got another cemented
low here so we can confirm that as our current swing low and now we just marked out the entire monthly swing structure on Euro USD okay now so if we do the same thing we did before we can Mark out the actual movement of price on this time frame so here we go we have our swing lows the swing highs and that can actually hide the candles you can see clearly basically a line chart of how price is moving regards to swing structure so as you can see this is a very mechanical way of mapping
your swing structure and it works on any time frame on any pair indices stocks crypto whatever you want to use it on it's a 100 rule based 100 mechanical and you just can't go wrong or get lost with it now there is a trickier thing to do like here it was very easy to find a starting point because it's the monthly and there's not a lot of data not many candles so we could just start from the very beginning but what if you're starting on a lower time frame where do you start amongst all the
mess so what I do I'll go top down analysis marking through charts and so as you can see on the monthly we now have our last swing range which is from here to here and so I'll mark That Swing range and make sure that that is visible on the next time frame down I'm going to use so if I were to go down to the weekly I would start work between this high and this low okay so that we know the swing structure in that range so starting from I guess we can see the obvious
point of high low high before the top of this range so I would begin my marking there so we can Mark a high there because why this candle was cemented by this one and then so we have our swing High here and I can see that that gets broken at this point so we now have a confirmed swing low which is the lowest point after this high and then we have our confirmed swing high and this is another interesting one you can see that the high is confirmed oh sorry this is the highest point because
this candle closed below the candle to its left so the highest point before that was this so in fact is our swing High now what you can see is after that we had a wick above that but as we said before that's not a breaker structure this doesn't change anything in our structure the next break was a break of this swing low over at this point here so we can mark that on and then we'll just go on the same exact way as I marked out the monthly so I'll just do that now but I'll
speed it up in the video okay so this is a point to look out for you can see here that we closed below this low and then we failed to cement none of these candles closed above the ones that are left so this becomes just one continuous move down until you get that cemented candle after a low so you can see here again this one didn't this one didn't this one didn't this one didn't but this one closed above the candle to its left and that is still um this is the lowest point before that
happened so this is our swing low so again where's the swing high in this case well this is the highest point uh after the candle candle the low cemented and then we had the break to the downside but next is cemented below here and we got a break of the high the swing structure High and then we got a break of the low again now in this video obviously I'm not gonna I'm not going into the details there are more nuances to structure that we go into at Magic FX Academy this is more just the
the very basics of Swing structure what we have we have major structure minor structure substructure minor one structure internal structure and all this kind of stuff that we can read into that and so we can really go into depth with what's going on with the price and then of course you have the premium discount order flow of supply and demand zones and all that stuff to keep you busy with But continuing with just swing structure I will now foreign [Music] month in charts every chance will have this big bearish candle [Music] okay so there we
have it we have our swing structure on the weekly now marked out um probably did a bit too much but we have from the most recent monthly swing range mapped out and then what you can do going forward from there if um depending what you use you can mark the most recent weekly swing structure and then Mark the um the daily from there and then Mark the most recent daily and mark the four hour from there my most recent four hour mark the whatever you use next 15 minute from there um so you're always within
the most recent range on the from the higher time frames all the way down then once you get to the one minute you're marking the one minute within the 15 minute um and you know you're up to date with your swing structure um so this was basic swing structure and I hope this has cleared up a few things obviously it was the very first video I put on this channel and a little slightly different style there and you know I went on for ages well I've gone on for quite a while in this video but
um hopefully that has made it clearer because I get a lot of questions still obviously I didn't make things quite clear enough um in the first video also in that first video the audio was only coming out on on the Left Channel um for some reason so hopefully that is now fixed with this one and this will become the new uh ultimate structure video now I have another video uh called structure mapping part two um which goes into major and minor structure and uh uses the premium and discount Theory and I would definitely recommend if
you haven't seen it yet go and watch that now I'll try and put a link to that somewhere here um or in in the description if I forget now yeah so from this is your Basics this is what you need to go forward with price um you need that mechanical structure um just to be able to to reprice and not be lost in the market it's so important and it's the biggest hurdle for me in my trading that it took to get over and actually find um that I wasn't coming to the charts not knowing
what I was looking for or where price was going like now I know 100 what the trend is and where I'm looking to take shorts or Longs from Okay so hope that helped [Music] [Applause] [Music]