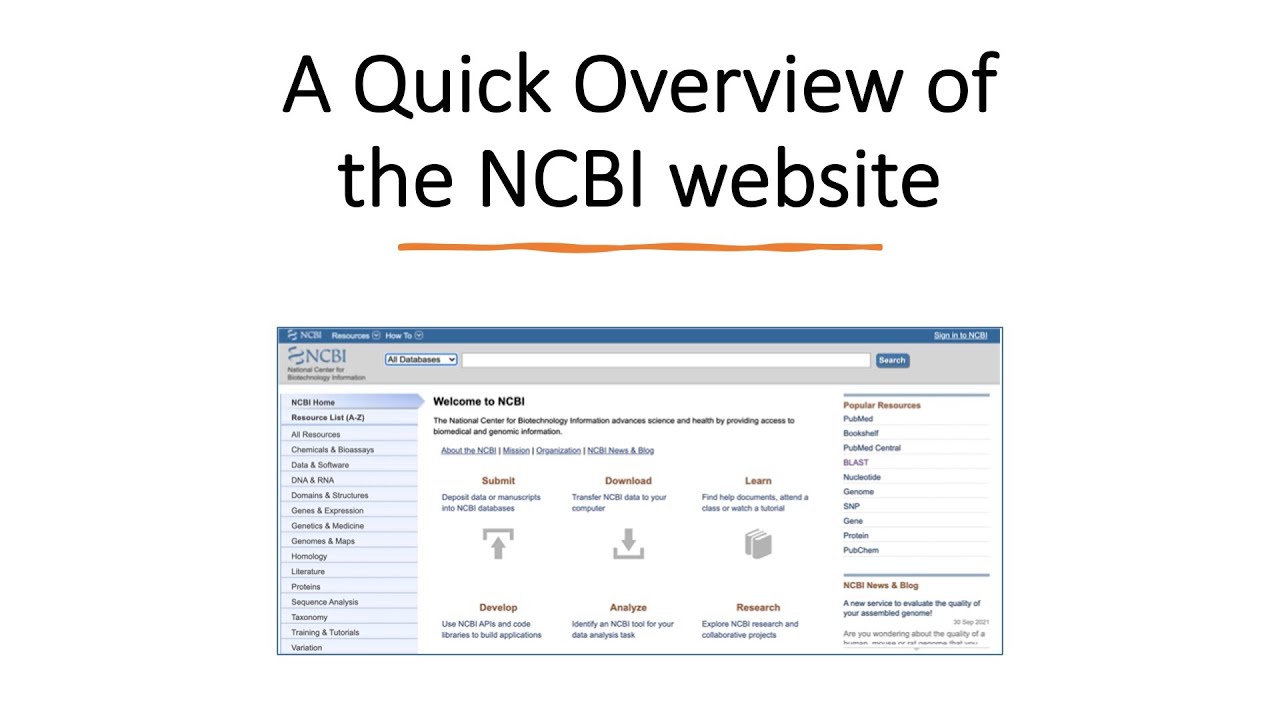
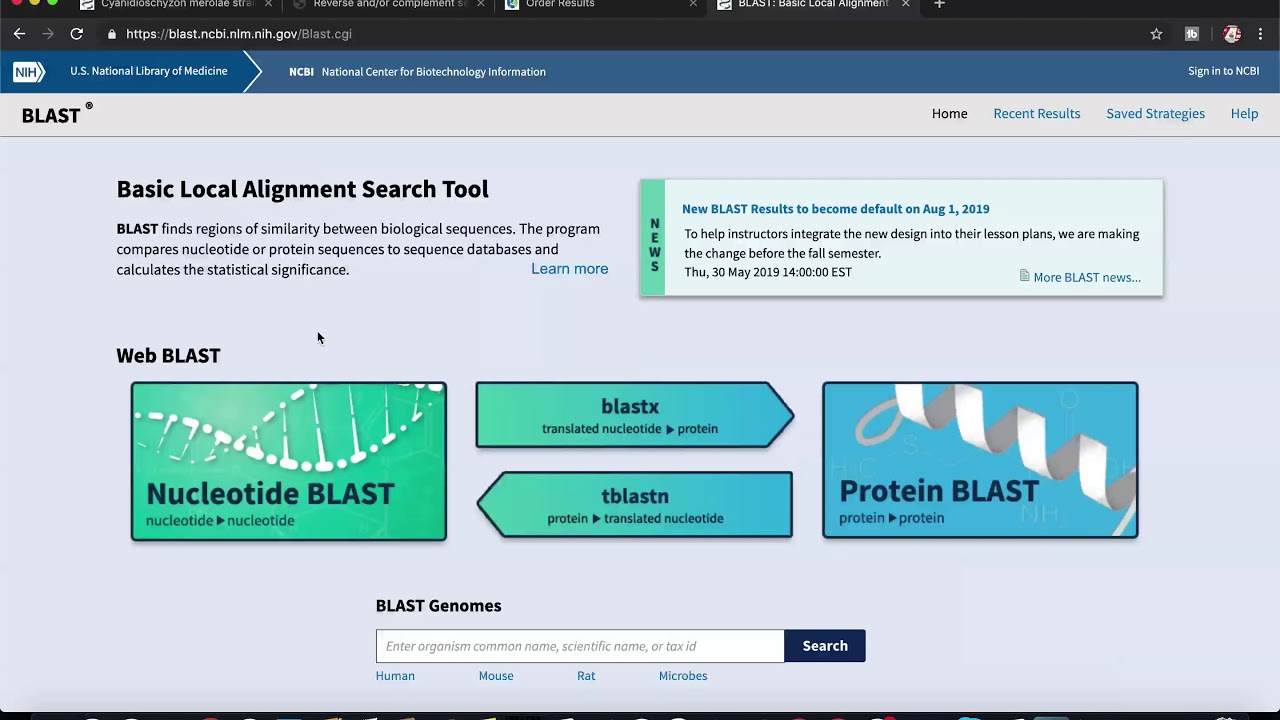
Hi, this is Svenja Lohner from Science Buddies, and this video is an introduction to how to use the free online BLAST tool from the NCBI website (National Center for Biotechnology Information) for your genomic research. BLAST stands for “Basic Local Alignment Search Tool” and is a computer algorithm that identifies similarities between biological sequences by comparing nucleotide or protein sequences to a database of sequences. You can get to the BLAST website from the NCBI main homepage by clicking on the BLAST link under Popular Resources on the right, or by searching for the tool in your web browser and clicking on the BLAST website link.
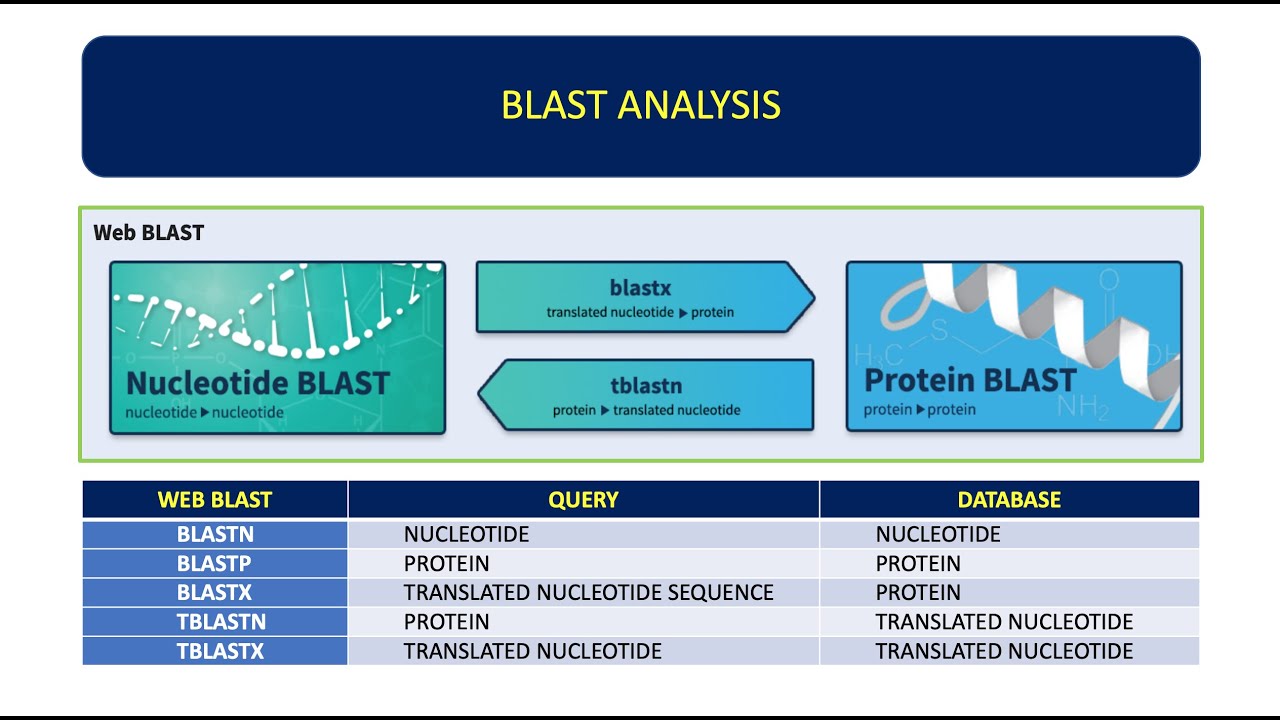
When you get to the BLAST main page, you will see different BLAST options. You can do a nucleotide BLAST which compares nucleotide sequences. This is useful when trying to determine the evolutionary relationships among different organisms.
The protein BLAST compares protein sequences and is useful when trying to identify a specific protein. Further down the page you will find specialized searches such as the Global Align search, which compares two sequences across their entire span. We will talk about this search function in more detail later in this video.
Once you click on nucleotide or protein BLAST, you will get to the BLAST query page. Here you have to tell the computer algorithm what you are exactly searching for. On the top of the page, you can switch between the different BLAST options such as nucleotide or protein BLAST.
In the Enter Query Sequence section, enter your query sequence. BLAST accepts different types of input such as the sequence’s accession number or a sequence in FASTA format. You can also upload a sequence from a file.
Next to the search box, you have the option to limit your sequence search to only part of the sequence. For example, entering from 1 to 300 in the Query subrange boxes limits the sequence search to the first 300 nucleotides or amino acids of your DNA sequence or protein. You can name your search in the Job Title box underneath the search box.
The next section allows you to define your search settings. You have several database options that you can choose from. Ideally, you want to search the smallest database that is likely to include your sequence of interest to get the most significant results.
Choosing subsets of databases is possible from the drop-down list. Clicking on the question mark allows you to check what sequences are included in that database. To narrow down your search, you can limit your search to specific organisms by entering them into the organism box.
Checking the exclude box excludes the selected organisms from your search. With the “add organism” button you can add additional organisms. In the Entrez Query box, you can use Entrez query syntax to limit searches to molecular types, sequence length, or specific search terms.
Clicking the question mark and then more brings you to a page with some example queries. Note, that the Entrez Query option is not available for protein BLAST. The last section allows you to select the program that BLAST should use for your query.
If you want to identify a nucleotide sequence, megablast is the program of your choice as it is specifically designed to efficiently find long alignments between very similar sequences. For protein sequences, you want to use the standard protein, or blastp, program for identifying a query amino acid sequence and for finding similar sequences in the protein database. One useful parameter in the Algorithm Parameters section below the BLAST button is the number of maximum target sequences.
Changing the number from 100 to 50 means that the program will show you a maximum of 50 aligned sequences on your result page. Check the box “Show results in a new window” if you want to be able to edit your BLAST query later, and then click the BLAST button. It usually takes a while for BLAST to process your query.
Once the search is complete, a new web page will appear with your BLAST report. On the top left of your BLAST report, you will find a summary section with information on different aspects of your search. On the top right, there is a box that allows you to filter your results based on organisms, percent identity, or E-value.
Below the top section, the BLAST results are shown. There are four different tabs called Description, Graphic Summary, Alignments, and Taxonomy. Each tab presents your search results in a different way.
The Description tab, which is the default tab, contains a summary table of hits found by BLAST. Each row in the table represents one database sequence that BLAST identified to be similar to your query sequence. You can use the checkbox in the top left corner to select all or none of the sequences.
Individual sequences can be selected and deselected using the checkboxes to their left. The table provides following information. • The description or title of the matched database sequence, • the maximum and total alignment score for the database sequence • the query coverage, which is the percentage of the query sequence that is covered by the database sequence alignment.
• And the Expect, or E value of the database sequence. The E-value is the number of expected hits of similar score that could be found just by chance. For example, an E-value of 10 means that up to 10 hits can be expected to be found just by chance, given the same size of a random database.
The lower the E-value the more confident you can be that the result sequence is not a random hit. • You will also find the maximum identity, or the highest percent identity of the database sequence, and • The accession number of the database sequence. The accession number is a unique identifier given to a specific nucleotide or protein sequence in a database.
Clicking on the accession number for one of your matched sequences brings you to the GenBank record of that sequence. Clicking the column header changes the default column used for sorting the table. The default sorting is by E-value.
The Graphical Summary tab provides a graphical overview of the alignments between your query sequence and the database sequences in your BLAST results table. The query sequence is shown at the top. The colored boxes underneath correspond to regions in the query that have sequence similarity to the database sequence.
The boxes are color-coded based on their alignment score. Hovering over a BLAST hit makes the title of the database sequence appear. If you searched for a protein sequence, the graphic summary report also provides a graph that shows putative conserved domains within your query protein.
If you click on the image, you can learn more about each of the detected conserved regions in your protein. In the Alignment tab, you can view detailed information about the alignments between the BLAST hits in the description tab and your query sequence. You can view the Alignment for a specific sequence by clicking on the sequence title in the description tab.
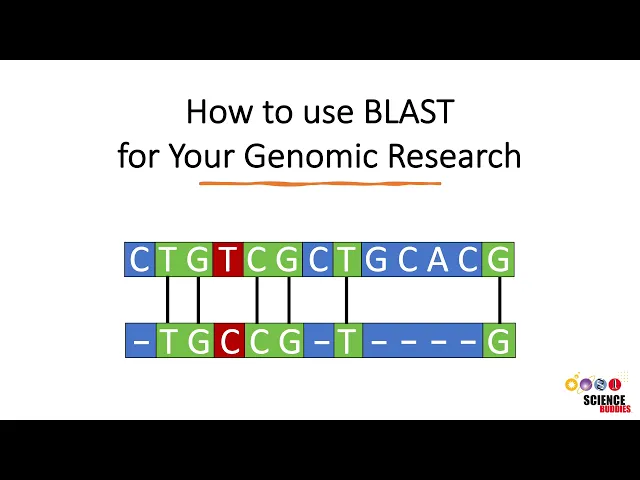
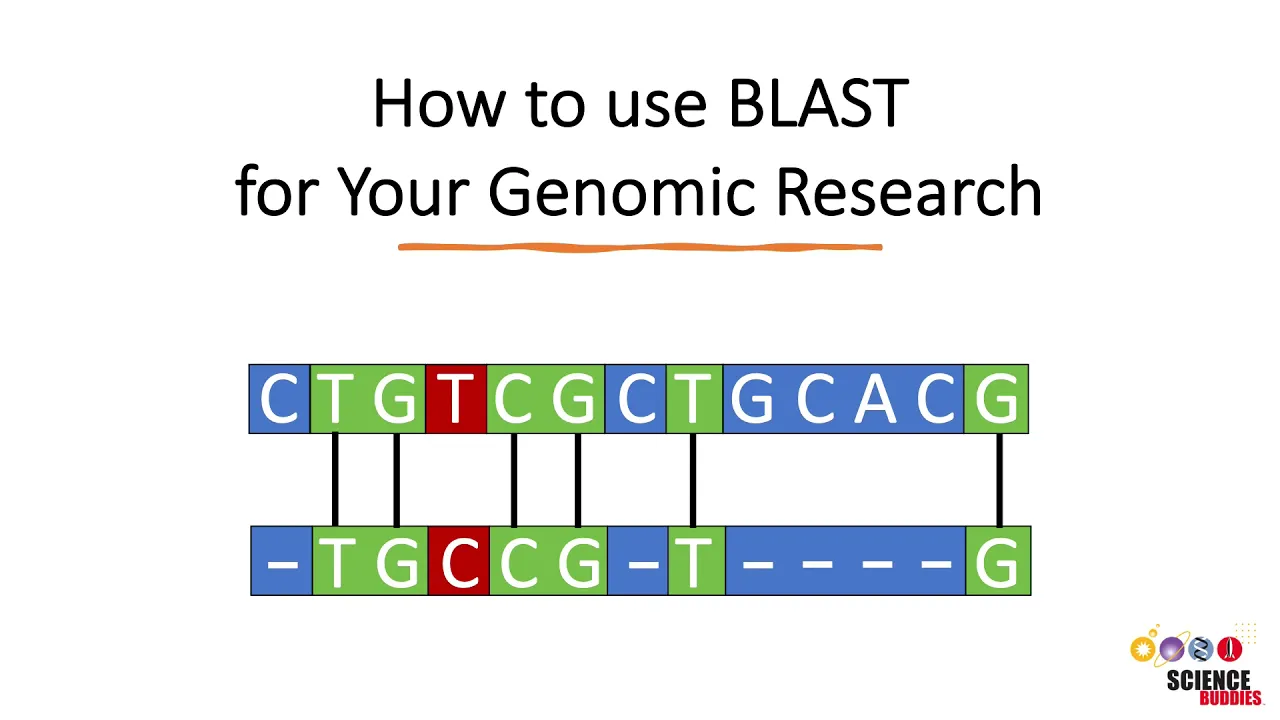
The alignment shows how well the query sequence matches the subject sequence. The top row of letters corresponds to your BLAST query sequence. The bottom row of letters corresponds to the matched subject sequence in the database.
Vertical lines connect nucleotides or amino acids that are identical in both sequences, no lines between the two sequences means that one sequence differs from the other and dashes indicate gaps in one of the sequences. The sequence identity, above the alignment, tells you the number of identical bases or amino acids between the query and the subject sequence. The identity is also given in percent.
The percent identity is a good indication of how closely related the two different sequences are. You can depict the relationship among database sequences and the query sequence in a distance tree or phylogenetic tree. In the summary section above the results table, there is a Distance tree of results link.
Clicking the link will generate a distance tree for all sequences in your results table. You can also create a tree for only a subset of your results. In the results table, select all the sequences you want to include in the tree.
Then click Distance tree of results above the results table on the right. Clicking this link will generate a distance tree with just the selected sequences. The distance tree of results link opens a new page.
The phylogenetic tree consists of branches, nodes, and the labeled leaves. It might be helpful to change the sequence label to taxonomic name in the drop-down list. Your query sequence is highlighted in yellow.
A triangle indicates when multiple sequences are clustered together in one leave. You can expand or collapse a branch or section of the tree by hovering over the tip of the triangle and then clicking on expand or collapse. A slider at the top allows you to zoom in and out the tree.
Use the arrows to pan left, right, or up and down. If you need information on how to read a phylogenetic tree, you can watch the video “phylogenetics and reading phylogenetic trees” linked in the description. Creating a phylogenetic tree based on sequence similarity allows you to analyze the evolutionary relationships among organisms.
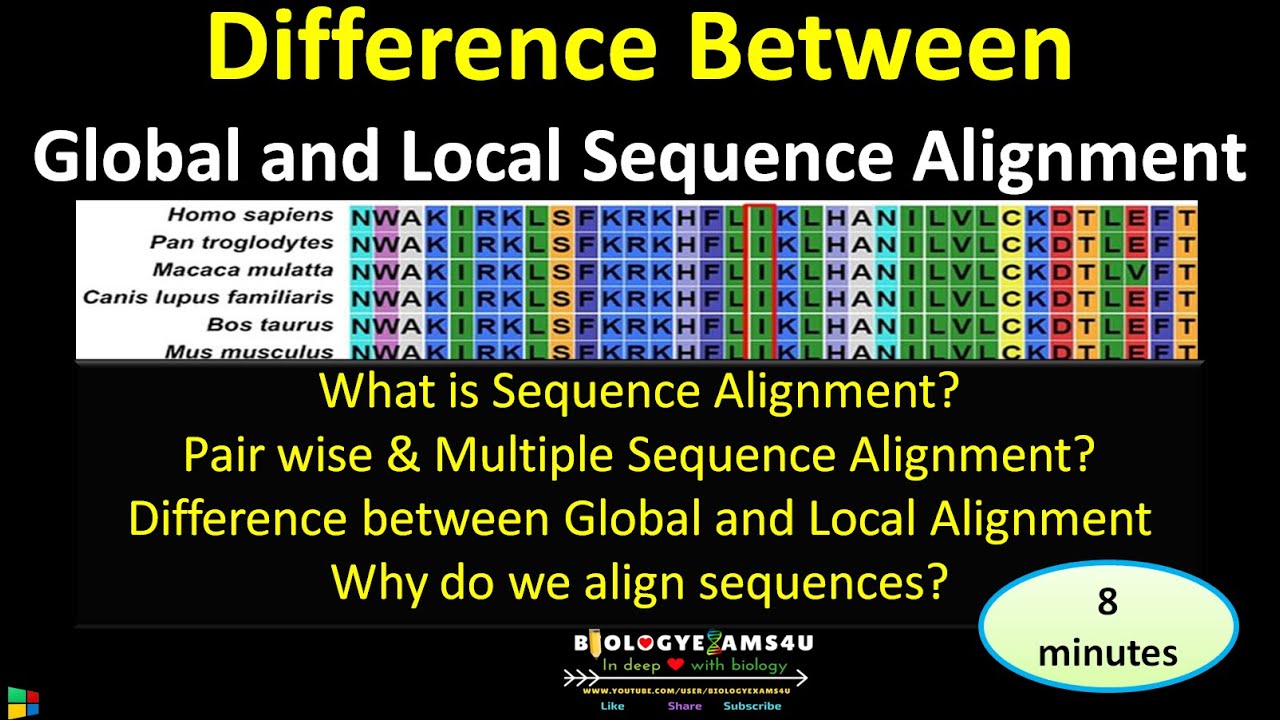
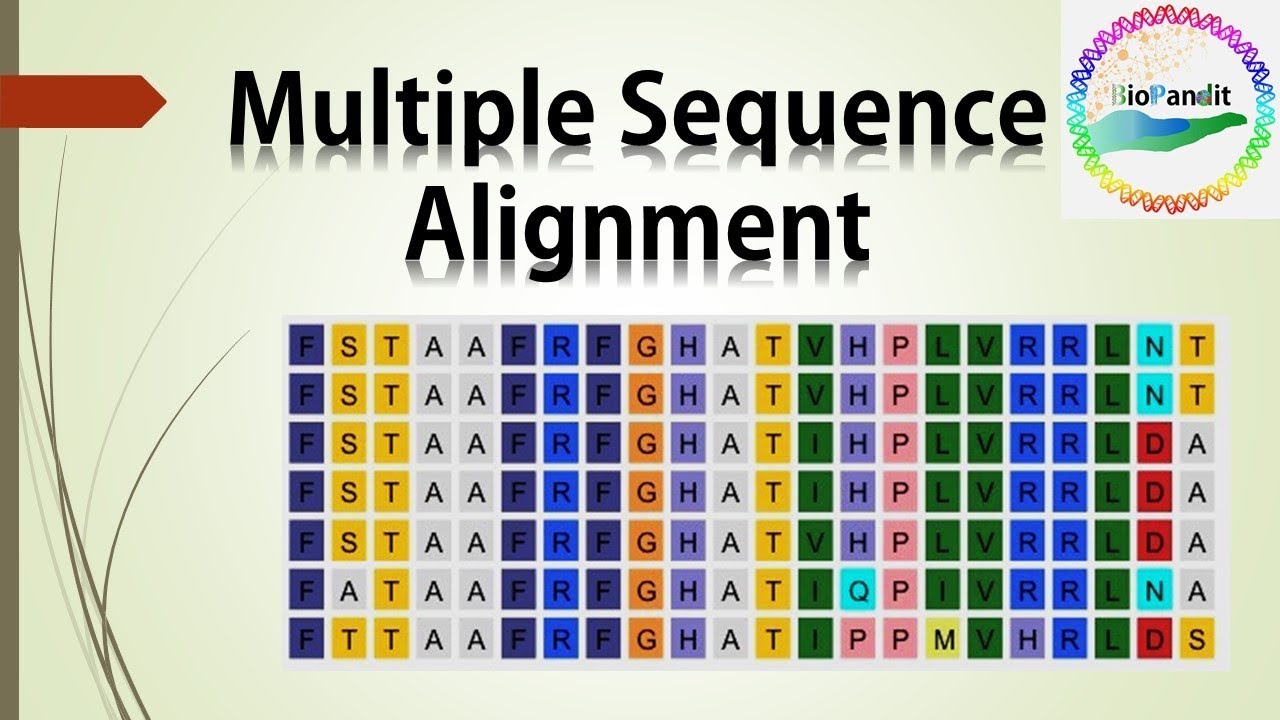
If you want to do a pairwise sequence alignment, which compares two specific sequences, you can use the multiple alignment search within BLAST. One option BLAST offers, is to do a local alignment of your two sequences. A local alignment aligns substrings of a query sequence to a substring of a target sequence.
This means, a local alignment will only align those portions of the two sequences that share similarity. Within BLAST, you can do a local sequence alignment on the BLAST query page. Check the “Align two or more sequences” box and the page changes, so that you can enter the query sequence and the subject sequence that you want to compare.
Click the Alignments tab in the resulting BLAST report to look at the alignment of both sequences in more detail. If you know that your two sequences share significant similarity over most of their lengths, you can do a global sequence alignment. Global alignments are usually done when comparing two genes with the same function, for example in human versus mouse, or when comparing two proteins with similar function.
In a global alignment, an attempt is made to find the best alignment over the entire length of both sequences. You can do a global alignment of two sequences by clicking on Global Align in the specialized searches section of the BLAST main page. On the global align query page, enter the two sequences that you want to compare in the Enter Query Sequence and Enter subject sequence box and then click the BLAST button.
Again, check the Alignments tab in the resulting BLAST report for more details on your sequence alignment. With the information provided in this tutorial you should be able to tackle many of the research questions that come with a genomics research project. To get ideas for genetics or genome science projects that use the BLAST tool, or thousands of other science and engineering projects, visit us online at www.
sciencebuddies. org.