okay folks welcome back this is lesson 7.2 of the january 2017 content using limit entry techniques for long-term traders okay we're looking at buying with a limit order and much likely used for the buy stops the monthly end or weekly should suggest institutional order flow will be seeking a pd array above daily market price the daily should post a bearish candle the daily chart must close the candle with a down close and it is not valid while the daily chart candle is treating and or forming and the buy limit is going to be placed at
the bearish candles close this is a daily candle so we're looking at the daily high the daily low the daily open and the daily close we're gonna be looking to enter a buy limit order at the close of the daily candle that's down close while the market is bullish and we're expecting a higher price move in the asset class we're trading what you're going to be seeing is the markets are going to be undervalued in already primarily bullish market condition preferably this is going to be useful to you when the market's already shown the willingness
to have a market structure break it's already started to move higher it's already started to move higher so therefore prices are really underway there's going to be opportunities when we start talking about swing trading we can utilize the information in that module to help get better fills on the long-term entries closer to the turning points but for this module really we're focusing on how you don't necessarily need the big turning points at the top or the bottoms you just need to meet in between and be a long-term trader still and it capitalizes on a lot
of pips a lot of points if you uh if you do these types of trades it takes a long time for them to come to fruition and long time for them to set up but nonetheless when we use a buy limit entry at the close what we're doing is the very next day or the next candle when it opens up we're expecting price movement to move below that down candles close what we're actually doing is we're buying at a deeply undervalued price it's already going to be oversold without requiring any indicators but we're going to
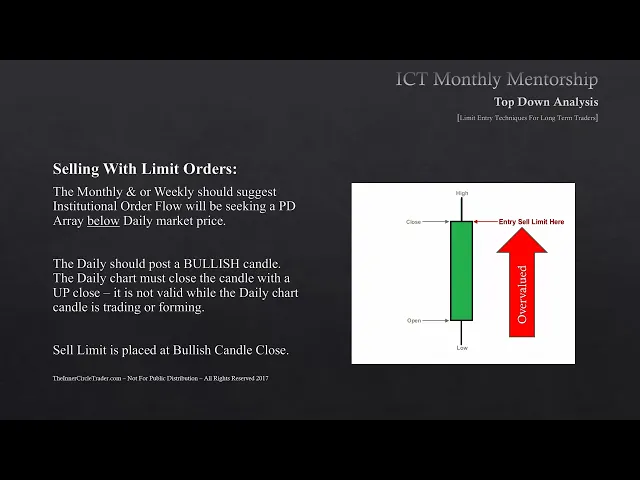
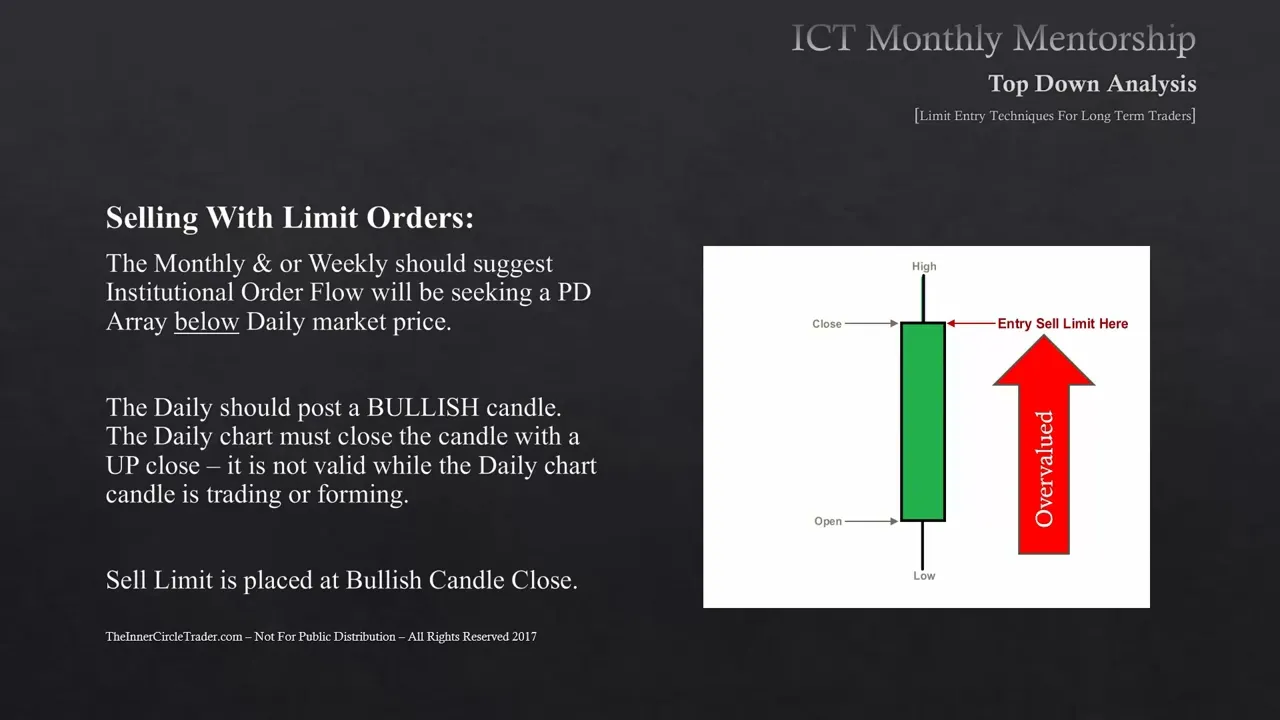
be buying at a deep deep discount when the market's predisposed to move higher you're going to see in our examples how it nails down extremely extremely awesome entry points i mean they're so deep in discount and you get quick immediate feedback even on a daily basis that you're on the right side of the marketplace and you start seeing profitability almost immediately okay selling with limit orders just like we had with the cell stops the monthly and or weekly should suggest institutional order flow will be seeking pd arrays below daily market price the daily should post
a bullish candle and the daily chart must close the candle with a up close it is not valid while the daily chart candle is trading and or forming and the sell limit is going to be placed at the bullish candles close so this candle again representing our daily candle up close this is the daily high the daily low the close and the open for that particular day and we're gonna be looking to have a sell limit order right there at the candles close and what we're doing is essentially we're selling short in an overvalued or
overbought condition in a market that's predisposed to go lower based on monthly and or weekly pd arrays that will draw price lower so institutional flow should draw prices lower on the daily but we're getting this up movement against what longer term institutional order flows suggesting again on monthly and or weekly chart so while prices moving higher for this particular day what we're doing is we're going to be looking to sell short at the next day but it has to be above this particular candles close now again we're not just selling on a limit on any
up candle if we have an opinion about being bearish these conditions are best suited when we align them with a daily pd array in other words if there's a bearish order block if there's a gap that it's traded into if it's filled in a void if it's traded above a recent high okay or it's retreat back into an old historical low support broken analysis resistance there's like those types of ideas we're not just indiscriminately going out and finding up candles and dam candles i should have mentioned this as well when we talked about the stop
orders but you're not just simply going in based on the candle itself by itself it's not a be all end-all and you know a system in and of itself you have to blend the pd arrays on the daily chart as well so by blending these things together with the higher time frame monthly and weekly pulling price one side or the other bullish or bearish respective on those higher time frame charts when we have those conditions also in opposite terms so basically what i'm saying is on monthly and weekly if you're expecting lower prices or bearish
pd arrays that should draw price down to a discount what you're expecting to see on the daily is up movement to go to a short term premium when that occurs then you have really really low risk high probability entry patterns at your disposal and this is one of the most amazing ones you're going to see by selling short on a limit above that candles close what you're doing is essentially getting that last little piece of market movement above getting that last little surge many times when we look at day trades you're going to see that
that's many times what you'll see is the judah swing it'll open make the high in london and then sell off and it'll be the beginning of a long long term move in that particular pair or asset okay we're going to go back to that japanese yen example and we're going to use this idea as well and you can see we have the down candle and using the close as our limit order to be a buyer you see how that transpires here each down candles close the next day it trades down below it you would be
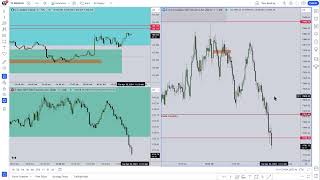
filled only limit going long and look at the responsiveness of price immediately after that there's one two three four five examples here on this daily time frame and while it probably doesn't look exciting here probably doesn't feel like you know it's that big of a deal i can assure you when we get into two slides from now you'll see just how much of an importance this is but again what we're looking at is the weekly chart here you can see how price was moving away from that 100 level and there was a bearish order block
up around that 118 119 level and that was the weekly premium pd array that would draw price up to that level long long term and we saw a bullish order block down in the discount level at 100 so you saw the willingness to want to bounce off that level we go back down into a daily chart here you can see in november during the post election rally of donald trump's election in the u.s price stabbed one more time down into that weekly bullish order block uh prior to that november dip we saw a september rally
away from a previous order block that was formed in august 2016 september we saw it retrade back down into it and using the down candle the very next day it did trade down below the close giving an amazing fill now what you're seeing here is these lines that are drawn right up from the down candle up into that red shaded area that's that weekly pd array or bearish order block what that means is this price should be drawn up to that level in weekly and from the low that was formed in september buying on a
limit below the daily candles close from that point all the way up to the weekly pd array or bearish order block it's 1800 pips for that particular low the next one comes in around november 17th or thereabouts and you can see that that limit order below the daily close would have been filled as well and from that point up to the weekly weekly pd array up at the weekly bearish order block was 980 pips and then the next down close on this daily chart here again using the close of that down candle as a buy
limit order entry point that next candle puts you in a position where it would have been 785 pip move the next down candle again comes in with a 600 pit rally and another one comes in at 500 pips and the last one right before it gets to the weekly pd array given a 360 pip price move and again buying below the candles close on a limit you're buying that real deep suppressed um undervalued market and it's in a deep discount and it will look to seek to move to a premium and it's an amazing thing
when you go through your charts and you look at this and start studying it and again what we're looking at is daily time frames it's not that we're looking at you know hourly charts or 15 minute charts and a lot of folks assume just because we're on these higher time frame charts there's not a lot of opportunities there isn't as many as you would see in terms of day trades or scalps no i would quickly agree with that but there are plenty of opportunities when you're in these long-term trends and they have a real clear
indication it wants to move higher to a monthly or weekly level there's many opportunities you can get in there and get positioned and not have to get the high and you can see here that move from the 980 pip move it's essentially the equilibrium price bar just below it and even above the equilibrium price point there was many opportunities where you could have got several hundred pips and whether you are a day trader scalper or whatever i mean those types of numbers are just simply not something to scoff at they're very respectable numbers so my
question to you in closing is do you still think you need intraday trading to make pips hopefully after this teaching you'll quickly come to the conclusion that you do not need that so folks that felt that i'm only teaching day trading and short-term trading things this is the type of trading that you can find opportunities with still maintain risk relatively low and still find a payable framework for your trading ideas to pan out and this is just one pair in one focus on a pd array on a weekly and monthly basis and until next time
i wish you good luck and good trading