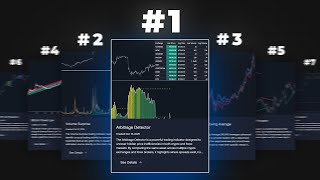
If you're aiming for sniper entries, tight stop- losses with big take profits, there's almost no concept more powerful than liquidity sweeps. These events can be some of the most lucrative opportunities in trading if you can spot them in time. That's why we built an indicator designed to accurately detect liquidity sweep levels using advanced price action theory, giving you the precision you need to catch high probability moves.
In this video, you'll see exactly how it works, why it's so powerful, and how you can start using it for free. Let's dive in. So, what exactly are liquidity sweeps?
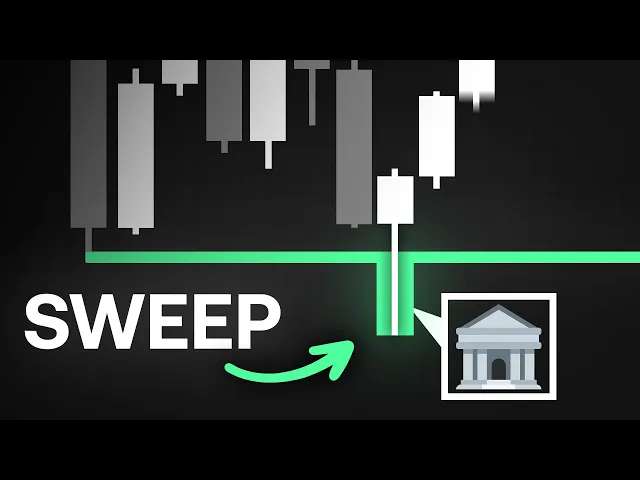
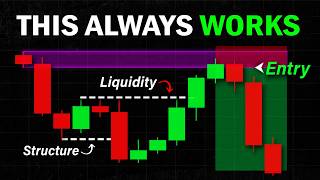
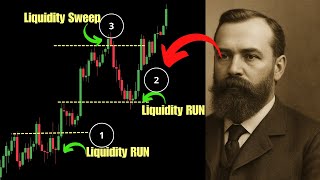
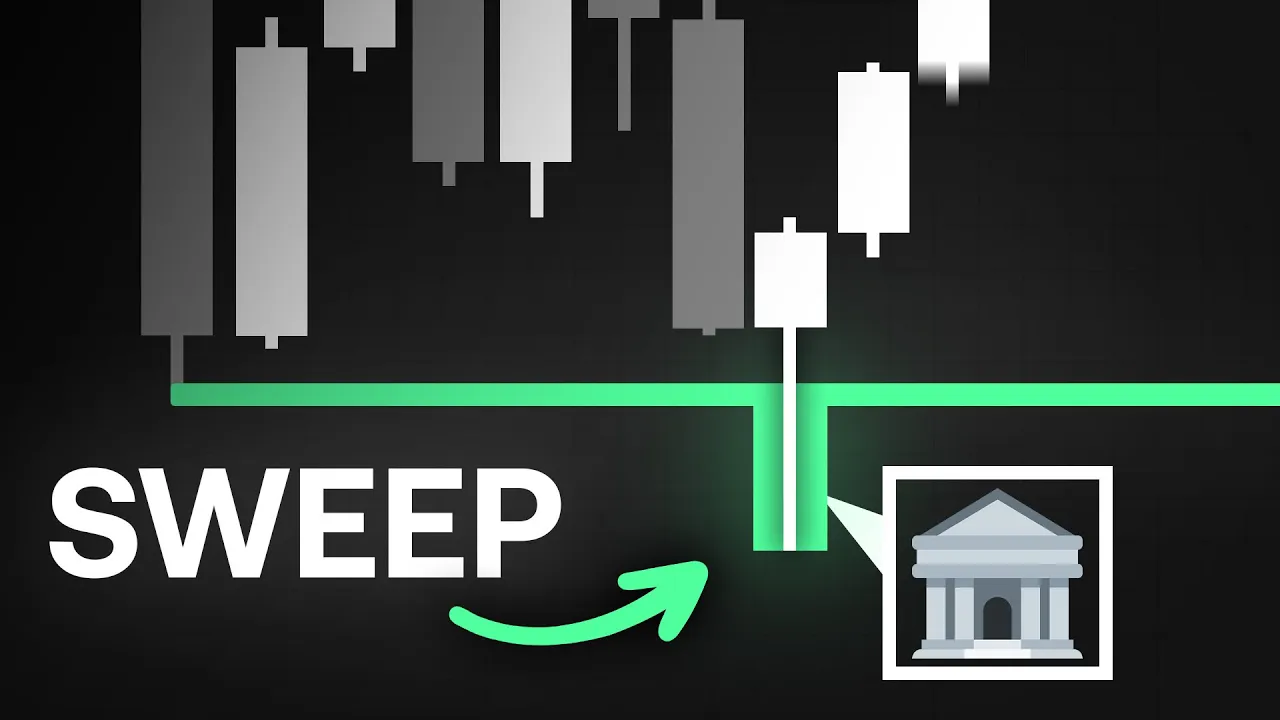
A liquidity sweep occurs when price briefly pushes past a key support or resistance level just far enough to trigger stop- losses or fill pending orders before snapping back in the opposite direction. These moves are designed to grab liquidity from traders who placed stops in predictable spots, giving larger players the ability to enter or exit positions with minimal slippage. On the chart, a sweep often appears as a sharp spike above a recent high or below a recent low, immediately followed by a swift reversal.
This indicator is able to detect these liquidity sweeps in real time, making it super easy to execute trades based on them. When you first add this indicator to your chart, you'll notice multiple red and green horizontal lines appear. These represent the price levels the indicator monitors for potential liquidity sweeps.
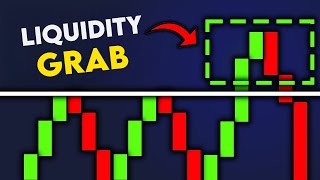
Green lines correspond to bullish sweeps, while red lines mark levels for bearish sweeps. A sweep is confirmed when a candle wicks above or below one of these levels, but then closes without breaking it. When this happens, a green or red box appears on the chart to highlight the sweep in real time, giving you an immediate visual signal to act on potential setups without delay.
The support and resistance levels used for detecting these sweeps are derived from market structure, but remain flexible and can be adjusted to suit your trading style. In the settings, you'll find a single input called detection, which controls the level of structure the algorithm searches for. If you're familiar with our pure price action structures indicator, this will feel familiar as it uses the same smart detection system without requiring manual inputs for structure length.
You can learn more about this approach in this video. The detection dropdown offers three modes: short-term, intermediate, and long-term. Short-term focuses on smaller, less significant shifts in market structure.
These can still produce valid sweeps, but may result in less dramatic reversals. Intermediate and long-term modes target major structural levels which tend to produce stronger and more meaningful liquidity events. Below that, the styling options allow you to fully customize the look of the lines and sweep boxes so they blend seamlessly with your chart setup.
Now that you understand exactly how the indicator works, let's break down how to use these signals to spot and trade high probability liquidity sweep setups. Not every detected liquidity sweep will lead to a massive reversal. The outcome depends heavily on how significant the price level is and the volume delta at that level.
In this example, we're detecting intermediate liquidity sweeps while also using the price action concepts ALGO to highlight order block formations. These order blocks not only mark key areas of market structure, but also display the number of buyers and sellers active at each shift point. Here we see a bullish liquidity sweep occurring in the same region as a major order block.
This block holds a volume of 1. 1 million contracts and importantly shows more sellers than buyers resting at that level. This combination is ideal for a reversal scenario because incoming buyers can quickly absorb the remaining liquidity and drive price upward.
Our approach is simple. We wait for the market to push into this zone and once the bullish liquidity sweep is confirmed, we enter with our stop placed just below the sweep level. For targets, we aim for the next swing high, an easy and logical objective.
This approach can also be combined with other tools such as volume profiles. In this example, we're using our free money flow profile indicator with the heat map enabled to visualize where volume is concentrated. High volume areas appear in yellow while low volume zones show in red.
To learn more about this indicator, we have a full video that goes over it in detail here. The strategy with this setup is straightforward. We wait for price to push into a low volume red zone.
And if a liquidity sweep is detected there, we enter with a stop just below the sweep and target the nearest yellow high volume area. These setups aim to capture moves from areas of low interest to areas of high liquidity. Now, this style of trading comes with a trade-off.
You'll likely experience more frequent small losses, like in this example where the first sweep failed. However, the second trade produced a clean 1 to4 risk-to-reward move. While not every setup wins, the large reward on successful trades can more than make up for the occasional losses.
And that wraps up our deep dive into the pure price action liquidity sweeps. A precision tool for spotting where the market is hunting stops and collecting orders before major moves. It allows you to identify liquidity grabs in real time and execute high probability setups with confidence.
You can start using it completely free right now at luxalgo. com/ library. For even more powerful confluence, pair it with the price action concepts ALGO.
Features like order block detection make it easier to confirm sweeps, time reversals, and manage risk effectively. You can try it risk-f free for 30 days at luxalgo. com.
Follow us on X for daily trade setups, strategy tips, and market breakdowns. Thanks for watching. Trade smart, manage your risk, and we'll see you in the next one.