foreign all right folks welcome back for those that don't know this is me doing a revamp of an old 2014 video series i did by the same title mark maker series i did 12 videos in that series and i was long-winded in most of those installments so with the backdrop of all of the supportive studies on this youtube channel it's been my interest to revisit that series and kind of like polish it up a little bit and with that perspective in mind hopefully i'll be able to deliver something that's much more meaningful and impactful to your trading especially for those that have been with me for a long time uh newer students to have acquired over the last six months or so may be impressed by the level of insight that this series will bring them but i also want to begin with something that is important to know there's a lot of market maker buzzwords that are making the rounds on youtube on instagram all over social media facebook telegram everywhere and the bulk of what you're seeing regurgitated actually came from this series here or it came from my 1996 lecture nights which again many people have taken pieces of what i've taught over almost the last three decades and tried to come up with their own little interpretation and all of them have been found wanting it's my goal here to try to present this in a manner that is concise succinct and to the point as best as i possibly can and not try to gloss over too much and make it of no use so while i won't have 12 videos i am going to go through that series and pull out everything and put them in the proper context the proper order so that way everything that should have been understood and more because this is a revamp of it hopefully will be delivered by me in these five videos this first volume is understanding the macro all right before we get into the nuts and bolts of all this who is the market maker now obviously i'm saying that with my tongue and cheek but who is it who is the market maker well the central banks are the producer of currency prices and are the market maker central banks establish and manage a country's currency price at all times both autonomously and manually currency prices are 100 controlled and manipulated by central banks investment bank dealers goldman sachs ubs city or brokers are not market makers now they're commonly calling themselves i'm a market maker i'm an ex-market maker at goldman sachs i'm an ex-market maker at ubs i'm an ex-market maker at credit twist all these guys are dealers okay or ladies indifference through the women they're not market makers okay if we're talking about the currency markets forex the central bank is the market maker everybody deals and trades and exchanges on their product their product is the price of the commodity or currency they make that price buyers and sellers do not make that price we only exchange at the price fee that's given to us dealers and brokers do business with the price fees set and delivered by central banks dealers and or brokers do not set or control currency prices central banks are not following retail indicators or flawed retail logic examples being they do not and the algorithms do not consider why golf harmonic elliott wave vsa or volume spread analysis supply and demand zones etc no matter what it is that you may subscribe to as a trader none of that is considered when the central bank algorithms deliver price reprice or hold in consolidation it's just the facts central banks employ high-tech algorithms to deliver currency price fees and they do not run on supply and demand i'm going to repeat this one central banks employ high-tech algorithms to deliver currency price feeds and they do not not not okay and let me press it so many times it's important you understand this that supply and demand has no bearing on the delivery of currency prices period now with all that said let's dive deep understand the macro now when you're considering market maker concepts real market maker concepts you have to start with quantitative analysis okay a quantitative analysis is something that's statistical it's measurable it's not subjective it's not left for interpretation like looking at a trend is a trend still bullish or is it bearish you ask 20 different traders on multiple different time frames they're all going to come with with a different interpretation of whether it's bullish or bearish okay that's subjective that's qualitative okay we'll get into qualitative analysis but for now we have to start with quantitative analysis and that means something that is measurable it's statistical and it's not up for interpretation it's pretty much straightforward when you're doing quantitative analysis you're asking essentially the first question being what should the market be experiencing at the present like right now when you're sitting down in front of your charts what are you expecting price to be experiencing in terms of bullish or bearish is the market bullish or bearish you have to have a way of determining that how do you get that information what derives that answer or whether it's bullish or bearish so where do you find that information well the first is global interest rates now this address here is just an additional link but if you go to www. globalhyphenrates. com it'll take you through very simple prompts on the page that link specifically though you want to bookmark that one okay and whenever you do your quantitative analysis you can refer to the global rates and the other being commitment of traders and you can find that on barchart.
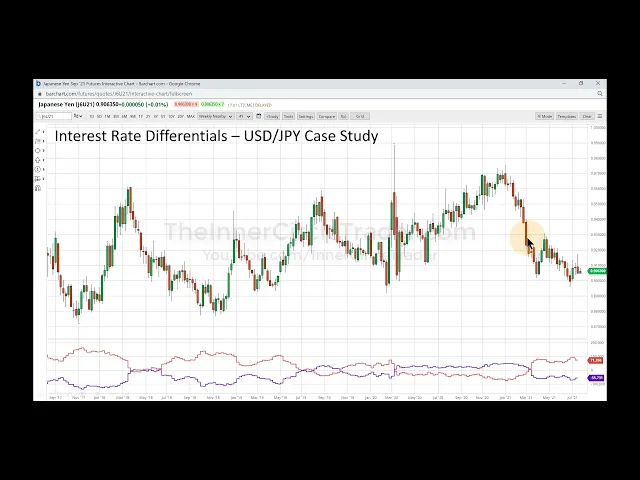
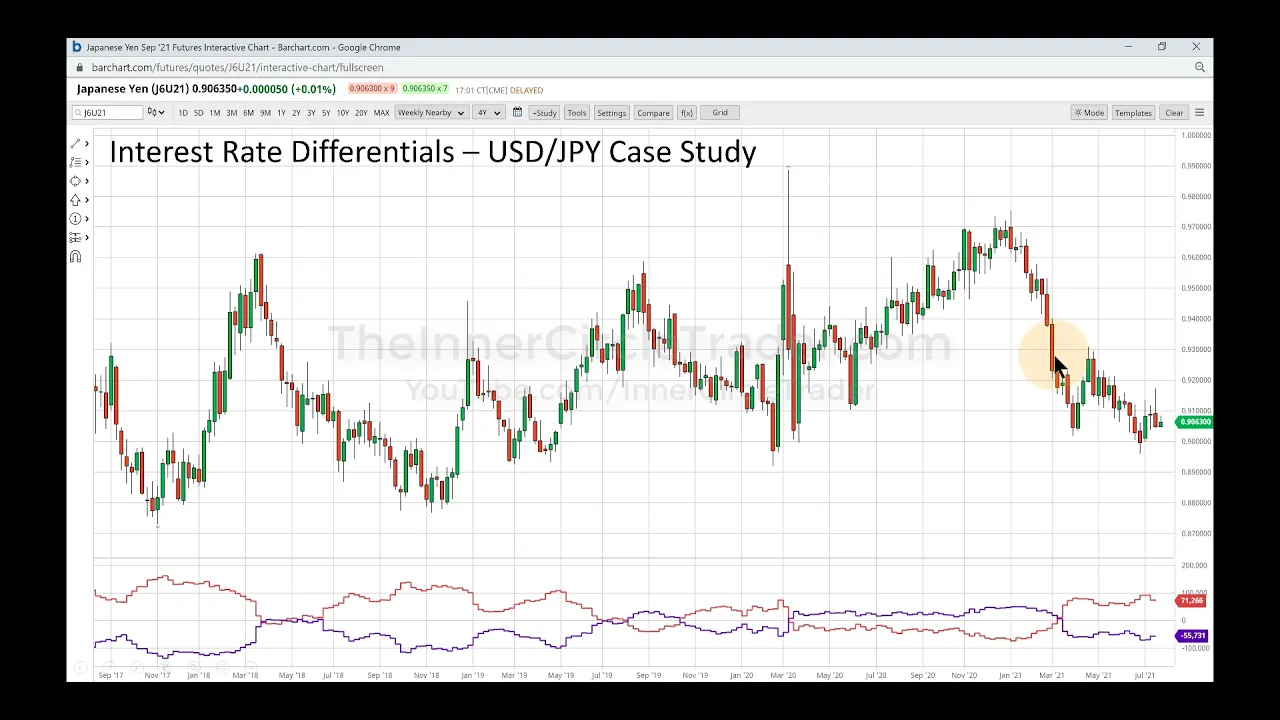
com now these are just suggested websites that if you google and you do some your own leg work you may find that there are other websites out there that you're more inclined to use or warm up to these are just simple generic websites that will provide the information for you for free you don't need to subscribe to anybody's service you don't need to be a part of any specific platform this information is 100 percent free it's just a click and research and that's it the global interest rates are the quote-unquote fundamental driver that sets the tone for long-term macro price movement the commitment of traders shows you a visual representation of what smart money is doing and how they're positioned periodically now by blending these two elements it gives you a real measurable and quantitative perspective on what smart money is doing or in this case what market makers are interpreting price on a long-term basis that's how you start with the question of what's bullish what's bearish notice i'm not talking about trend lines i'm not talking about moving averages i'm not looking for any of those types of things this is what interbank traders concern themselves with this is what they're looking at how do you plan your analysis well by looking at these two specific points of interest you're going to come up with a buy program or a cell program very simple now what does that really mean though well let's go further when you go to barchart. com we're going to assume that we're going to be pulling up a currency and we'll use japanese yen here as an example you're going to see that they have a select commodity tab when you click that tab the drop down menu will appear you scroll down to currencies and you pick the currency that you're interested in studying in this case we're gonna use japanese yen you click on that your browser will take you to this page here what you're looking for is every one of these particular lines aren't necessarily one that you're going to be picking the top you're going to be looking for the one that has the highest open interest so it's the line directly underneath this one the top one is cash you can't plot the commitment of traders data on a cash chart you got to use a futures chart so the highest open interest rate now is the september contract for 2021 and you can see the open interest is 196 469 contracts that means that's the open interest or available open interest that's in that particular contract month after september's contract expires because we're talking about futures here it would roll over to december 2021 and the open interest would rise from 958 to whatever the highest open interest would be before it expires and then once december 2021 expires it would roll over to march 2022 where it only has six in the open interest slot now that would only increase considerably after the december contract starts the midway point of its life cycle when you have this page here you would be clicking obviously on the second one which is september 2021 once that occurs this is the page it would take you to and look at the upper left hand corner where it says interactive chart you would click that link at this point here and it would give you this chart once you're on this chart you're going to go to the little tab that says plus study when you click on that you're going to see an option to put in an indicator okay when i say that i understand that we're not looking at something like an rsi or a stochastic or a cci none of that stuff is useful okay you don't need any of that but the commitment of traders you're going to type that out commitment traders and by the time you put in com it'll offer that as the option you just click on it and then once you click on it it'll open up this little window you're going to click on the little eyeball next to small specs and that'll put a line through it and then you'll click the add button when you do that you'll get the commitment traders graph applied to your chart it'll post it on the bottom of the chart you can toggle to the top of the chart or leave it at the bottom historically it's always been seen underneath price charts but we'll get to that in a minute the other link i gave you is globalhyphenrates. com and once you go to that website and you click on interest rates and you know the central bank's breakdown or summary of current interest rates page will open up this is basically what it looks like now each one of these columns are active in the way that if you click on it it'll sort it like a spreadsheet now if you click on the country or region it will put it in alphabetical order if you click on current rate it'll do it from high to low or low to high vice versa or if you want to know which one's changing direction for going up or going down you can toggle that and it'll list it by that way as well or you can do a search on how the rate was previously and when the last time that rate was changed at the central bank level for now the only thing i want you to focus on is toggling clicking this and then sorting them by high to low okay so or low to high doesn't make a difference but you want it in a list that increases or decreases so that way you can find things rather quickly now there are some countries in here that i'm not interested in for instance the israeli interest rate i'm not interested in trading that i'm not interested in the polish interest rate i'm not interested in the czech interest rate or the hungarian interest rate what i'm looking for is like the majors like the swiss franc the japanese yen european interest rate from the ecb bridge pound for great britain obviously the fed from united states canada's bank rate new zealand's bank rate so it's basically the majors all right so australia is another one in here it's the australian dollar so you have all the majors in here and what their respective current interest rate is now when you're looking at the interest rates you want to toggle them obviously however you want to sort them you want to sort them by specific country you can click on this and it'll toggle all the countries by alphabetical orders that way you can find the majors that are coupled with the dollar or a cross of your choice quicker that way and then visually go right over to where the interest rate is at the moment now i'm going to talk to you about interest rate differentials what is an interest rate differential well it's the difference obviously between one country's interest rate versus another and why is that important well the importance is that on a central bank level and an interbank level large flows seek yield and that means that they're always looking for a rate of return now would you rather be in a country that has an interest rate of five percent or would you rather be in a country that has an interest rate of two percent in other words you have the ability to make five percent or two percent which one would you put your money in well hopefully you would be considering the five percent well large flows and large interest and yield and speculation they think the same way so how do you get the information on which country has the highest yield this list right here and obviously as a foreign exchange trader that you're aspiring to be or maybe you are you're just not finding consistency this will give you the foundation to finding real markets that are really engineered to go a particular direction but you have to look for something specific and that's the differential so it's not enough to simply look for a high yielding interest rate country you need to find a high interest rate yielding countries currency and couple it with a weak currency for example if you look at japan right here okay the japanese interest rate for the central bank of japan its interest rate is negative point one zero now in this list if we found a currency that has a high yielding interest rate relative to that negative 0.
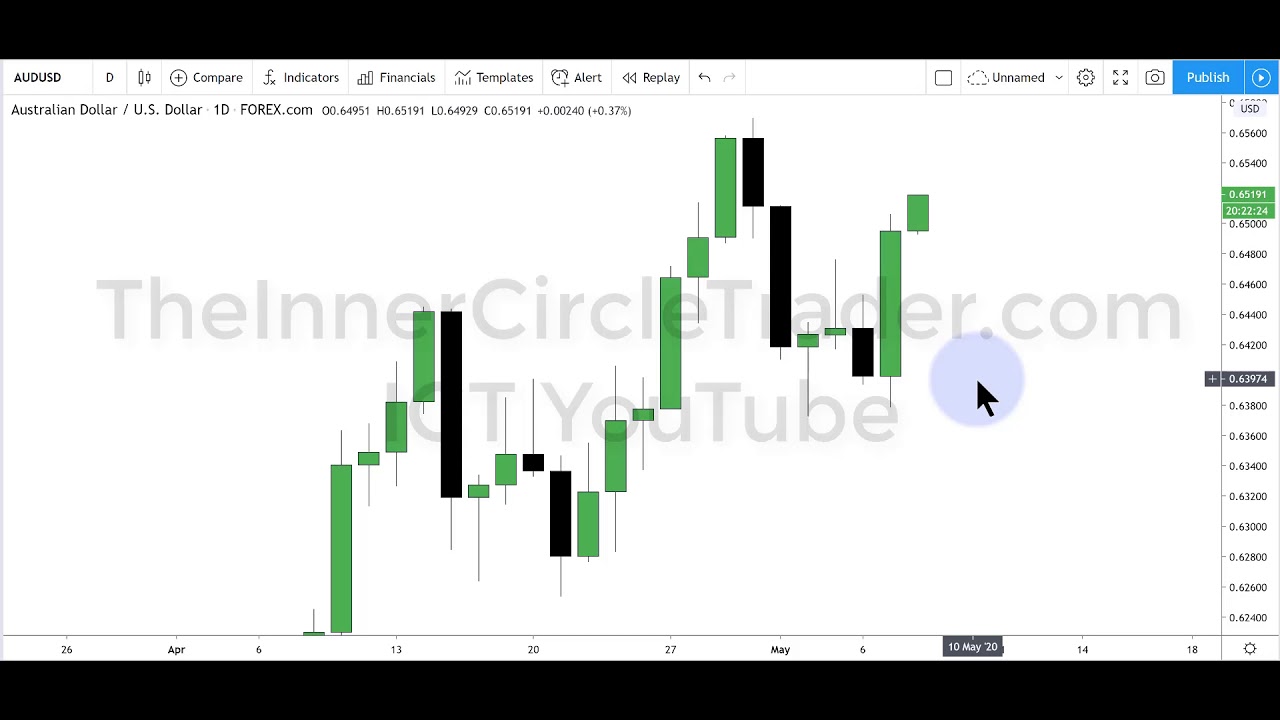
10 from japan we'll look at the fed's current interest rate at 0. 25 percent so there's a differential between the two the higher interest rate is with the fed or the american dollar versus the japanese yen meaning the differential is positive for dollar and negative for yen now since we have that fundamental backdrop on the interest rate front we know now we can go into the commitment of traders chart and we're looking at the dollar index now typically i don't really like to put the commitment traders graph on the dollar index and the reason why is because many times it could look like this where it doesn't really give you a whole lot of information in this format now there's a way to obviously change this and draw more information from it but majority time it looks like this and it won't give you the movement above the zero basis line now the zero basis line what we're interested in is the red line that's the commercials the commercials we'll just call them the central banks okay when they go above the zero line that doesn't necessarily mean it's a buy and just because they're below the zero basis line doesn't mean that the dollar index is going to go down what we're looking for is a combination of interest rate differential and the highest long position net long or lowest net short position held by the commercials now since we're looking at the dollar index and we're thinking in terms of it being a higher interest rate which is you know it's really not that high of an interest rate it's only a quarter percent but in relationship and contrast to the rate of the bank of japan being negative point one zero dollar has the better interest rate so what we're looking for is a time when the dollar has the commercials being above the zero line we see that here in the latter portions of 2020 in december into january notice that the red line is higher than it's ever been in the past few years so they're net long here higher than they have been in recent time at this moment in the chart now this by itself is bullish only if we see the opposite with the japanese yen because remember what we're doing is we're matching up a strong fundamental interest rate differential against a weak interest rate differential that being dollar versus yen so if we take a look at the yen you can see as we crossing from december into january 2021 the commercials have never been this net short in order they're thinking that it's overbought and it's likely to go down at this point right there so anytime in the past in this chart they've never been as bearish or below the zero line as they were right here and by itself it doesn't mean anything you want to see a break in market structure and if you look at this swing low right there you see a low with a higher load to the left and a higher load to the right many of you to understand market structure would be looking at this low being broken and that's the market structure break for you that's not what it is for me this is a swing low the highest of all these candles up here until it finally broke down this being broken there is a market structure shift or break from me once this occurs then all of the understanding of this outline for you where it's bearish for yen bullish for dollar and the interest rate differential will now kick in then the algorithms will start to reprice yen lower and dollar higher or consolidate dollar presently we've been seeing dollar consolidated but yen has been allowed to reprice lower so how's that translate to a 4x chart well here we have the dollar yen because when we're pairing the weaker against the stronger using these differentials the two currencies are dollar and yen so the pair name is dollar yen and that's what we're employing here for the charting purposes the chart is plotted on the basis of us dollars versus japanese yen and we're using the stronger fed rate versus the weaker japanese rate so this translates into expectations that it would be bullish for this chart because dollar should be going up while yen drops and it would be basically bearish yen thus dollar yen should be expected to rally higher and we obviously see that here here's december crossing into january short term high broken so then we have a break in market structure now the algorithm will reprice dollar higher against yen and that's what you see here now this is not a small move folks this is pretty significant but this in itself is the basis to understanding how to find markets that should be moving in one direction but you're doing it in a way that is done like an interbank trader it's not some willy-nilly guy that puts tdi indicators on his chart calling all kinds of moving averages and chasing price we're looking for real measurable and quantitative means of determining what these markets are going to do it's not hypothetical it's not subjective it's very specific things that you're looking for and you go in looking for these types of moves to be the foundation to majority of your trades now if you trade in this direction and you're buying you can be a short-term trader being a buyer you can be a day trader you can be a scalper you can be a position trader swing trader every facet of trading disciplines can be employed by being bullish on dollar yen okay now we're going to be looking at the interest rate differential in the cad yen this is going to be a case study for it so we're going to be looking again at the japanese yen which is a weak interest rate negative 0. 10 and the canadian dollar has a interest rate the same of what we referred to in the dollar index it has the same rate so right away you should know that it should be bullish canadian dollar bearish japanese yen but we have to go behind the scenes and go do a quantitative analysis on what the actual positions are by the smart money because the commitment traders gives us a graphic depiction of their real trading of their real positions it's not just well this should be bullish or this should be bearish okay that's the precursor the interest rate differential is the precursor it doesn't mean just because one interest rate is higher than the other that the chart is going to be anytime you sit down in front of it it's a good buy or a good sell relative to that differential you need to know that that is just the fundamental backdrop or underpinnings in the marketplace then you have to wait for smart money to position themselves then once that's there the algorithm will reprice all right we're looking at the canadian dollar futures market this is the september 2021 contract on barchart.
com and this is the symbol you would use to see it okay and plotting the commitment of traders now if you recall back on the globalrates. com or globalhyphenrates. com website when we were looking at canadian dollar you probably didn't notice it since i didn't mention it i apologize but if you go back to that list or rewind the video rewatch it or whatever you'll see that in march of 2020 it showed that it dropped about half a percent from 0.
75 down to 0. 25 percent so it's a quarter percent from three quarters of percent so the interest rate actually dropped a half percent in march of 2020 just from looking at it from face value some would say oh that's not good because the interest rates are dropping it doesn't make a difference here because what we're looking at is the differential 0. 25 is still better than negative 0.
10 so when we look at march here this deep dive down in price it happens around the same time that the interest rate announcement comes out and even though the interest rate dropped a half a percent it's still a positive interest rate versus a negative interest rate that's seen in japan so right in here when price is consolidating look what's occurring here we have a big buildup of net long positions by the commercials they're above the zero line so they're bullish okay so they're bullish at the time when the interest rate differential is positive for canadian negative for yen later on as we get into the end of 2020 we move from bullish to negative below the zero level this swing down doesn't change it being bullish it just means that we're in a strong trend and these relative equal highs up here and some of you that are new to think that this isn't equal it's relative okay it's we'd look for this to be taken out okay in other words there's a lot of buy stops up there just like this is relatively equal highs but it didn't take long for it to get above that there but from a long-term perspective and this we're focusing on this high here should be challenged and we've seen it here now i know some of you may be new to me and this might seem like well this is obvious to talk about it in hindsight but i promise you this stuff repeats all the time every three months every six months every nine months every year okay it works all the time but we're in a year that followed a really weird year because of all the illness related things and i'm not going to say anything more than that but even with that this information still fairs out moves so we have a net long position here that's bullish at a time when the interest rate has dropped so since 2016 the negative rate on japan hasn't been changed so we had a change in the interest rate on the looney or the canadian dollar so that rate dropped a half percent but still remained positive rate in contrast to what japan's rate is negative 0.