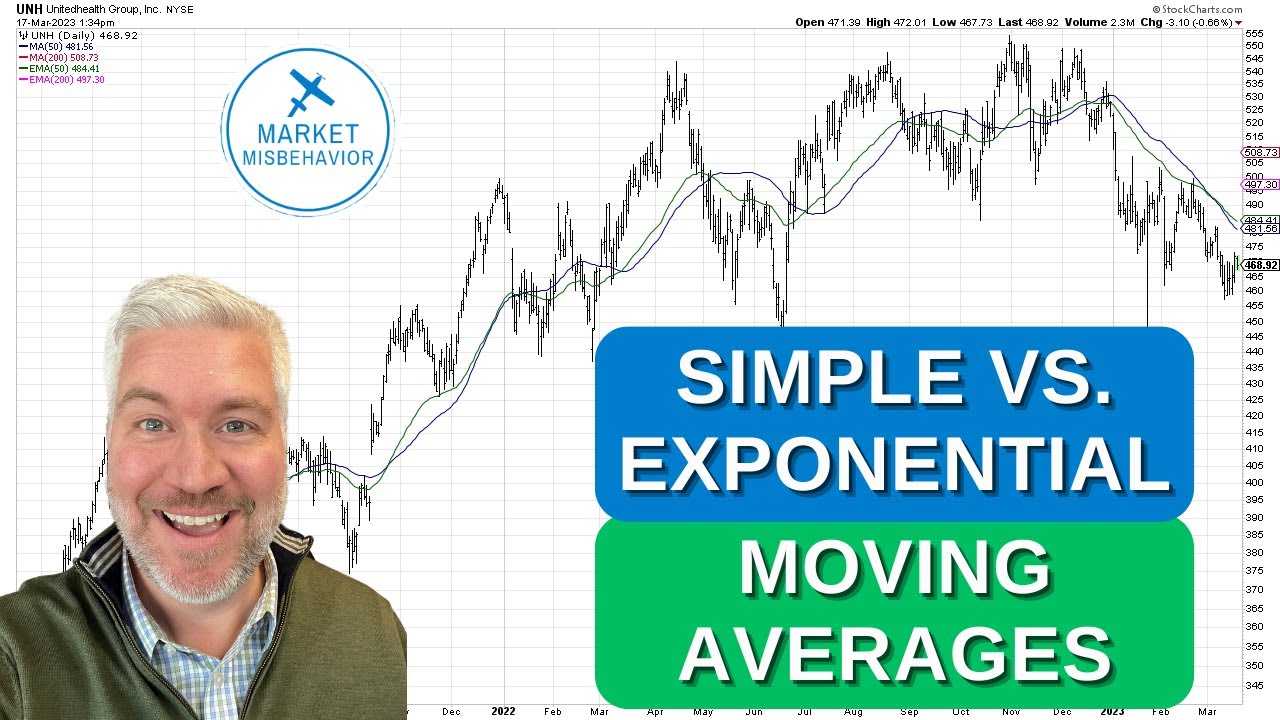
[Music] all right hi again the next topic that we want to uh cover is the moving averages so this is a uh a fairly big chapter um in the in the books and so you know and what we need to take out of it um varies whether between cmt1 and cmt2 um but there's a lot of overlap here so we're just going to C cover this cover the material and at the end we'll sort of go through um what you need to know for uh the exam coming up um obviously moving averages they're one of
the uh the key indicators that we use um often there's many different indicators that are based on moving averages and it's just a great way of smoothing out the data so you know it is very simplest form um you know when we we look at an average so let's say we have a 10 period moving average what we would do is we would count the closing price over the last 10 days add them up and then divide that number by 10 and that's the value for today and then tomorrow we'd go back 10 days and
do that all over again and so you get this nice smooth value so it takes a lot of the volatility out and a lot of the spikes out of the um data and it's really helps us um identify okay well if the moving average is going up well the trend of the market U must be going up uh and so it it's really nice for that the thing is that we do call it a lagging indicator uh and the reason for that is that as the um uh the market starts to roll over then it
takes time for the moving average to follow because the moving average is still being pushed up by the uh the previous values there um shorter periods on a moving average faster longer periods are slower um you know and how you use them really depends again on your trading strategy and your trading Styles um you know slowing moving averages they less acceptable to a single outlier making a a big jump in the uh in the in the values or the calculation um and so it's it's a lot less likely to pick up false Trends now the
tradeoff on that is that it's going to take a lot longer to identify a trend break you remember our goal is to find changes in Trend and identify changes in Trend but we're not going it's going to take longer to do that with a longer term U moving average so with many many indicators and technical analysis this is really the trade-off that we're battling on you know we could have a really nice tight fast moving average and as soon as the price breaks above it we can say right we're in a trend and then two
days later oh no it went the other way and we're getting this whip saw in and out um of the market um but when we right we were right really quickly the uh tradeoff is that no let's lengthen our moving average let's wait for confirmation means that the Market's moved quite a bit before we say okay it's in an uptrend now I'm going to participate but there's less chance of being wrong uh in those trades so again what you choose in your analysis and your trading uh is whatever's most suitable to yourself just making sure
that I covered everything um Rising moving averages signify uptrends falling moving averages signify downtrends um one of the most common techniques uh ways and very simple trading strategy is just simply to use two moving averages a fast moving average meaning slow uh sorry low number and a slow moving average which is a higher number you know typically 1040 or uh 5 and 25 you know a typical numbers that um we've seen being used um and so it's just a you know a a pretty simple way you you take a situation like this and you can
say right when the fast moving average hang on I'm looking at the wrong screen let me move my cursor over here and turn on the uh follower there we go now you can see where I am so when the fast moving average crosses the slow here um you can see that yeah that would have been a great buy now this is a beautiful example of uh a moving average crossover trade obviously back here not so good good you know we we're crossing here based on this strategy and we would have been out there uh and
again here so a couple of losing trades there um as well uh so you know it as I said it's a very simple one there is some Merit to this and we'll talk a bit later about how we can overlay some other techniques um as well but moving average crossover um very common something that you need to be um aware of as well um just trying to get my cursor back here L my there we go all right the next moving average that we uh want to talk about is the weighted moving average now weighted
moving averages uh are working on this whole concept of the most recent data is the most important uh and so what we want to do is give that an extra weight so if we were doing a 10 period weighted moving average then today's dat or the last piece of data we have would be multiplied by 10 yesterday's multiplied by 9 the day before multiplied by 8 uh Etc um and so we do that and then we divide all of those numbers by the sum of uh all of those let me give a simpler example if
we had a two period weighted moving average uh we would multiply today's price by two and yesterday's price by one add them together and then divide it by three 2 plus one so you can see that as you get longer and longer that number that divisor gets bigger and bigger so but that's what a weight of moving average is doing it's trying to put more weight um on the most recent data to try and make the uh calculation um adapt a lot faster and you can see that here on the chart so when we look
at the chart here you can see the red line is our weighted moving average and it responds it it follows the dat a lot closer than the simple but the other really telling thing which is important is you can see that it reacted faster you know and this is one of the criticisms with the simple moving average is that we had the market roll over here yet it took quite a bit of time before we saw the rollover happen on the uh the moving average and so as I said that's trying to um uh deal
with that um just again checking my notes to make sure sometimes called a l linearly weighted moving average again a mouthful um the next one we've got is the exponential now CMT one and um CMT level one you need to know the simple and the exponential I would still recommend knowing all of them there have been some questions um that have taken people by surprise so understanding the different types of moving averages and how they're calculated cmt2 you definitely need to know um all of these and how they're calculated and be able to um you
know know the calculation because there are questions like that so the way the exponential moving average differs is that it never actually cuts off so remember um when we were talking about the simple and the weighted if we had a 10 period as time goes on that window moves and so if there's a really big um value at the end that then drops out of the calculation and you can get a jump in the moving average not because of necessarily a rise in the latest value but because a really low value in the past dropped
off and we call that the dropof effect and again that's a term you have to know it will be in the glossery um but the exponential moving average tries to address that by never actually dropping anything off so what we are are basically do is that as new data comes in um the the exponential moving average takes our previous EMA value or exponential moving average value and it adds that to a to the latest value and then works out a function and so it it never really gets rid of the previous values and we we've
got the calculation here so the weight um for today uh as you can see here is is equal to 2 / the number of periods plus one uh is the way so if it was a 10 period EMA then it'll be 2 over 11 uh and so that's the weight that we give to today's price so whatever today's price is we're going to multiply it by 2 over 11 uh and then uh we take the the value of 100 minus that weight that we just calculated and give it to the multiply to the previous one
so again you can see here this little calculation I've done if the periods were 10 then the weight would be 18.18% and the weight that we give to the previous value is 81% so you can see in 10 you know in a simple moving average well the weight on today's value would be 10% but in this um uh exponential moving average the weight on the latest value is 18% so you can see that it's getting more weight um and then the previous value is um 81% so let me come back here where's my cursor gone
again um and in the calculation here you can see our EMA it's made up of those two calculations you know the weight um of the uh the price today or the 18% multiplied by the last price please remember 18% is only true for a 10 period period EMA you'd have to recalculate for any different length there so the the weight Times today's price plus then the the um remainder weight times the uh the previous exponential moving average value uh and so it's it's really nice and again you can see now on the chart here we've
got the blue line it um reacts just as fast as the um the weighted moving average um doesn't follow it as tily uh and that has its own set of um pros and cons you know depending on on how you uh you want to look at that um but definitely is a uh a much better version of moving average you'll find that EMAs are used in many many different technical analysis techniques you know a lot of the tools we talk about use moving averages the foundation lots of them like macd and uh Etc you will
use the EMA uh in their calculation um and the great thing about this from a calculation point of view is it's actually pretty easy because you don't need to have this rolling window that's always going back you can um really just work with today's price and yesterday's price um and then use the factors uh sorry today's price and yesterday's EMA value and then use the uh the factors to work from that all right another one Wilder moving average now this was developed by Wells Wilder in 1978 it's again a really common way that people do
a moving average calculation um and again the reason why this was popular was particularly almost like pre-comp computers it was much easier to do than to have this rolling window and keep going back and calculating over um 10 periods of time um so what Wilder suggested and he used this in his ATR tool and his RSI tool all use this method which is why this one's so important basically if I did a 10 period moving average and let's just say that calculated out to be a average of 100 well I know that I um uh
multiplied it you know sorry divided it by 100 uh sorry let me start again I know that I divided it by 10 to get that value of 100 so what I'm going to do instead is multiply it by nine or 10 -1 uh and then I'm going to add today's price to it so again it's it's very similar to the um exponential moving average where we're not going to have the drop off effect we're not going to get hit by by data points that drop off as as quickly and we're just using today's values and
yesterday's values and and the uh the moving average is being adjusted as time goes on um but it's a lot more even than the um exponential moving average um again it's just different techniques people are using you good to know how this calculation because as I said many different technical analysis techniques will uh use this all right uh it does lag you can see the orange line on the chart there it will lag behind the uh the other forms geometric moving average uh again another important one mostly used in um indices um where this is
really also used is when you're averaging returns so you know if I had a um strategy that returned um 5% one year um and then um 10% and then lost 5% well what's my average you know a simple adding up of those you know the the plus plus 15 and minus5 would make you think oh was that an average of a 10% return but then that's got to be 10% annualized and there's there's a lot of little uh things about that the way we normally do these type of calculations is to use a geometric where
we're using um it's almost like the logarithmic or the percentage um changes and we are averaging those now the calculation is quite different um from standard uh for doing the exams you do need to know this calculation uh so do make sure you remember this and the way you do it the simple way of doing it is just simp simply by multiplying the uh the values uh that's supposed to be multiplied by P2 not just two I don't know what happened there so we got P1 * P2 * P3 you know all the way up
to PN and that value is raised to the uh the power of the inverse of how many elements there were so quick example if there were four numbers um you know four values that we were working with then what we would do is multiply those four numbers together and then we would put that to the power of 1 over4 or you could do it to the power of 0.25 so there's some of these calculations you know you do need to know and you do need to understand um and be able to um remember when you
actually plot a geometric average so like we do the the other ones it's virtually exactly the same as the um the simple moving average so there's not that it gives any really better signals uh again the reason why this one's important is because of portfolio returns and things like that which we talk more about through the uh CMT courses all right centered moving average this one's a little more used for cycle analysis it's not so much um um signal based because what we're doing is we're taking a simple moving average and then we're offsetting it
back um we we're setting it back by half of its length um and people like um uh Jim Hurst back in the early 70s were doing a lot of work with this to um use it as a way of identifying the primary Cycles in a market and when we talk about Cycles we'll come back to this point uh and and talk about that it's um it as I said it's a nice way of sort of getting the idea because remember if we're averaging 10 periods of time but we're plotting the data point right at the
end then it's almost like this average I me that's part of the reason for the LA is because the average is averaging data that was in the past so by doing it this way um and centering it and moving it it it helps we do a little bit of a regression algorithm to try and estimate where it's going in the future that last uh section of data um but again just another one to know I doubt there'll be any questions on centered moving averages in the exams uh triangular moving average is now we got two
concepts now we talked about this in the introduction multiple authors you can start to get an overlap of Concepts so this is a a great example of that we have a triangular moving average which kpatrick talks about being a moving average of a moving average and when you do that you would do it at half the length so if we start with a 60 period simple moving average the green line on this chart then the Triangular moving average would be a 30 period moving average of that moving average uh and you can see that in
the uh in the software if you get the workbook you can play around with that um in in this software what you do is just right click on the first tool and add a second tool and so it it um puts them on top of each other there it's really nice because it it gives you again this level of smoothing um better reflects the trend of what's going on but with all averages the more averages you put on like this the slower it's going to be be to respond to a change in Trend it's that
tradeoff between a smooth value versus being adaptive to the market now the um calman in his book talks about a triangular weighted moving average so you got to keep those two concepts a triangular moving average is two moving averages on top triangular weighted is actually something quite different now in the uh the text you know sorry in the weighted moving average what we did is we put more weight on the most recent um data point in a triangular weighted moving average we are putting more weight in the middle so think of it like a a
triangle like this where the weight at the start is low and the weight at the end is low and we're putting more weight in the middle it was really a way of trying to do what the centered moving average did um and and give it to be more of an average of of what was going on there um so for instance for a 20 period period moving uh 20 period triangular weighted moving average the 10th period would have the greatest weight calculations are the same the math is a bit of a nightmare um you won't
be expected to um remember any of the calculations on this but you will uh be expected to uh know what the difference is between triangular and triangular weighted all right variable EMAs is another variant uh again I don't really see that you're going to get asked anything on this it's really if if it does come up it all it is is like the um 18.18% that we did with the exponential it's just trying to use volatility and adjusting that weight um based on volatility uh or some other type of metric and there's a number of
different metrics um that are available but that's what's meant by a um variable um EMA so we've got a summary here um obviously that you can see in your notes it's a um summary of the different moving averages and and you know handy page to print out and make sure that you remember all of those um for the exam calculations you need to know you really need to know how to calculate a simple moving average um even um weighted you know having that understanding the exponential um again Wilder even I would say geometric you know
definitely you want to know how to um be able to uh calculate that in raising to the inverse of the number of elements uh very important there as well all right so how do we use moving averages what are the different ways that technical analysts will use them you know the first one is simply as a Direction as a indicator of trend you know if the moving average is going up then we can say the trend is up if the moving average is going down um then we can say the trend is down uh and
so that's probably the simplest now the other way is simply to say well where is price in relation to the moving average and this makes it a little little more adaptive than just simply up and down see if the if the price is currently above the moving average well then you know the moving average is going to be up in the future anyway and we can basically say well the trend is up uh if price is below the moving average then obviously the trend is down and and we're pushing down where that is so you
know you can even see here uh hang on let me jump over to the right chart uh you can see through here we broke down below it you know it would be fair to say at this point hey Trends trend's going down of course we'd like a little more confirmation but then as we get into this Zone obviously price is below the moving average and it's very clear that the uh the trend is down through this whole period as well um what we've done at the bottom there is just a division between price and the
um the simple moving average which makes it really easy for us to S tell green is when the trend is up and red is when the trend is down uh so just a a nice little way of doing that um the other way people do use moving averages is as a um support line uh or even as a trailing stop line you can use it as well so you know even in this scenario of looking for that um swapping between uh uptrend and downtrend well if I'm going to get a trend break and I remember
our whole goal is to capture Trend then what I can say is well when I cross that line then that's it you know I'm out of my trade I'm not going to hold and either I make reverse stop and reverse or maybe that's just it I'm out and I'm looking for a new opportunity uh let me see determining price extremes prices return to their average we're talking there more about a mean reversion strategy um you know uh people have recency bias you we've talked about that in other sessions where they look at price and and
there's this oscillation around averages and things like that when you start to see an extreme and those sorts of extremes distances away from the moving average haven't been sustained before you've got a really good uh shortterm mean reversion trade opportunity there because the expectation is that the price is going to revert back to its average or its mean uh so yeah another thing and there's a number of mean reversion tools that we work with uh as well the other ones uh hang on let me just see this make sure I've got my notes uh giving
specific signals um either by Crossing uh price so if close crosses above the moving average that's a great signal or using two different moving averages and looking for crossovers there uh very traditional way of looking at that as well um especially moving average crossovers are great in trending markets when you've got a market that just goes up and it goes down and it's you know Wonderful uh get some really great results really nice safe trading uh if you're working with a market that goes sideways oh it is awful moving average strategies just don't work in
that scenario uh but we do have a solution that we're actually going to talk about with the directional system uh coming up um probably of the four ways this is from K Patrick's book he would say that the um uh using it as as a way of trend determination uh is the most sensible out of those different strategies of how to use moving averages um but again moving averages are also a big part of other forms of technical analysis and uh they they provide a great smoothing algorithm even stochastics you know stochastic which we'll talk
about later uh we'll use moving averages to smooth the values and then use an average again to smooth it once more uh so it's you know very interesting there all right directional movement so this was a concept that was developed by Wells Wilder um back in the 70s early 80s um and and what he's looking for here is um basically this whole system of adx which is these are the building blocks to the adx indicator which is a really powerful trend-based indicator so uh he developed it in his book new Concepts technical trading and what
he was doing was comparing one bar with the previous one and either looking at the lows um uh all the highs um you know and seeing which was the uh the greatest between them and he would Define movement as either movement was positive or movement was negative now for movement to be positive it meant that the high of today was greater than the high of yesterday for movement to be negative the low of today was lower than the low of yesterday when you had both so if you look at this sample here in this outside
day where we've got the uh the high being greater and the low being greater well we can only take one of those values so we would measure them both and we would take the uh the biggest of the two numbers so they became the values and whatever that distance was so whatever this uh D this distance here it was added to the previous value for DM plus and there were separate um calculations for DM plus and DM minus uh and and they were tallied as the uh the data was analyzed um let me come back
over here and jump to my next slide so the other thing that um um Wilder did was also calculate the average true range now average true range will cover later it's a great volatility measure because it's looking at the relationship of this bar compared to the previous 14 bars and and looking at um what is true range so true range is looking at it saying let me go from the high to the close or the low to the close or the close to the close oh sorry or the open to the close and and let
me see which is the greatest range out of those three values the greatest one is used for today and then we average that over the last 14 days when you start to get really volatile spikes that average true range increases and becomes as I said a great way of measuring volatility um so Wilder would use the ATR and the directional DM plus and DM minus and you work out a ratio between them and that's how we came up with these two lines that you see on the um the directional movement here so the red line
is the DM minus the blue line is our DM plus and so when we're in periods of downtrends well remember we only count either the the minus movement or the negative movement or the positive movement and so as time goes on if we're not counting positive movement the positive values drop and the negative values go up and then as a ratio you start seeing this and so it's easy to see I can just look at this chart even if I didn't see the chart above it I would know that with this red line on top
that we are in a downtrend at this point uh and then we get to a point where the two values are overlapping meaning that we're probably in a sideways market and then eventually the the Blue Line starts to um uh go above the red line which is telling us that we're now in a uh Rising Market again uh let me make sure I covered all the notes there um true range yep that's uh fine okay so then from this these these two were the dmis DMI plus DMI minus uh because it's the ratio of the
DM value to the ATR value uh you get these areas where um you know said it's telling you which way the Market's trending um when the red Lin is above you know the trend is going down the shaded areas in green on this chart are where the trend is sideways uh and there's just this oscillation back and forth you're looking for a clear breakout um of that uh extreme readings again can be a really good indicator that we're getting to the end of a trend you know as you start getting higher and higher and and
you see historically there are these levels where the adx keeps bumping up against uh when you get there you know you wouldn't be putting on any any new positions in that Trend you'd be looking for a change of trend uh around about that time um all right so DX this is now where we take the difference between those two lines and so if we just took the red line and the blue line and we subtracted them that would give us the DX the a in the DX is an averaged um DX so it's an average
directional crossover and so what we are looking at there is what is the distance the difference or the average difference between those two lines uh and we actually take the absolute value from a math point of view because the green line here the green line going up isn't telling us that the Market's going up all it's telling us is the trend is getting stronger now this is really critical because this is a little bit unlike many other indicators that we're going to be talking about the the direction of the green adx line only refers to
the strength of the trend not the direction of the underlying market so again if we have a look at this chart here um let me bring the cursor across so in the situation here you know we've got this downward Market that's going on we've got the adx Line crossing above our DMI plus which is telling us that we are now in a confirmed um downtrend we've we've crossed over you know the red lines on top the green Line's getting um going up meaning the trend's getting stronger and stronger so the downward trend is getting stronger
and then we get to the end of the trend and almost immediately see this tool doesn't uh have the lag of moving averages you know as soon as we start posting a few bars in the opposite direction you can see that the trend is weakening uh the trend strength is weakening and so we can be looking for a uh a change over and then as we get into this sideways Market uh this goes down again now as the bull market finally starts taking off uh you can see that the green line goes up again uh
so for downtrends and uptrends the green line will go up as the trend gets stronger um and there's a number of signals that we can work out but you can see you know we've boled that here the adx measures the strength of the trend uh while the DMI eyes will show you the direction so all three lines need to be used um for that uh let's jump to the next slide um so here's a uh another way that we can use that so what I like to do you know these these vertical lines on the
chart here uh were created by a little algorithm which searches for peaks in the adx so we're doing it based on I don't think I noted it down uh on this one uh I think that's just like a percentage Peak so whenever we get a drop in a value we look for a certain percentage from the top and that confirms a peak that's why these lines aren't actually right on the Peaks when you look at the chart they're a little bit behind the um uh the actual Peak and that's because we don't know it's a
peak until we've got a few days um forward and then we can see oh yes that was a peak just back there so it's giving us the time of the confirmed Peak this is like number one rookie mistake that I see people make all the time when they're coming to technical analysis they make the assumption that oh there was a peak there I would have entered on the peak no you didn't know it was a peak until we got a few days out and so whenever we do analysis whenever we do signals and things like
that in uh in the software we're always very careful that we're not going back and trying to say oh yes we would have known that we want to know okay here's the signal this is where it's confirmed this is what we're going to work from and you can see on the chart you know if this was um remembering the peak on an adx is telling us that we're at the end of a trend and so we can look at this chart and say okay well how often was that right you know we've got a peak
here well it was a small run up above but um yes we were probably actually I would I should have left the other two lines on I would actually say that this was the end of the The Rundown there's just a little bit of a delay in um in the signal all analysis has a bit of a delay in it but let's take this run up you know so you can see below that the adx is rising um we get the peak and gee that's a nice signal you know that's really at the end of
that Trend we're now going into sideways we know it's sideways look how the adx just fell away so just dropped away no conviction you know you do not want to be taking trades when this adx is pointing down uh because it's it's telling you that we're in kind of this directionless time there's no strength behind the trend uh and so you know you wouldn't be doing that we're still flat here uh getting a couple little Peaks but really they're not significant and then again we get this run up the trend is getting stronger look at
the market went up and then we get our signal out here saying okay Trend strength has rolled over uh we we're expecting it um to roll over again so the Peaks are telling us at the end whether it's an uptrade or a down trade whenever we get a rollover on the peak we are looking to um exit that trade whenever we get troughs on the adx that's telling us that we're in a dormant market and that there's it's quite directionless and there's yeah you could say there's consensus between the buyers and the sellers and so
you know we wouldn't be looking at that um so there's a couple of trading rules here which are worth looking at for um adx so we only want to trade um long when DMI plus is uh greater than DMI minus we' already covered that so the the Blue Line's got to be greater excuse me than the red line for a long trade um and vice versa for a short trade don't use Trend following strategies when the adx is pointing down uh like we just said you know when that green line is pointing down on the
adx we don't want to be um uh going in and saying ah let's go try with the trend it's really an early indication that the trend may be finishing um when we have the adx below both the red and the green line the two DMI lines that's telling us that the market is directionless uh and so again it's a thing of a sideways Market stay out now remember we were just talking about moving averages and moving average systems uh and I think actually we've got an example in a moment um that's a great way of
saying I'm not going to take that moving average signal when we're in a directionless market I want to wait for Clear Trends before we do that um when the adx is rising it is telling you so particularly as as it's been down and lower and then suddenly starts to rise it's like saying the Market's waking up there's opportunities coming here um so let's keep an eye out for that and a great signal really is the crossing hang on I'm looking at my wrong screen let me come over here this crossing here here and I've drawn
a vertical line all the way through um for this one when the adx crosses the bottom line in this case um it's it's crossed the uh the DM plus um it's a great signal uh that's worth looking at and taking um going forward uh so yeah some some good signals there uh good good entries uh based on that and then the relationship there you know tells you where to go um all right let me come back over here and then remember I just said about the moving average system with the adxs uh again we can
look at this and say okay the green arrows on this chart are all the signals that we would have had with just a um price crossing a 20 period moving average um but what we've done with the Red Arrows the bigger ones is we've said let's take price Crossing above the moving average as our Buy Signal but we're only going to take it when the uh the adx is increasing um or let me just double check my notes here um yeah when the when the adx is above 20 so when the adx value is above
20 means we're in a strong Trend um that's when we're going to take um our signals lot less signals to take but they're a lot better than getting whip sword in and out by a standard moving average system all right the next part uh that we want to talk about then is envelopes and bands and channels now envelopes and bands are very similar and uh you can get very confused about which is which basically an envelope is where you've got something like a moving average and we offset up and we offset down by some sort
of fixed value be it a a percentage or be it a fixed amount of price units uh so a moving average bands is a great example of a um an envelope where we have the Central Moving average and we say right let's just add uh 1% um above and 1% below and then we have this band that follows now the reason we use this is when you think again of a of a system where price may be Crossing through a moving average and that's going to be my signal to buy you can get this scenario
where price is above and then tomorrow it's back below and then it's back above again and you get this whipsaw going on back and forth um over the signal and get all these signals which is horrible when you're wanting to create a trading strategy so a way of dealing with that is to put this envelope on and saying well I'm only going to enter once I clear the band uh the envelope and then I'm only going to exit once I clear the other side and so it just puts this nice little filter there and makes
it so that we don't get whip sword in and out um as we go reduces those unprofitable trades uh it doesn't account for volatility though that's the the key thing uh to remember now the Shaded zones on this chart is giving an example um of you know the green is when we would have been in a long trade um based on that idea of trading outside of the um the envelope and then only exiting when we come back in and you can see that it's done a great job of uh making some nice trades there
and even in this sideways Market you know I mean we pretty much got a break even trade there um but kept us out of whipsaw um through that period of time all right uh next one is bands uh most common you may have heard of is Ballinger bands developed by John Ballinger often speaks at the MTA events uh he developed these back I think in the 80s sorry John if you're seeing this and I've just aged You by 10 years um but the idea was we take the moving average uh and then we calculate the
standard deviation now standard deviation statistical term uh please don't be scared off we're going to explain all the statistics that we use in another session um but the idea is that if I've got an average so let's say I've got 10 prices and I calculate an average of those prices that average is made up of 10 different values that may be above or below the average what we're doing is we're measuring the difference between our calculated average and each of those 10 items and we call that the variance and then they gets square rooted uh
squared each of those get squared to take sign out get square rooted that's the standard deviation but what it is is a really nice number where we can say here's our average but here's the standard deviation above and below and it's just giving us a way of describing how accurate is our average you know the classic example is that if I had three numbers I had 49 50 and 51 well the average of that is 50 but if I had 050 and 100 the average of that is also 50 so the average alone doesn't give
me any idea about the volatility or the spread of those um numbers whereas when I use standard deviation you know you have to do the math quickly in my head but you can see the standard deviation would be very very different because the variances are much much smaller on the second set the 050 100 standard deviation is probably out of 25 or 33% um whereas for the um uh first set of numbers it's at. 3% so very important now what John Ballinger did with these bands is he used standard deviation as a measure of volatility
he said let's calculate our moving average over that look back period of the moving average let's calculate the standard deviation and then we want to capture 90 to 95% of all of the observations so we're going to set that at two standard deviations again we'll talk about this later typically when we're talking about statistics three standard deviations or three and a half gets you complete coverage of all of the uh a normal statistical data set um but yeah we uh so that's why John Ballinger um picked two and created these bands so what you can
see on this chart here uh is the Central Moving average the bands which look at the um the standard deviation and you get these um bands that go up and below the price um 20 period simple moving average with two standard deviations above and two standard deviations below and there's different ways that you can um use that so as I said it should account for 95% of price action and that's on the assumption that again statistical terms that prices were stationary and normal the distribution was normal it's not quite the case in in markets so
it's not a random um uh price action uh but never neth less what we do see is that prices oscillate between the band extremes uh so you know we can we can look at that um breakouts or when the price breaks above the high band and the low band uh we do also we can use also use those as signal so again this green shaded Zone uh is when let me just move my cursor across here I lost my cursor there we go so you can see let's just take this case we poked above the
top line so so we could use that as an entry we stay in until we poke below the um the low line there uh and then we're out and again you know almost straight back in and doing it all over again it's it's nice system again you know I'm showing you a good example here there's plenty of examples where it doesn't work but it is a lot better than a moving average crossover uh and so uh definitely something worth uh having a look at um a couple other ones Kelner channels and star bands they're all
working on the same concept Kelner channels he does his own variation of average true range um looking at the averages of the bars to each other um it's very similar to average true Range St bands and Kon channels all work the same way it's the same Principle as Ballinger Central Moving average a measure of volatility above and beneath that Central Moving average to create the bands um and so you know they they're good to know um trading with bands another you know this is now back in the Kur Patrick book the um trading strategy that
they're talking about there is this idea of again this is that same chart but you can see that there's a lot more trades and a lot more chop going on here they're basically saying um buy on a breakout of the top line but then sell when the central line treat the central line as a stop and so when the market comes back to the central line then that's it get out of the trade uh at that point um you can see there's a lot more trades there um but uh whether that's better or not that's
where you need to do a little bit of testing and and back testing and see what you uh you think about that um but that's the the kirpatrick way so if there's any questions about you know as per kir Patrick's way of trading with bands um you know that's the one that you need to remember um for that as well all right um um bandwidth indicator this is a nice one this one down the bottom of the chart basically what it's doing is it's measuring the the distance between the upper band and the lower band
I mean essentially you could even say that it's just four um times the standard deviation um but what you've got then is a really nice way of identifying peaks in volatility and so you can look at that and you can see oh wow we've got huge volatility going on here and then it's it goes away and we're back to a a normal Market depending on your strategy volatility may be good volatility may be bad um but these are things that um uh you can identify with these indicators um donin Channel we talked about that um
before um it's more of a channel tool than a band Tool but it still has very many of the same Concepts and so we're looking for breakouts on the upper side um and then breakouts on the lower side as well it's just going back four weeks go say let's go back four weeks High what's the highest high over the last four weeks if I'm higher than that the assumption is that oh we must be in some sort of breakout condition let's go and and trade that now you can see in this chart here that first
breakout right at the top of the chart well that one didn't work out um but subsequent ones um may have depending on how long you held the trade so um but many of these indicators so you know again I'm just sort of looking at that and saying let me let me bring the cursor across so if we take this first breakout on the downside if we were doing short trading uh well that would have been a great signal to take you know I've sort of stayed in um with the market depending on what my exit
rules were again this may be a little more appropriate to um uh with the central line but so much of this just needs testing you need to be able to test these uh and work with that um but as I said you know breakouts from these can be um used typically these type of things are stop and reverse systems um by that we mean that as soon as you get the signal to exit your long trade you are immediately taking a short trade uh and um vice versa all right so that is our section on
moving averages let me just jump over to our last slide here um really the important things are you need to know how moving averages help you identify Trends so we talked about that um that when you are looking at u a moving average if the moving average is going up we're in an uptrend or if the closes above the moving average we're in an uptrend so there's a couple of different ways that we can um uh look at that we obviously talked about the different types of uh moving averages and how they're all calculated you
need to know uh about that cmt1 you just need to know simple and exponential and geometric um but you know for cmt2 you need to know them all it's very important I think just to have a really good understanding of what those calculations are and and how they're uh they're worked um we need to uh understand the directional um the adx the directional movement you need to understand that um adx trading rules make sure you do understand um all of that as well you know and that best signal being when the adx is crossing up
above the first line um the other part is that you know we don't take a trend-based trade when the adx is pointing down uh make sure that you uh remember that also when you apply uh envelopes versus bands versus channels you know the difference between envelopes and bands are very very close but what I would say is that you would typically use envelopes where there's not much difference in volatility it's a very consistent some Commodities are more like this where there's just a consistent seasonal pattern and a it's um you know bands work very well
bands are also fantastic for filters around a moving average you know that's the other way uh of using them where you can use that as that filter to reduce whips saw and I think that's probably a key point to remember bands help you with um reduce whipsaw uh when it comes to um sorry envelopes my apologies I keep getting bands and envelopes reversed um envelopes help you reduce whipsaw bands of more for trying to Encompass the the range of data and looking for breakouts of those um those bands there so couple of things there uh
again thank you so much that's moving average sections um and we'll see you next time with the next session thank you

![Azure Data Factory Beginner to Pro Tutorial [Full Course]](https://img.youtube.com/vi/DLmlFlQGQWo/maxresdefault.jpg)


![Power Automate Beginner to Pro Tutorial [Full Course]](https://img.youtube.com/vi/1p5kI7SYz4Q/maxresdefault.jpg)

![Beginner to T-SQL [Full Course]](https://img.youtube.com/vi/cACat4KNncg/maxresdefault.jpg)