we're going to be looking at the breaker okay and what we're looking at is how we can use this form of mitigation to highlight a trade setup we're going to assume that we're watching price and it trades lower and creates a short-term low eventually when that short term low is violated and trades down into a support level we view that initial drop down below the previous low as a potential false break or turtle soup long below short-term lows there's going to be sell stops and our expectation is we want to see if the market wants
to get back above that short-term low initially it may come up and flirt with that same old low and give an indication it may want to view that as a resistance price point we're more inclined to wait to see if it wants to show a real significant price move higher eventually when we see that here this is going to be in the form of a market structure shift it takes out the high or the short-term high that high is what we focus on wait for price to come back down into that old high when it
trades there we view that as real support because there's going to be orders inside that high that will be looking to be mitigated in other words those individuals that were short at that high they're going to want to take those positions off and maybe get in sync with a new leg higher in price as price moves away that confirms the breaker and then we wait for higher objectives to be met in price action again focusing on the high in between the two lower lows one low has to be traded below and it's going to run
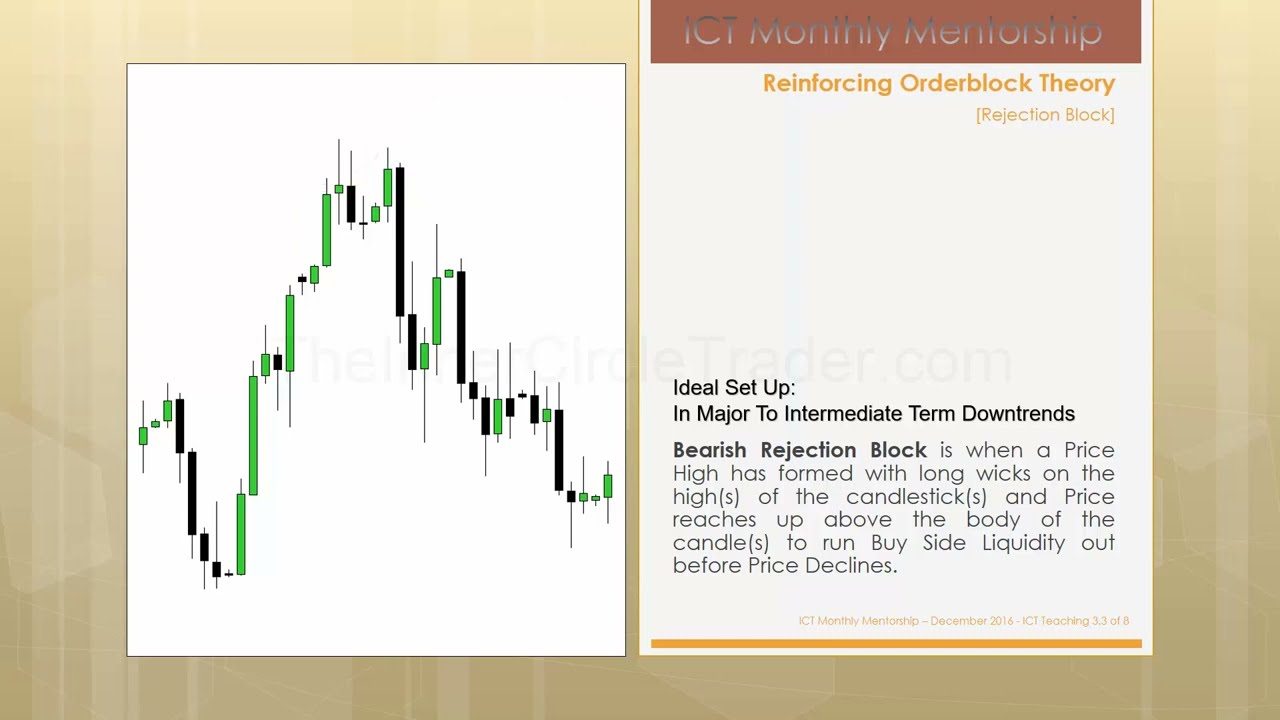
out to sell stops we focus our attention on the short term high that's in between the two lows we use that as a resistance level that's broken that will become support making it a bullish breaker contrarily we can look at the market in this way when the market trades higher and takes out an old high and then breaks below the low that makes that new high our focus is there and we view that as a bearish breaker okay so take a look at a closer look at a bearish breaker okay a bearish breaker is a
bearish range or down close candle in the most recent swing low prior to an old high being violated the buyers that buy this low and later see this same swing low violated will look to mitigate the loss when price returns back to the swing low this is a bearish trade setup worth considering so we have an old high here that's traded through and rejected it runs the stops above the old high those buy stops are now neutralized and we focus our attention on the swing low that formed between the two highs we see a market
structure break retrains back to the swing low that is the bearish breaker we look for another low to form with a new leg in price moving lower the salient points are what we're looking for is an old high to be ran out or a false break above an old high this rate on buy stops indicate buyers are trapped long we know this is true when the market quickly does a repricing that's seen here repricing lower after buy stops are taken that is a confirmation that we are potentially seeing a new breaker forming the low gets
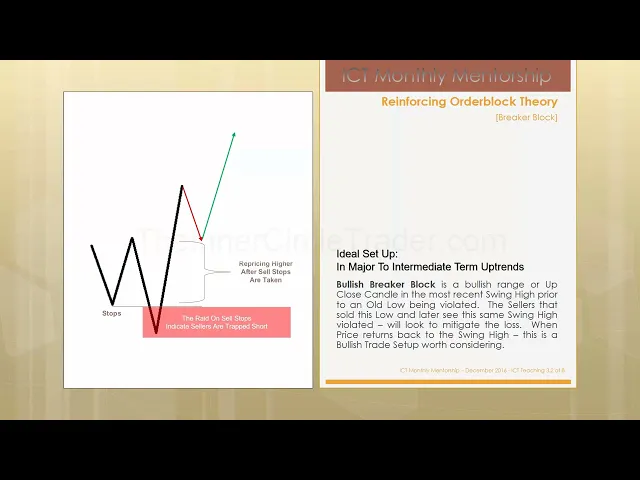
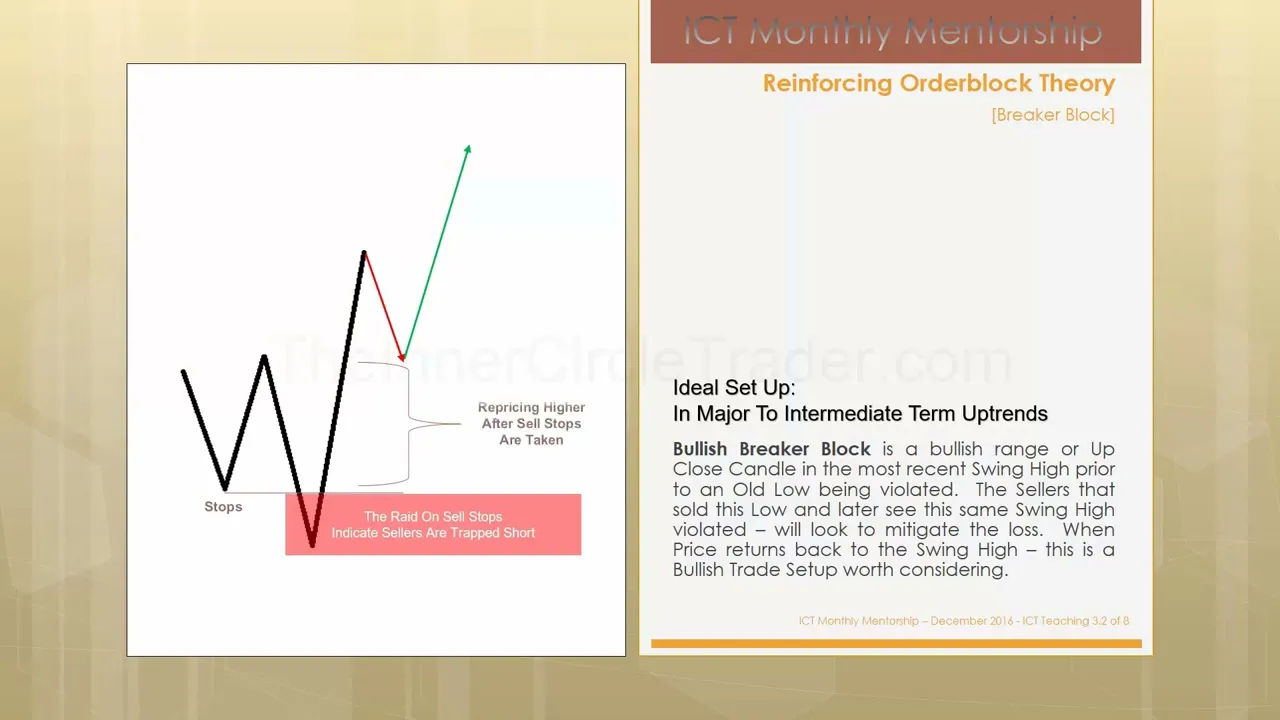
violated here once market structure is broken down and all future retracements will be viewed as new selling opportunities especially once it trades back up to the low here that gives us our bearish breaker okay for a bullish breaker it's a bullish range or up close candle in the most recent swing high prior to an old low being violated the sellers that sold this low and later see this same swing high violated will look to mitigate the loss when price returns back to the swing high this is a bullish trade setup worth considering again we have
an old low that's violated taking out cell stops below that old low our swing high is where we're going to be looking for our bullish breaker we have to wait for price to break through that swing high to confirm that there has been a run on stops and that that old swing high will house or inside that swing high will reside a bullish breaker as price trades back down to that swing high we would be buying that but the expectation that there is going to be a mitigation that's taking place those sell orders that they
use to drive prices down below the old low they would be underwater here or not making a profit so they're going to want to take those off and add more longs that's our bullish breaker and then we would expect to see and anticipate a range expansion to the upside to tell tell signs that you have a breaker in formation or confirmation the rate on sell stops indicates sellers are trapped below the old low [Music] the range expansion that takes out the short term high in between the two lows this repricing higher after cell stops are
taken as a confirmation that the market is in fact a run on stops below an old low and the old high that's violated that supports a market structure shift for bullishness this run here supports the market structure being broken higher and any retracements from this point on will be viewed as a new buying opportunity when it trades back into the old swing high here when we see that that's a bullish breaker so let's take a look at it in real price action okay we have an old low here the market trades down below that low
and punches through it again and it rallies up so what we're seeing here is that market structures shift after stops have been taken on the sell side so there's been a massive repricing so the market's going to want to look to reprice lower and retrace back down into what where's our focus point we find the short term high and the last up candle in between the two lows that most recently formed and taking out those cell stops that's seen here so right now this would be viewed as a bullish breaker we would anticipate saying the
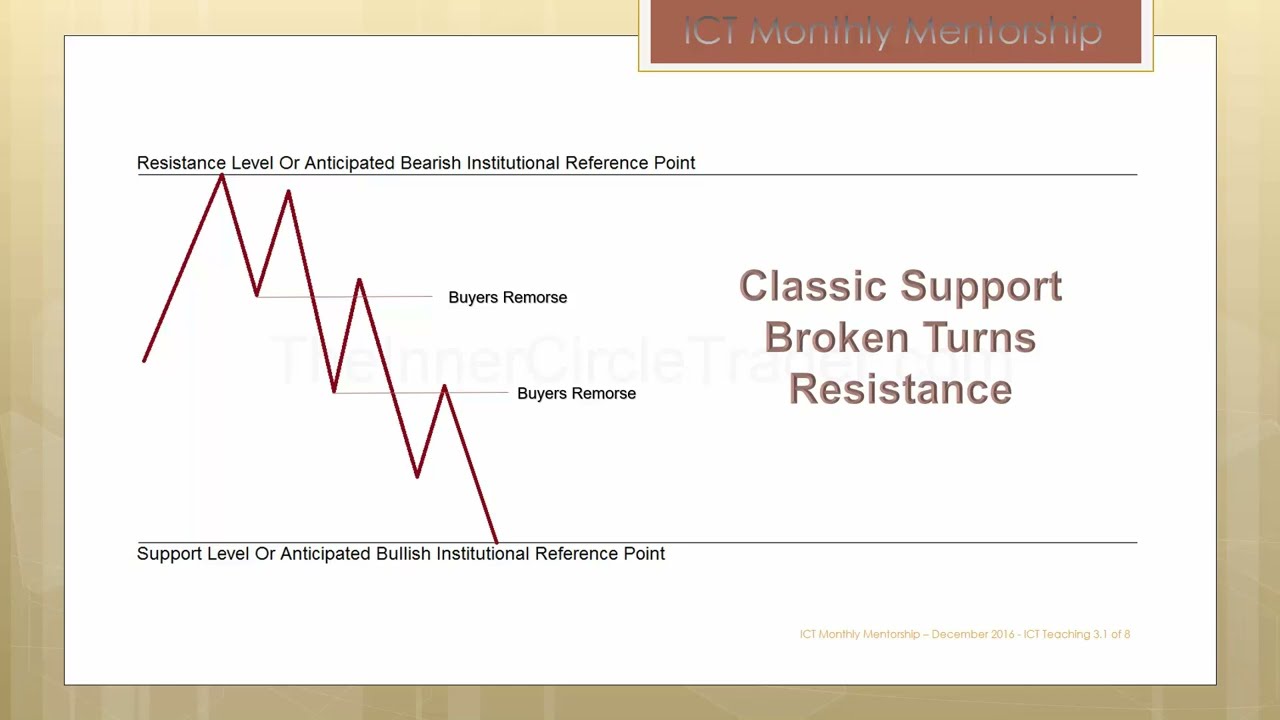
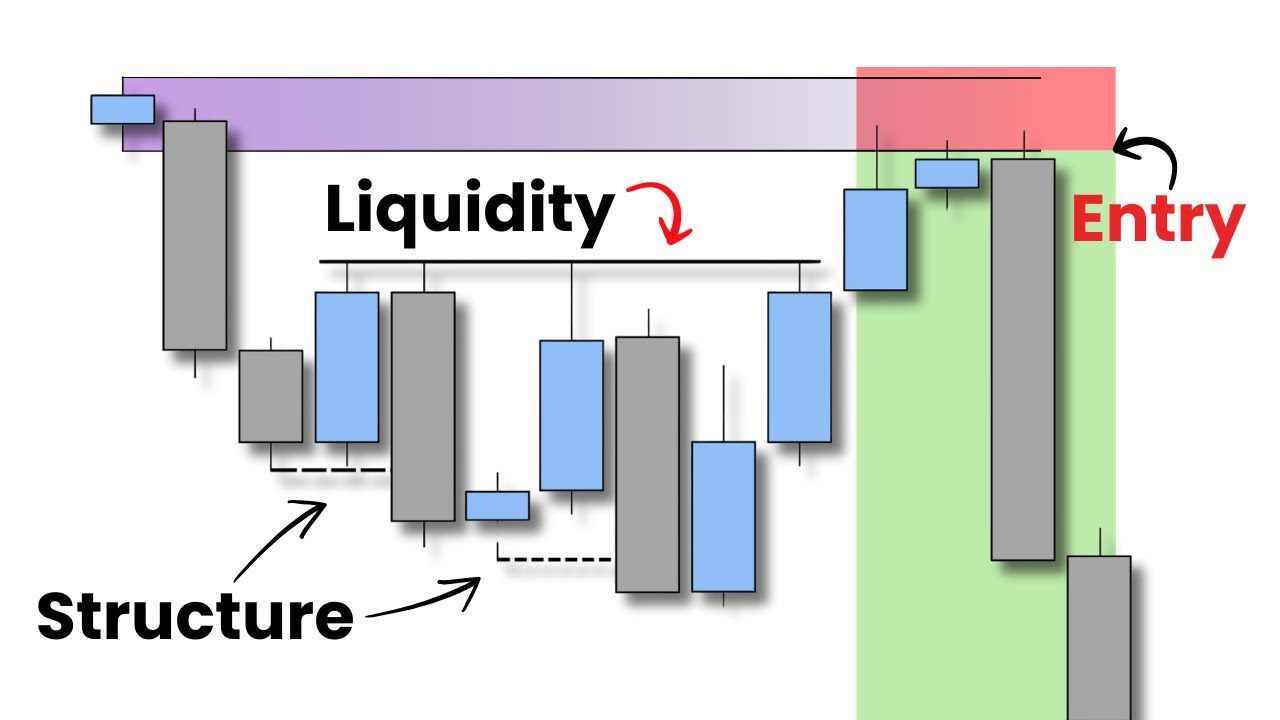
market to trade higher where those orders would be collapsed once retraded back down to with price any selling orders would be mitigated and new buying orders would be replacing them and there's the subsequent price actions you would anticipate seeing in your charts so study your charts look at examples where you see this formation where you have the market creating a low and then the market trades down lower one more time and runs through the short term high in between this is where classic support ideas are effective that you've probably done what i've done as a
new trader where we look for support resistance ideas by drawing a horizontal line and you think that you know it's that easy well you have to have a storyline behind why price is doing what it's doing if you understand what the breaker is doing it's indicating that it's running a stop pull of liquidity out when you find the short-term load that's been violated find the short-term height that this recently formed when it trades back down to that that will be in fact a support level that is highly probable for bullish prices you see that here
it's trading inside the range that's created with this last up candle why am i using this one and not this one here because this one was the highest one prior to the drop down and we're using the entire range price trades down into it recapitalizes all the selling they sold here that drove prices down to take these sell stops out they're underwater or losing money here they have deeper pockets than us they'll wait for price to get back to an area where they can mitigate those shorts and add new longs and that's why you see
that explosive price action seen here so hopefully this has been more insight to breakers and we'll talk more about these as we go through the mentorship in futures months until next time wish good luck and good trading