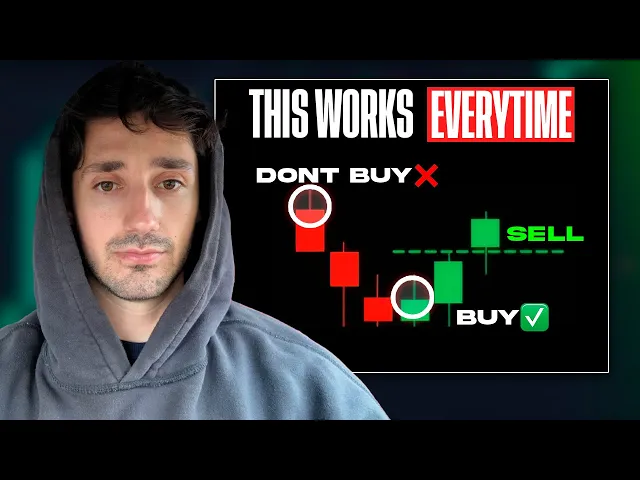
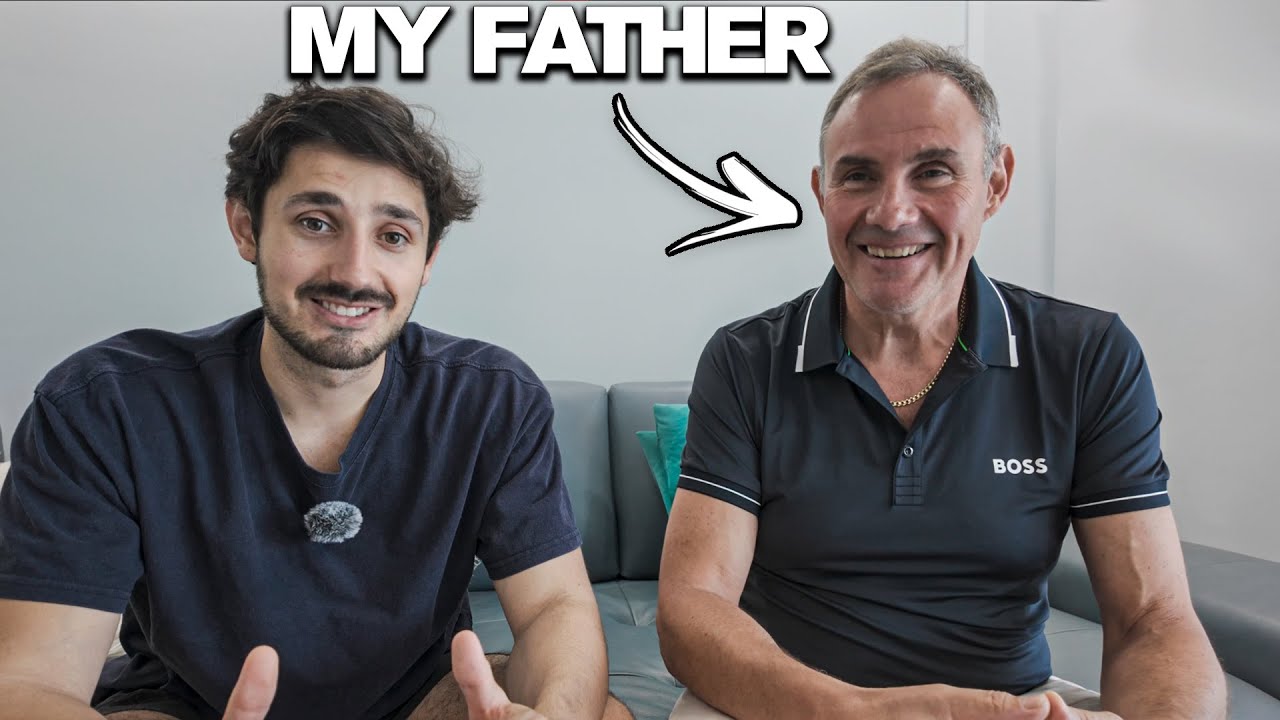
i'm going to teach you a simple trading strategy that I use to make $500 to $5,000 every single day trading in the stock market my name is Emanuel i'm a 7figure day trader and I've been using exactly what I'm about to show you over the past 5 years every single day and my father who was my mentor who taught me how to trade has been using this for close to a decade unlike a lot of the trading gurus out there I actually do this full-time i trade live every single day and this is what I do for a living i'm gonna hit you with so much value and practical trading concepts that you'll be able to implement literally as soon as this video ends that you'll question why I'm even doing this for free and to answer that question it is because I am genuinely trying to help you i want you to become a profitable trader my goal the reason I'm doing this is to lead the next generation of profitable traders let's not waste any more time and let's jump into me making you a better trader so these are my Charles Schwab statements and the reason I'm showing you them is to be as transparent as humanly possible if I'm going to be teaching you how to trade it's important for you to understand that I actually make money doing this and I like to be as transparent as possible i want to be as real as possible and I want to show you the actual proof that I do this for a living and that I do this every single day so in October I made $15,036 this was in 2024 and I was actually in Italy for half the month and that's why it ended up being a bit of a slower month november I made $77,571 and you could check the cash activity the beginning balance the change in mark value the ending balance and all that good stuff i also show you uh my withdrawals from the account but November was an excellent month for me december was another very good month i made $53,051 january really good start to the year I made $73,656 and in February which was 2 months ago I made $68,955 and if you're wondering where my March statement was which was you know last month well Schwab actually hasn't created my statement yet but I was hovering just around $30,000 in profit march was a bit of a slower month for me and so far in April it's been an excellent start to the month the market literally collapsed which actually creates a really profitable trading environment for me as a day trader and I'm up a little bit over $25,000 in the first four days of April most of my profits literally came from the last two days Thursday and Friday where I finished $8,000 in profit on Thursday and I made a little bit over 13,200 yesterday if you guys want to see my daily results every single day i post them on my Instagram story so follow up on my Instagram i also show you know a ton of trading education there and I give you guys kind of a reall life perspective on what I do every single day as a full-time trader so make sure you follow up it is mtrades it should be on the screen and send me a DM saying that you're coming from my YouTube channel and I'd love to potentially talk with you and even answer some of your questions i don't want to waste any time i want to give you as much information as possible in this 20 to 30 minute video so you could actually begin implementing and using this strategy as soon as tomorrow and the first step of this strategy is we're going to zoom out and look at the daily chart the daily time frame where every single one of these candlesticks represents 1 days worth of price action i always like to zoom out first look at the higher time frames when I'm analyzing a stock or if I'm looking for a potential setup and what we're going to be scanning for is for a very specific type of gap now what is a gap a gap is an overnight change in price so let's say a stock closed at $10 yesterday 400 p. m eastern when the stock market closes and the next morning at 9:00 Eastern time it opens at $20 that difference in price that occurred overnight where it changed from $10 to $20 the next day that change in price overnight is called a gap and the reason I like to trade gaps is because they prove to be a catalyst for that stock it increases the momentum for that stock because gaps usually occur for specific reasons it could occur because of news it could occur because of the market dropping or the market going up it could occur because of earnings where companies report quarterly earnings those earning reports can you know change prices overnight because investors you know they buy or sell based off those earnings uh earning reports or it could happen because of the CEO saying something like with Tesla elon Musk is always kind of you know tweeting and talking you know about things people may agree or disagree with that causes the price of Tesla to change overnight right it could be for all sorts of reasons but we don't really care why the gap happens what we care about is what effect does that gap have on the charts what effect does that gap have on price action in other words the relationship between the buyers and the sellers that's ultimately what price action is and based on how it's gapping on the chart that gives us information that gives us a bias it gives me direction on what I want to do for that day or how I want to trade that stock whether I want to go long or short or whether I'm going to be looking at it in the first place during the trading day so we are looking for a specific type of gap that we're about to get into but some examples of gaps just so you have an idea of what they look like is right here so this stock let me make this white so you can see it perfect so this stock closed at around 475 the previous day and then the next morning it opened at around like 410 something like that this literal gap is an overnight change in price all right this is what a gap looks like you'll literally see a space in the charts and this happens in the stock market because the stock market is not a 24-hour market gaps do not happen in 24-hour markets like crypto here's another really good example all right and we'll make this uh black so this stock closed at 550 the previous day and then the next day it opened at around 480 there is a gap on the chart all right and you could see how much that stock moved on the day of the gap this is why I like to trade gaps because gapping stocks have more momentum they move way more there's a catalyst whether it's a earnings report or some news in the company or the CEO saying uh saying some there's a catalyst for its movement and I want to trade stocks that have a catalyst because they actually could move and as a day trader I want to trade stuff that is moving okay and that's why I focus on gapping stocks here's another really good example all right where this stock closed at like 25 something the previous day the next day it opened at around like 29. 50 we saw a massive drop first and then it it this set up as a like a retracement opportunity and then we ended up continuing much higher all right and this is why I like to trade gaps because they actually move okay now we're going to simplify this and I'm going to give you a specific type of gap to look for in that we actually saw a during this past week when the market literally just like collapsed we saw a market crash and the I saw this gap on the daily chart of the market and we're going to be looking at it and analyzing it but this type of gap is called shock value it's a shock value gap now what is shock value this is a gap that shocks the buyers or the sellers a gap that surprises the buyers or the sellers so essentially let's say we get a green bar right this is where prices opened at that day right open and this is where prices at that day all right and then the next morning we end up gapping beneath the lows of this green bar we gap underneath this green part and we open here and that's really what we're looking at right because when uh it's the morning we don't know what the prices are going to do yet right so let's say it's opening right directly below a green bar this is what we're looking for and I'll explain why once we look at some examples on the chart but this is what shock value is you get a massive green bar they're stepping up to the plate sending prices higher we close up here and then all of a sudden the next morning we open below that green bar and you can kind of already see how this creates shock because we're surprising all of the buyers who bought it the previous day and you'll see quite you know how powerful this is in just a moment but the same thing applies uh the opposite way where let's say we have a red bar and we opened up here right then at the end of the day we closed here where the sellers brought prices lower and then all of a sudden the next day the next uh trading day when the stock market opens we end up opening right here all of the sellers or who shorted it the previous day are now underwater right they're now they're seeing prices open up above this red bar and this gap literally this overnight change in price creates once again shock it creates a surprise for the sellers so we're looking for a gap that either surprises the buyers by gapping down or surprises the sellers by gapping up and these can be such powerful opportunities i I cannot even explain how powerful this gap can be and how it can create just a plus opportunities to make money it is absurd and sometimes it's simple right when you get a super powerful shock value type of gap you can almost go short go long close your eyes and you'll be able to make money it is really it could really be that simple and that easy to make money with this strategy and of course you know there's no easy money in trading obviously but so we're about to look at an example of this all right so let's go to the daily chart of the market and I want to show you guys something that we saw this past week so we saw a perfect example of a shock value gap literally this past Thursday in the stock market on the stock market crash and I'm going to explain exactly what a powerful gap so we're going to be looking at this right here so the market started to drop and then we had a nice gap down to around 461 by the way we're looking at the Q's the NASDAQ so this is the tracking ETF for the NASDAQ so we gapped the 461 and we ended up getting bought we had three green bars in a row we had a ton of buyers that came in and that said "Hey this is probably the market bottom i'm going to bet money this is the market bottom and I'm going to begin buying.
" And that's what they did we got one two three green bars in a row on the market and then what happened on Thursday all of a sudden we gap from what is this 476 and we open at 456 and we have this overnight change in price right here it's a little bit sloppy seeing that we closed 55 and then the next day we opened at 450 okay this overnight change in price was unbelievably powerful because we it literally trapped every single buyer that bought it the past 3 days everyone who went long here is now waking up to their position underwater in other words losing money in their position and they are down right and this adds a lot of selling pressure because if you're waking up and you're seeing that your position is down significantly whether it's on the market or in you know individual stocks you're going to start to like freak out think about it if you're waking up and your your thing is you know down your position is down let's say i mean in the market 4% is significant but let's say you're down you know 10% on your stock 20% on your stock since that's going to put pressure on you to cut your losses and sell and then let's say this stock begins to drop right as it did with the market it kind of popped at the uh the market drop began to drop began to drop that's going to put even more pressure on you to begin selling because all of a sudden you're waking up and you're down let's say 10K and then all of a sudden it starts to drop now you're down 12K now you're down 40 you're seeing your losses increase that get that puts additional pressure on those buyers to cut their losses and sell their position all right and that's exactly what happened where we ended up kind of moving higher a little bit we started to drop and then literally the next day which was yesterday we gapped down up from 450 to 437 and then yesterday we had a massive red bar of selling and part of the reason this happened is because we trapped so many buyers on this move up with this gap down and you know I saw this gap gapping below three green bars on the daily chart on Thursday we're going to we're going to go lower i literally made a Tik Tok video saying this is an extremely bearish gap maybe one of the most bearish gaps on the market I've ever seen and we're going to go lower like this this is not the bottom we are not going to get bought here we are going much much lower because when you trap this many buyers especially on something like the cues on the market three green bars in a row you gap down below them you're trapping a lot of people it puts so much selling pressure on top of the fact that we already dropped like 12% we are we're already in kind of like a bearish sentiment right with all these tariffs and with everyone panicking over the economy you know this gap just kind of poured fuel onto the fire and we got sold off extremely hard after that all right and this is why this gap is so powerful because it traps the sellers and it creates this like snowball effect of selling right and that's what happened here literally snowballed and we got sold all the way to 4 days because of this gap we dropped which on the cues on a you know market ETF that is tremendous right that is tremendous maybe on an individual stock that's not like the end of the world but like on the market that's massive right we're down literally over 21% from the highs insane stuff insane stuff and it it all happened literally because of this gap and I recognized this and on you know these past two days with this you know extremely bearish gap and I was able to go short and I made you know a little bit over 22,000 in two days,000 friday I made um a little bit over 13,000 all right now this is on the market let's look at some examples of this on individual stocks that I actually traded the past few days one of them that I thought was really just amazing was the Under Armour the UAA so let's understand what happened here we moved up this was I think Monday Tuesday Wednesday we closed at like 660 on Wednesday and then all of a sudden the next day we we opened at around 596 so we gapped we opened below these three green bars everyone who bought it these past 3 days is now trapped right because it's opening below their entries they're all losing money so everyone who thought this was the bottom they're now waking up to their position underwater and that just adds so much selling pressure to the stock and then the next day we had a hit we got hit with a massive red bar and this thing dropped 10% in a single day which is I mean still pretty significant in the stock market and I was able to capitalize off of this opportunity and I was able All right really really good example let's look at one more the WBD I mean this is just be look at this thing so a Monday Tuesday Wednesday so green bar red bar and then Wednesday another green bar and this is the green bar I'm really looking at we opened at 10:0654 So somewhere around here if you guys are seeing the numbers on the side all right and then on Thursday we gapped from 1056 to 10:03 we gapped literally perfectly below this green bar every single person who bought it on this day is now trapped underwater right they are shocked the buyers are surprised and this thing literally dropped from you know it opened at 10:03 right below this green bar and dropped from 10:03 and the next day it gapped down again and dropped all the way to 80 this one gap sparked literally move on WBD right so we could day trade this we can swing trade this but it was because of the gap right and essentially every stock gapped similar to the market right almost every stock ran up with the market on Wednesday and then the next day it gapped down underneath that buying and it trapped all of those buyers right think about it you're waking up where you're you're let's say you bought it at 10:06 on Wednesday in the morning now it's up to 1050 you're feeling good right may you're up a little bit right you're up you know four or five% on your position you're feeling kind of good maybe you caught the bottom on Under Armour maybe it's going to start an uptrend and continue higher and then all of a sudden the next day not only does it negate all of your profits but now you're down and then it starts to drop from 10:02 to 980 that's going to add so much pressure on you to sell i mean think about it what would you do and fall the market's falling as well it's just going to add pressure on you to sell and it creates a snowball effect of selling and that's why these gaps are so powerful because they trap they surprise they shock the buyers or the sellers now let's look at another example of when a gap surprises uh the sellers so let me go ahead and find it so we are looking at Roku and this was months ago i think this was literally in like 2023 or 2024 but Roku had a massive red bar on this day massive it literally um g or started moving from 7330 and it closed at 68 bucks right so we had a big red bar dropped like literally 8% that day and I'll tell you the next day this thing opened directly above that red bar what do you think happened right we literally gapped from $68 from the lows of this red bar we opened above this red bar and what do you think happened and I will show you i'm going to unpause it and look at that so we opened at literally 75 the next day and then we got a massive green bar to the upside we literally moved 20% in a single freaking day why did we move 20% because we moved lower the sellers came in they What happened the next day the buyers stepped up you know we opened above this red bar we trapped every single seller every single person who sold or who went short right all of the someone sold this day then they're seeing it open up at the next day right and then they feel FOMO they feel like "Oh my god I sold too early you know I I I missed the uh you know I didn't sell at the right price maybe this thing is going to go back in. " And it creates this now snowball effect of buying where all of the people who went short are trapped and maybe the people who sold are now feeling FOMO and we saw just a massive green bar that day and then we continued higher the next two days we got a 30% move higher in the stock in 3 days because of this gap because we trapped the sellers uh who sold or went short in this red uh in this red bar by gapping up over it the next day right let's go back to what we're looking at right we look for a red bar or um a gap beneath a green bar right or we're looking for a gap up above a red bar and that's exactly what we got here we got a gap up above a red bar trapped everyone here and then same thing with the other examples that we looked at um let me exit this bar replay and the same thing here we trapped all the buyers by gapping down at green bar you guys get the idea now what is the next step in this process let's get right into it okay so the next step in this process is actually extremely simple so what did we just do by looking at the daily gap and identifying a shock value type of gap or you can call it maybe a surprise gap whatever you want to call it right we identified the shock value gap that and and we did this on the daily time frame so the 1day time frame okay this gives us the bias of what we want to do for that day so before the market opens before them eastern hits that's when the market opens we look at where prices are opening we look for gaps right so on this day right on UAA in the morning I saw that we were opening at 595 the previous day I saw that we closed at 660 right so I knew that hey we're opening below three green bars we're five below three green bars this is a shock value gap this is an interesting gap because we're trapping all of the buyers from the previous day i'm going to watch it and I'm going to watch it as a short and the same thing that I just showed you with the Roku where we gapped up over that red bar well before the market opened that day I saw that we were gapping and opening above that red bar so that gave me the bias that that stock is likely going to continue higher for that day the gap gives me the bias before the market opens and then once the market opens this is what I do and what I do is I go to the smaller time frames i go to the one right i go to the two-minut chart this is specifically when the market just opens like in the first let's say 15 to 20 minutes of the day then I go to the five minute chart then I go to the 15 i look at the smaller time frames and what do I do i find a setup okay I find a trading setup that I trade now I don't want to make this like a two-hour long video talking about all of the setups that I trade the exact qualities that I look for in them and I I much rather you just watch my free 10 plus hour course okay it will teach you in depth what setups I trade exactly what I look for in them the exact qualities that separate a high quality setup from a low quality setup just everything you need to know that's in my free Templar course so you could find that in the description of the video and it'll just teach you all of this setup it'll teach you it'll also teach you which time frames to look at and it'll go super in-depth with this um so you could just watch that all right so that's in the description of this video make sure you watch that all right next but I'll give you a quick little rundown the two setups that I essentially trade are breakouts or breakdowns move up we uh we base then we have a breakout and I'll I'll look to go long or the opposite it goes it moves down then it bases at the lows and then I'll look to go short or it could be even a potential retracement setup where we move up we retrace we get a buy setup and we move higher or we move down we retrace we get a sell setup and we move lower as a short these are the only two strategies I essentially trade they're so freaking simple and that's what really allows me to make money with my trading is that I keep it like stupid simple right i trade breakouts i trade continuation trades right which essentially is we move up base continue higher move down base continue lower or we move up we correct in price continue higher move down correct in price continue lower i trade continuation setups i also do trade reversals but for this example and for shock value we're mostly trading the continuation of the gap where it gapped up we're looking to go long or it gap down we're looking to go short breakouts and breakdowns and retracements really really simple and like I said um if you want to you know learn this super in-depth I would just watch my uh free course it's in the description of this video just watch that but that's what I do and then I find a setup and then I capitalize right so let's go back to those trades right let's let's go back to on on this day on the day of the gap let's see what setups we got right so I would go So let's say it opens 9:30 a.