hey guys welcome back to another episode in this video we will be going through our very simple yet profitable relative vigor index trading strategies if you want more videos more often please smash the like button subscribe and turn on the notifications bell and share this video across your whatsapp facebook accounts or twitter to show your support the very important point before we start everything we discuss in this video can be used for currency trading stock trading and crypto because price action stays relatively consistent across different assets so we're going to go very in-depth in this
video top 5 most popular rvi trading strategy in this video we will discuss the relative vigor index or rvi indicator it helps to find the dynamics of the price change of a financial instrument on a certain period what does the rvi show the rvi was presented to the trader community in 2002 by a famous developer of technical indicators and automatic trading strategies john ellers the indicator compares the closing and opening prices and helps to define who are dominating the market the bears are bulls the rvi belongs to the group of oscillators the calculation formula of
the indicator is based on the idea that on the bullish market closing prices are higher than opening prices and vice versa on the bearish market closing prices are lower than opening ones thus the vigor of the movement is estimated by the size of the price change on a certain period as with other oscillators when the rdi lines rise above zero and reach their highs the market is overbought conversely when both lines decline below zero and reach their local lows the market is oversold and a reversal or correction may follow the rvi is represented in a
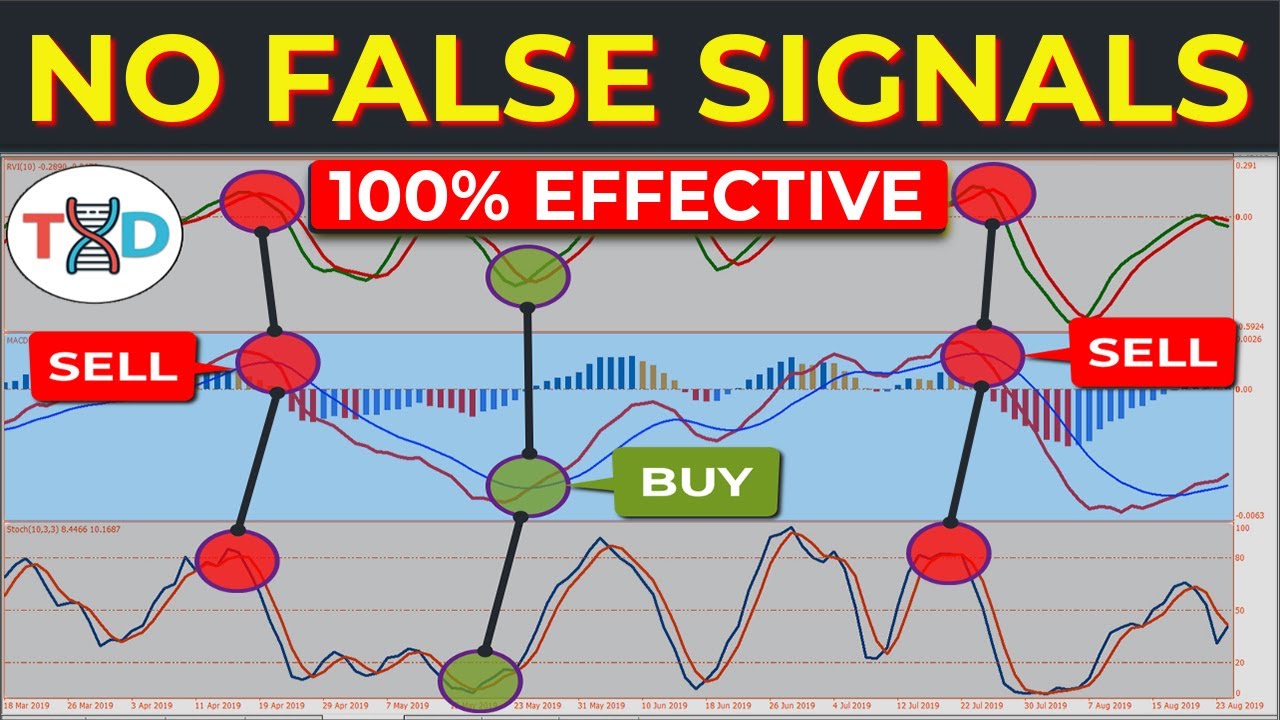
separate window under the price chart and consists of two lines the rvi line and the signal line the rvi line is quicker while the signal line reacts to price changes a bit slower crossing of these two lines gives trading signals of the rvi trading signals of the rvi let us discuss three main trading signals given by the rvi first crossing of the indicator lines this signal forms after the rvi forms local highs and lows in the overbought or above zero and oversold or below zero areas the signal to cell emerges when the quick or green
rvi line crosses the slope or red signal line from above in the overbought area after the reversal is confirmed on the price chart open a selling position with the stop loss behind the local high the signal to buy emerges when the quick or green rvi line crosses the slow or red signal line from below in the oversold area after a local low appears when the price chart confirms the reversal open a buying position with the stop loss behind the last low second crossing the central level the central axis of the indicator is zero crossing it
by both lines from below signals to by while crossing it from above signals to cell this signal is not very reliable so it is recommended to use it alongside additional instruments or other indicators technical analysis signals or price action patterns third the divergence of the rvi and price chart the bullish divergence appears when the price chart forms another low under the previous one while the rvi low formed by the crossing of the two indicator lines is higher than the previous one this means the sellers are weak so a reversal upwards may follow after the price
chart reverses upwards you may open a buying position with the stop loss slightly lower than the last low the bearish divergence emerges when the price chart shows another high above the previous one while the rvi high formed by the crossing of the two indicator lines is lower than the previous one this means the buyers are losing their strength so a reversal downwards may follow after the price chart starts going down you may open a selling position with the stop loss behind the local high here are other examples of rvi divergence trading strategy [Music] so [Music]
so [Music] [Music] like every other indicator the rvi can produce false signals therefore i strongly suggest you combine the relative vigor index with additional trading tools to identify head fakes due to the risk of false signals we will now cover five trading strategies using the rvi and now here are five trading strategies using the rvi trading indicator first relative vigor index in the stochastic oscillator here is a four hour chart of british pounds united states dollar the two green circles indicate when the rvi and the stochastic start registering an oversold condition therefore we go along
the moment the green line of the relative vigor index tool breaks the red line signaling a new bullish trend here are other examples of relative vigor index and the stochastic oscillator trading strategy [Music] so [Music] so [Music] so [Music] second relative vigor index in the relative strength index trading strategy in the first setup we hope to take a long position once the rsi registers an oversold condition and the rvi has a bullish cross lastly in the second setup we are on the short side of the trade the rsi is in overbought territory and after several
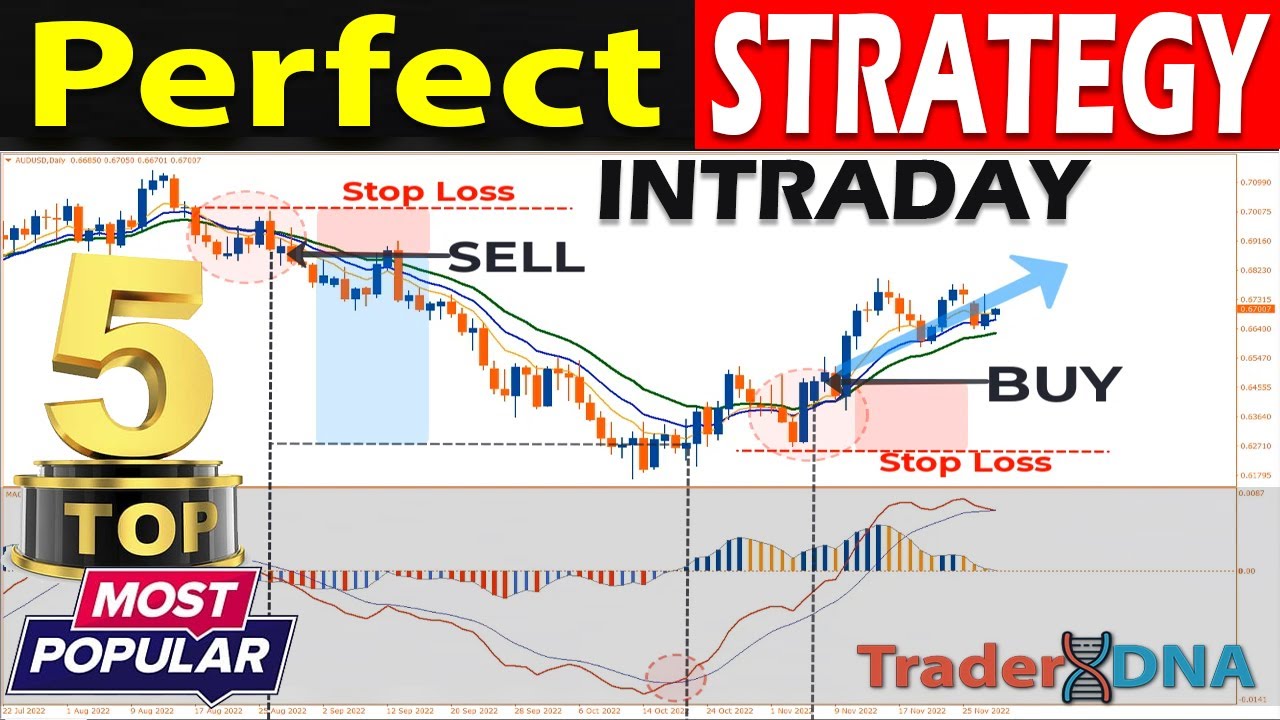
periods the rvi begins to display an overbought reading as well once the rvi cross to the downside we open a short position here are other examples of relative bigger index and the relative strength index trading strategy [Music] so [Music] so [Music] so [Music] third relative vigor index and two moving averages trading strategy in our case we will combine the rvi with the 50 period and 200 period sma you can use any time frame but consider that amount of noise on lower time frames consider using 15 minute charts and above so we are going to use
only two trading indicators first rvi or relative vigor index with the setting of 10 which is the standard setting of rvi indicator second two simple moving averages set at 50 and 200 we use a fast and slow moving average so we can see the potential trend change earlier do not add any other technical indicators to the mix for this strategy the only addition will be the use of candlestick price action patterns of individual candlesticks here are other examples of rvi and moving averages trading strategy [Music] so [Music] so [Music] so [Music] so [Music] fourth relative
vigor index and the moving average convergence divergence trading strategy similar to the previous strategies we wait for both the rvi and macd to confirm a trade before opening a position [Music] so [Music] so [Music] fifth relative vigor index and bollinger bands trading strategy finally we are going to expose another trading strategy which consists of combining the relative vigor indicator with bollinger bands as you probably know the bollinger bands indicator consists of a 20 period sma by default and two bands upper and lower so here are the rules for entering a short position using bollinger bands
indicator the recommended time frame for this strategy is the daily chart first an uptrend must be clearly present on the price chart second the price bar must be closed outside the upper bollinger band line third the signal to sell emerges when the quick or green rvi line crosses the slow or red signal line from above in the overbought area after the reversal is confirmed on the price chart open a selling position with the stop loss behind the local high here are the rules for entering a long position using rvi and bollinger band strategy first a
downtrend must be clearly present on the price chart second the price bar must be closed outside the lower ballinger band line third the signal to buy emerges when the quick or green rvi line crosses the slow or red signal line from below in the oversold area after the reversal is confirmed on the price chart open a buying position with the stop loss behind the local low here are other examples of relative vigor index and bollinger bands trading strategy [Music] so [Music] [Music] so [Music] [Applause] [Music] so [Music] do [Music] as always if you learned something
new or if you want more videos more often make sure you subscribe click the notification bell and share this video across your whatsapp facebook accounts or twitter to show your support see you next time [Music] you


![BEST MACD Trading Strategy [86% Win Rate]](https://img.youtube.com/vi/rf_EQvubKlk/maxresdefault.jpg)