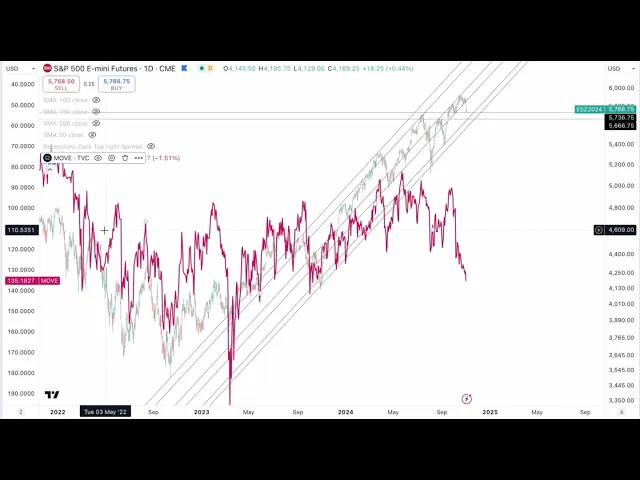
hello and welcome back to Bravo research this is your host Peter so we have quite a bit to cover in this episode the broad US Stock Market finally did correct from the all-time high we're now at a 3% correction so nothing crazy but definitely the market experiencing some volatility you can see the way that the S&P 500 traded around these price Channel levels with the market bouncing multiple times off of this price Channel support when it finally did break that's when a steep selloff began in the market we talked about that in the last couple
of episodes we've been highlighting over the last few weeks why our bias is more that the market will break down here in the short term rather than breaking out many reasons for this including just the simple fact that markets tend to be volatile heading into elections at the same time you have the bond market volatility is spiking here significantly again heading into the elections there's a lot of uncertainty that's going around we saw this mainly in the bond market was n yet reflected in the stock market and now we're finally starting to see some of
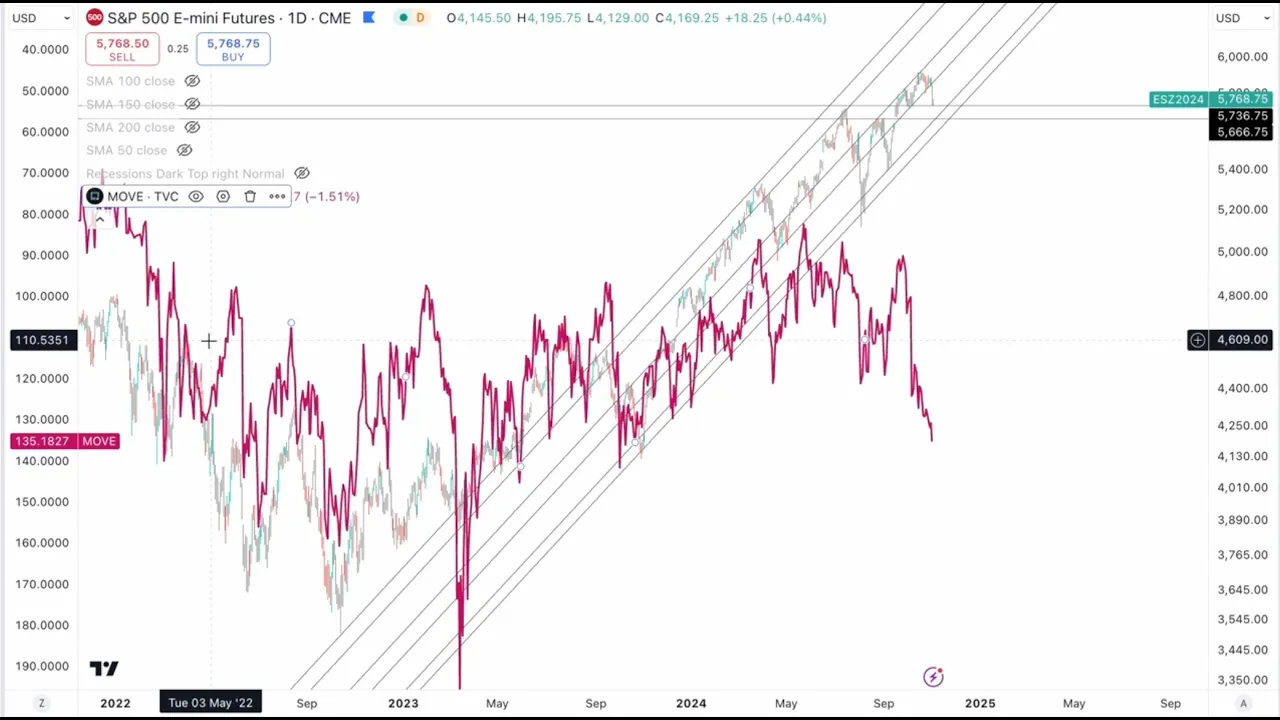
this uncertainty get reflected in the price of stocks just very quickly zooming out here and comparing the move index against the S&P 500 that bond market volatility index when we flip it around this is a chart we've been showing a few times over the last few weeks or so high correlation between what the stock market does and what bond market volatility is doing when you have a high level of UN certainty in the bond market in interest rate which is what this indicator reflects right a higher bond market volatility reflects more uncertainty because it means
options Traders are making larger bets whether that's up or down on the bond market and that uncertainty around interest rates is not a good thing for stocks it's not a good thing for valuations and typically when you have this type of spike in volatility in the bond market you see correction in stocks and so that's what we're seeing right now you can see up until very recently the market was trending higher with the move index going in the very opposite direction so you know it all looks very obvious in hindsight but making these types of
short-term bets on the market can be difficult especially when the market is being so strong and seems to be Defying Gravity now the question is what's next obviously the US election day is going to be pivotal as I mentioned both stocks and bonds see increased volatility heading into that event you can see the move index hasn't cooled down yet so there's not yet a bit big underlying sign that the market is ready to bottom out yet and reverse higher and that again that makes sense we have a couple of trading sessions left before the actual
election day a lot of things could happen between now and then you can see just yesterday was 2% mve down on the S&P 500 now let's zoom in a little bit and take a look at the technicals here Market is bouncing off of this support level right here pretty well defined as you can see there's a few key reactions from September and beginning of October right here Market was oversold heading into that support so a little bit of a bounce here makes sense I do think that the reversal point for the market is going to
be one of these price Channel support levels the S&P 500 right now is kind of trading in no man's land you just saw a break down below key support and I think you would need to see a test of bottom of the price channel in order for demand to really step in in a big way and push the market higher so that's where we are right now could be the market reverses immedi Med you know that's the very first thing you need to know about markets they can do anything at all times the only certainty
you have in the market is uncertainty it's all about odds it's all about probabilities and so with each decision that we make in regards to our trades in regards our allocation we have to be absolutely comfortable with this idea that there's a chance that we're wrong there's a chance that we're not making the right decision but at the same time trust that if we're putting the odds in our favor every time we make a decision over the medium to long term will come out on top so we'll see how durable this bounce is given the
bond market uncertainty that's still quite elevated and elections that are coming up on Tuesday a test of these levels of support would be a golden opportunity to get back into some more aggressive trades especially the ones that have been beaten up recently and so that's what I want to cover next is what's been selling off here has mainly been Tech so you take a look at Nvidia here that sold off a little bit after briefly making a new all-time high we have an 8% correction on Nvidia now doesn't look much on this Tru especially zooming
out just a little bit more it really doesn't look very dangerous but this did contribute to the volatility that we're seeing in the market we had Microsoft earnings that came out that also pulled the market down likely pretty violently and then you also have apple that sold off quite aggressively here so these three stocks selling off at the same time is a pretty big deal when it comes to the S&P 500 I think together those three stocks make up about 15 to 20% of the S&P 500 as a whole so Apple here more substantial breakdown
to what we're seeing on Nvidia for example this was a key trade that we had from back here we had initiated a trade on Apple on the 18th of September at around $218 that we rode very nicely to almost make a new alltime high we closed out the position on Apple when we started to EXP a correction in in stocks and so far that's been a good call so that's a really great example of how being able to anticipate a move in the broad Market can help you make a better decision in regards to your
allocation if you're expecting a broad Market correction a stock like apple is going to be vulnerable to that and we're seeing that clearly now again it can be that Apple moves higher even if the market is moving down and for example you see what's happening on Amazon following the earnings report Amazon looks great if they bounced off of this price Channel support let me zoom out a little bit to show you very nice bullish structure on Amazon this is one trade that we had back here that we rode very briefly for a trade there that
we closed out when it it started to really look like Amazon was going to make a false breakout because this was a great setup you had Amazon breaking out above a multi-month consolidation and it looked like it could uh you know make a pretty substantial move up but that breakout failed no reason to be in Amazon following a false break out and indeed you had pretty violent moves following that and now we're finally starting to see Amazon come back this is a trade that we're potentially looking to add once we start to get a little
bit more optimistic on stocks in general but you can see following the earnings report Amazon broke out here bouncing off of this price Channel support this looks good so potential trade here on Amazon that we're looking at this is what Amazon's earnings per share look like by the way between 2023 and today they went from about $15 per share all the way to $55 per share so Amazon is becoming this cash monster with profit margins expanding from 3% all the way to 9% year so big improve in Amazon's fundamentals in a very short period of
time despite the stock being one of its cheapest levels 10 20 years so of course pees and even earnings and profit margins come secondary to technical setups but it gives you an idea of potentially the room for a run on Amazon and room for investors to get excited about this stock again it could definitely be that it becomes a Wall Street Favorite once more now overall our allocation was quite protected during this correction very uncorrelated to the rest of the market which was very deliberate because when we're expecting or we think there's a high risk
of a short-term correction we don't want to be holding stocks or indices or ETFs or even assets that are very correlated to the market so biotech not correlated Turkish stocks not correlated short on energy stocks anticorrelated we've got Healthcare stocks pal Alto networks is is a tech stock that we kept just because of a very strong price structure Shake Shack relatively uncorrelated other utility stocks shorts on Disney and Nike so all of these trades were very resilient to this recent correction in stocks with a couple of big exceptions that I want to cover in this
video as well silver being a big one and ethereum that we initiated very recently both of these trades took quite big hits so let's take a quick look at those silver is a trade that we initiated back here in August of 24 when we were looking for things to buy the dip on the volatility that we had seen on the s&p500 during August we weren't yet to go all in on big stock trades at the time but we thought Silver was very cheap as a result this Market correction as you can see the correlation between
silver and the stock market is is very very significant at least recently and so given the historical Spike of volatility that we had in August it was very likely to us that silver was bottoming out and so we initiated that trade in August performing very nicely we booked profits on Silver when we saw it um reject off of this price Channel resistance right here so and at the same time we were expecting a little bit of correction in stock so we took out a little bit of our position on Silver but as you can see
it's is there's a General very bullish structure on Silver that's very much intact so no reason to completely remove the position in fact following a a bottom on stock market if we start to get more optimistic in the short-term outlook on stocks we may even add back to Silver because our waiting now is just a one but as you can see we're close to support right now both price Channel and this horizontal support level right here so that's a pretty big support potential or reversal on Silver something to keep in mind is also this big
head and shoulder pattern that it broke out of very recently that it's retesting now so also a potential area for for silver to reverse lots of support here in this Zone it could be that this actually ends up being the the bottom for silver and that it disconnects from the market that's entirely possible as well but the the estimated Target of this head and shoulder pattern is a 22% move up from the break which potentially takes the silver up to $40 that would still be a significant move from current levels and this retest of the
head and shoulder pattern provides an objective long entry for Traders looking to play this pattern because you've got again you've got support under you and and so that means you got limited risk where you can cut your losses in the event that silver declines past this this these levels of support and you've got lots of potential reward that silver could run all the way up to to $40 now ethereum as well took a little bit of a hit during the recent Market correction right here we initiated the position here on ethereum the reason we did
that is because Bitcoin seems to be disconnecting a little bit from the overall stock market now let me show you what I'm talking about you can see right here we have a a nice beautiful breakout on on bitcoin above a multi-month consolidation period this is bullish for Bitcoin absolutely undeniably bullish and so when you look at the stock market yes Bitcoin corrected with the stock market here but overall between mid October we'll say right here and today the market is down 3% but Bitcoin is up there is a decorrelation that's taking place on bitcoin which
makes me a little bit more skeptical of relying too much on my view on on the S&P 500 short-term price action to dictate what I'm going to do with cryptocurrencies right our view of that made a lot of sense when we took out our position on bitcoin here because Bitcoin was perfectly correlated to stocks correlation is breaking down we have to take note of these things especially when that's combined with a significant shift in the the structure of Bitcoin we have to adapt to the changing data we have to adapt to the changing chart that's
the only way that we'll be able to make the best decisions in regards to our trading and so that's what's taking place right now on bitcoin a big shift it seems now if we see something like this taking place on bitcoin we'll we'll have to readapt that's called a false breakout and the odds of further downside increase substantially if that happens but Bitcoin being the ultimate driver of the entire crypto Market that starts to make us more interested in trades like ethereum as well because ethereum if you and watching and paying attention to our our
thesis around ethereum we just as a quick background on our view on ethereum we went long on ethereum right here as as it was testing support this is the ethereum to bitcoin ratio by the way so we had this huge test of support on ethereum to bitcoin here in January now although ethereum didn't outperform Bitcoin here it did perform quite well this was a a trade that that made us a 50% gain I almost I believe significant run up on ethereum during the crypto bll run from early 2024 then we started to see ethereum actually
break down below this this long-term support we flipped to being bearish on ethereum's Outlook relative to bitcoin and indeed so far it's been Relentless downside on ethereum to bitcoin but you can see now we're coming into some pretty big levels of support defined by this reaction here this reaction here these reactions here so I have very little doubt that we're going to get a some kind of a reaction here I think the odds of a of a some kind of a reaction is significant so we may be a little bit early this is the equivalent
of catching a falling knife meaning relatively risky trade which you you typically don't want to do when at an actual the price chart an actual stock if the price action is is very very bearish you don't want to try and catch that falling knife because managing your risk here is is very difficult because it's it's highly uncertain where up until where that price can go down but here we're not really doing that we're we're catching the falling knife on the ethereum to bitcoin ratio so basically saying ethereum is is undervalued relative to bitcoin Bitcoin just
broke out so Bitcoin coin is looking good and there's a significant chance of seeing ethereum maybe do a a catchup trade on on bitcoin which would really lead to a significant rally on bitcoin on ethereum if that happens I mean the just a retracement back to this level of support would be a 30% outperformance of ethereum to bitcoin without necessarily seeing this massive shift in in the technical structure on on this chart it would just be a small retracement off with ethereum to bitcoin bouncing off a very obvious support level so this is a triade
we like uh ethereum I think what we may leave it some more room that's something to keep in mind by the way if if you're paying attention to this and you're doubtful regarding the the risk management and and I do want to highlight that this is something that we may actually average down into if we see more weakness on ethereum because we we really like this trade the only thing that can really make us get stopped out on the ethereum trade would be to see a a big breakout on bitcoin as I just mentioned that
would that would really shift the outlook for for ethereum now over this weekend we'll be scanning setups to add given the Market's volatility and taking a look at more carefully how how we should be readapting our positioning following this correction and and coming out of the uh election day what are the key stocks assets that we should be exposed to today so maybe decreasing our defense expensiveness a little bit decreasing our allocation to utilities and and Healthcare and increasing our our allocation to some some tech trades that would be perhaps something that we um end
up doing over the course of the next week or so so in any case we'll be discussing that in more detail on Monday if you enjoyed this quick short update on the Market's price action and the key trades that we are looking at around that and the general overview of our location during this period of volatility make sure to let us know by clicking on that like button below gives us a lot of information regarding which analysis and research you guys like also if you have any questions feedback comments make sure to leave them in
the comment section down below we don't always answer all of your questions but we do read all of the comments and take everything into account so feedback is very much appreciated thank you and I hope you guys have a great day