foreign hello doers my name is Jose Ignacio and today we're going to be talking about efficiency not deficiency efficiency now in stealthy Woods manufacturing process there is a key element we shouldn't Overlook the overall equipment Effectiveness also known as o e e for my acronym lovers oee is the gold standard for measuring a company's manufacturing productivity why would we use this like inside of a small to medium Enterprise like ours well I'll tell you right now now the reason is simple oee can help us identify the percentage of truly productive manufacturing time across my work
centers Now by being able to identify productivity losses I can actually pinpoint areas for improvement thereby making operations more efficient and cost effective and we love our our savings a lot now oee can lead to a significant return on investment especially when we launch a new product after all ensuring existing equipment is used efficiently reduces the amount of money we spend to meet our production needs and our products are always hot you've seen our chairs now keeping an eye on the overall equipment Effectiveness is vital for unleashing a company's true potential so I always say
this because I get excited let's take a look at how we can take advantage of it inside of odoo so enough Chit Chat all right so first oee might seem difficult to understand and to compute but luckily Odo calculates and Records these values automatically not manually automatically so that the complicated steps are taken care of in the background while regular production operations continue like normal which is actually quite convenient though doers since not everyone is an expert in manufacturing unlike me I am actually an expert in manufacturing just kidding enough jokes let's go all right
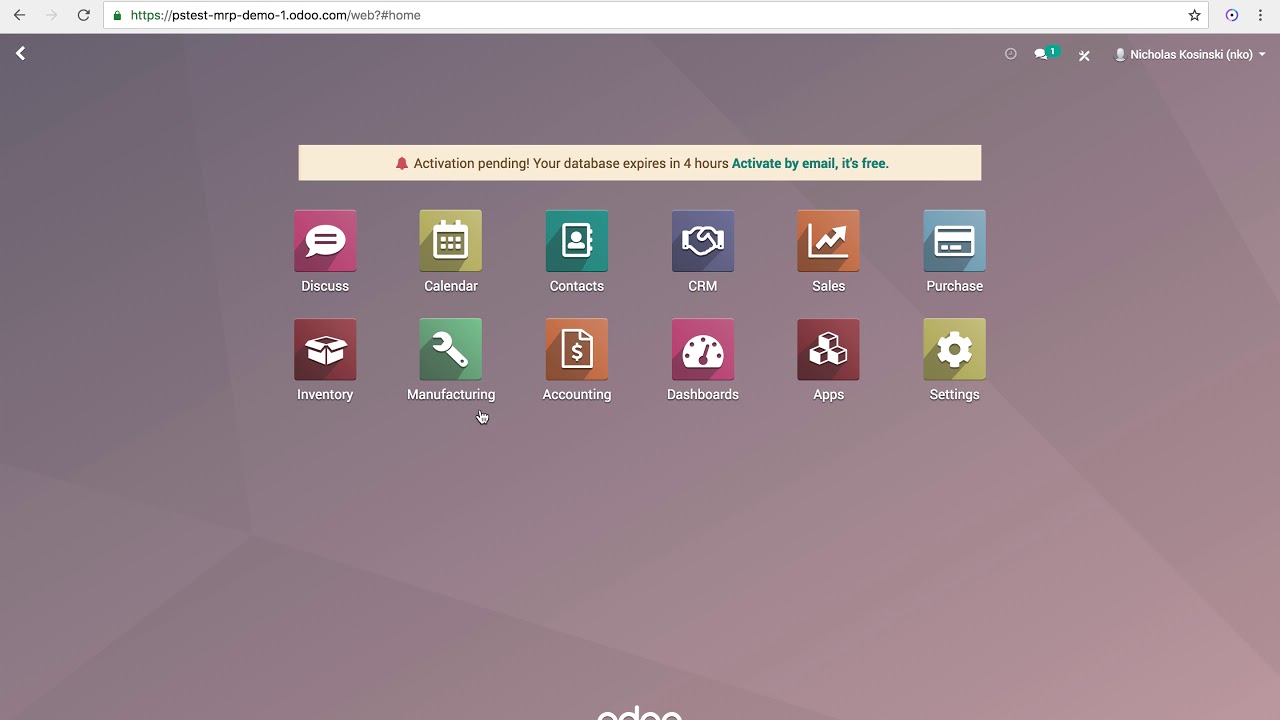
so we're gonna go straight into manufacturing over here and as you can see we have a dashboard overview of all of my work centers seeing a lot of colors right now and I'll explain them to you now as you can see oee is its own field over here with a percentage for each of my active work centers right now the oee percentage is in green which indicates that the work centers are meeting their targets if the oee drops below the target the number turns red but we don't see that right now so I want you
to see that so for example I can actually change the oee target for a work center to be greater than its current oee so in our case we're going to go to drill station and also you can see a few little other options over here we're gonna go into settings look at that Target 10 that is not how we work here we want a hundred percent if that's saved and this time using the breadcrumbs we're gonna go back over hero doers now when I view my dashboard again it's in red now and that's because my
team hasn't reached the oee target I set they are not at a hundred percent so I'm actually going to change it back over here to the original percent oops little doopsy there got a bit ahead of myself we're gonna go to settings I'm gonna change that back over here to 10 percent just give it a big old green and once that we're back over here now that it's over at this you know efficiency we'll notice that we don't anticipate it being at 100 efficiency now if the target is set to something that you think is
kind of insane like for your work center you will always have a red color right there so in our case when I click on the work centers oee button that we have right here and we go in here it gives us a nice overview it's production statistics and everything are now displayed now this helps me identify factors that are affecting the work Center's Effectiveness for example we can actually see that this work center which is called drill station one has been doing well with its fully productive time as you can see over here with the
blue almost at near a hundred percent now with just a small portion of this being taken up by material availability and that's kind of a very good thing now if I want to access an overall oee report for all of my work centers I can actually go up here to our magical reporting section and overall equipment effectiveness and just like that now to get a good overview of performance across my work centers I can actually Group by work center and loss reason as you can see up here using the group by functions make sure these
are checked off you can also add some other stuff such as custom groups users and that type of stuff but I shall leave them be now I also want to make a note that I can even remove some of these sections from view just by selecting something over here such as material availability and now you see you know with that excluded now this is a great method of visually gauging efficiency now to further understand how oee and how it's computed and how it works let's see how it changes when it takes longer than expected to
manufacture a product so I'm actually going to go back to my dashboard click on manufacturing or use the breadcrumbs which are just bread today now we're going to jump into a manufacturing work order over here for drill station and as you can see immediately this kind of looks a little bit different I'm actually going to quickly switch over to list View and I'm actually going to change the real duration right here on this wood panel from 60 to 200. just gonna make it kind of insane and you know what we're actually going back 300 like
the movie now we can show what happens to the oee when we go back you know over this time so I'm going to start my work order from the tablet view because I've been showing this off so right now we have what the will the wood panel sorry I said that right there oh this is funny all right so I'm actually going to mark this as done now that we're there and on the note of that by the way that I want to mention is that little thing that we see right there with the tablet
view you can always select it right there you can actually open stuff further if you wanted to see more information on the work order as well now that it's been started and I've been marked it as done I can actually go further back over here to our manufacturing dashboard again and what has happened oh doers the oee has been instantly impacted the number 33 has turned into the number 25 and by basic math we have lost eight percent efficiency now when I click on the oee button ah you'll notice we have a new sliver A
reduced speed it's just a little bit of a large piece of this pie now you'll notice that this is due to the increase you know in the time that it's going to take for this and that's what gives us the reduced speed now if I click on the pie chart segment over here called reduce speed you'll notice I am shown the list of lost reasons contributing to reduced speed ah you weren't expecting that but you can actually do that and that's kind of like the interactiveness that I like to talk about with odoo now if
I want I also have the option to manually create up here a report and a reason for you know the loss of time for this just to for example I experienced a material availability shortage I can list that here I can select the work center for this I can even select directly the work order as well as a lot of other information we're going to go back over here now as promised everything related to the oee calculation is automatically handled by odoo based on the actions that employees record during the manufacturing process it works the
same way for every work center and even takes inter-workcenter flows into account thanks for watching I'll see you next time Bro Doers please go eat a snack whenever you watch some of these videos if you have any tips you'd like to see me do something else leave me a nice comment


![steal my GHL snapshot to book 20% of your inbound traffic into sales calls on autopilot [FREE]](https://img.youtube.com/vi/Fms-zUT-t8c/maxresdefault.jpg)