Good morning my name is dan dan Bray my company is full spectrum Diagnostics I'm here on the behalf of grace engineered products we're going to do a three-part webinar today Thursday and next Tuesday discussing the basics of vibration analysis a little bit about my company Minneapolis Minnesota we do have a vibration analysis training division our training is aligned with guidelines put in place by the American Society of Non-destructive testing or a SMT and the ISO International Organization for Standardization everything we do in the field goes into our training materials so most of our instructors spend
at least 50% of their time in the field getting hands-on experience and understanding how real systems work we also have live certification training and interactive training and that's becoming more popular with all the virus problems there's webinars going on like Crazy now we're part of that so if you like what you see there's plenty on the website that I'll be showing you at the end of the presentation and you can come find me most appreciative we also has a machinery analysis division our specialty is experimental mobile analysis and operating deflection shape analysis but basically what
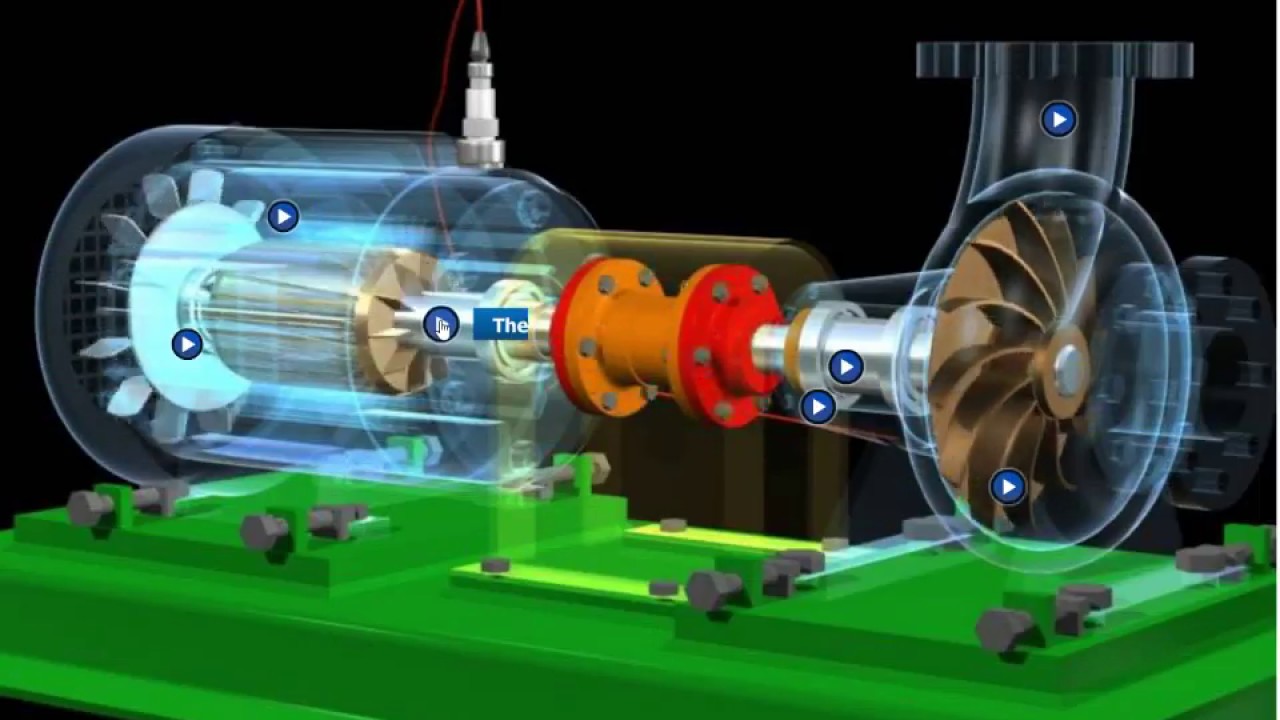
it boils down to is the animation type format you have on the right here this is the animation of one of the problems in the Machine this was a refinery pump in Wyoming and you can look at it and you can say that it doesn't look right it looks like it's out of phase with the motor and something's been stepped in the coupling everybody sees it right away in an animation I spent years talking about vibration I can put a room to sleep immediately but if I have an animation I throw it up like this
everybody can see what the problem is everybody has a part in the solution so I have little corny saying down here at the bottom but it's true our process is making vibration analysis and workable throughout the customers management gene such that they can be involved in their own asset management solutions everybody gets involved when they see an animation we also have a imaging division we use amis co o es videos basically it's a high-speed video vibration analysis we take high-speed clips we put them through something Called an optical flow algorithm which enhances displacements we scales
the amplitudes and it allows us to see what the human eye can perceive in any video animation either because it's the events too fast or the displacements are too small or both so here you can see there's some type of problem in the machine is moving awkwardly what it turned out to be the give you a short version of this is there was a problem in this foot of the motor of the Structure under the foot this is base plate was lamp grouted in big speech handler I mean channel around the outside state pump grout
in it delaminated from the base plate so lifting so you get this kind of diagonal vibration going in there and put a little color on it this should be all gray down here there shouldn't be any any color to it at all that just tells you that there's some motion there so the only way we found this was with a Vibration video which was very interesting ok this part one the introduction to vibration analysis we're going to have first a high-level overview of the predictive maintenance process now this is going to be recorded and you
can get a copy of the recording you can watch it as many times as you want I instead of sitting there and making notes or anything like that I would suggest you just sit and absorb it ok I might have to talk a little fast if You're writing things down here you're gonna miss some things so just sit back and have fun so it's a high-level process when we look at first we're gonna look at the measurement to analysis cycle all the way through and that's the core of vibration analysis we're going to look at
the vibration fall periodic table nose first table that was on the screen saw before this is structure and method this allows the vibration analyst to think Logically about which faults applied which don't and we're going to hit a walk through a series of examples on that so there's 35 faults on the table which encompasses most protein machinery problems they're logically sorted in group with respect to the dominant frequency content and the dominant directional response they help us zero in on the root cause problem and you know there's always a difficult problems that there might be
two faults or three Faults dominant you know going on at the same time this will at least get us into the ballpark but most of the time it takes us right to the root cause and the final topic we're going to touch on the industrial Internet of Things in artificial intelligence in vibration analysis so I've done this for a couple of years and I look at technology and I see how different companies are progressing there's companies out there making transducers and having databases And everything is Wireless to the cloud type applications this is kind of
looks at that where we're going and what we've done and actually some of the things that we've talked about a couple of months ago at Grace products they're doing things that are following that path and it's a it's a good way to go it's going to be really exciting in the future this is the very basics of vibration analysis and let you at the top there the best way to start any Vibration analysis training is to provide an overall process view of the main concepts so here it is listed out I have my picture on
the side there's seven steps to define the machine of interest and this is important because we have to know what type of alarms to put on not every machine is the same and statistically we're gonna be able to pull out in an alarm level and this is 0.3 to 5 inches per second so a velocity overall measurement we can put into our Database and set up as an alarm it's just knowing that the type of the machine you have we're going to measure with a calibrated transducer so 100 millivolts per gene the analog signal is
a voltage versus time waveform and there's multiple Wiggles in that wave farm we'll talk about that we're going to digitize that signal and sampling digitize it and turn it into a format that's not in human an analog signal so that we can get our Hands around it and then we're going to pump that into an FFT process fast fourier processor that's where e is a way of extracting the periodic events in the time wave form so you have that complicated waveform in below it there are several some more simple wave forms it's a combination of
sinusoids and the processor does that for you so fast Fourier transform takes you from the time domain which is here into the frequency domain so now we can see in The amplitudes in the frequency content of that complicated signal and it's 99% of vibration analysis is in the frequency spectrum so this is how it's done so a simple a simple equation frequency is 1 over the period we can go through it manually but for complicated problems complicated waveforms it's much better to use the processor this is great knowing my frequencies are there but we really
have to know how much is too much and this is the van der Laan Version of that so we can set up our alarms based on what kind of machine we have and have this little stair step threshold level that we're going to look for as far as good or bad and you can trend all that games run our statistics on our alarm bands and our overall LOC did a good idea if the machine is starting to progress towards a failure mode here's a little graphic it's kind of nice if you are listening and you
want to copy this I can I can't give me The PowerPoint but I can give you a PDF of presentation if you're interested in email it to you and let us know this is where we start we no our machine so this machine is an overhung direct couple fan so on my list of different types of machines this is an acceptance criteria this is an alarm value all these are statistically set so I would grab a bunch of reciprocating compressors I would look at all their overall amplitude levels and taking mean Plus 3 Sigma and
get an effective alarm level for that machine and do that same exact thing with all of these different types of units so we have some graphics here cooling towers three different kinds of compressors there's five different kinds of fans or blowers there's motor generator sets chillers turbine generators horizontal pumps in vertical pumps okay then we get a good idea what our machine is and what their alarm criteria is so in this case the Little icon is telling me point three to five so I have a directory of and overhung fan point three to five inches
per second which is a velocity level and it gets us in the right form for setting up our database this is a transducer so it comes in a lot of different forms this is just a single axis transducer the ones that we're going to talk about in that later are typically three axis tri-axial MEMS accelerometers we'll talk more about it but the direction is very Important where we go with this one we're gonna measure the machine with a calibrated transducer typically it's an accelerometer it gives us acceleration accelerometers are the best transducer he is but
acceleration is not the best unit to use because it has a problem we'll talk about in on Thursday with some of the basics of vibration it changes amplitude in the speed there with frequency so we have a problem with the acceleration parameter in the Displacement parameter the liners are expensive they give you you velocity directly but the accelerometer is easiest because they're cheap and you can mathematically integrate the signal in get velocity outfit okay a lot of jargon a lot of stuff not really important that you know that right now but accelerometers and velocity or
the preferred method we're going to acquire data in multiple directions we have the tri-axial cell Raman and we just put it on top of the housing we get XY and Z in one shot if we have single axis transducers we're going to have to move them and measure horizontal vertical and another one in the axial direction that's not Chile why is that important if you look at this cartoon that I've made as the unbalance vector swings by my red transducer it's peaking out as it swings by my blue transducer it's peaking out 90 degrees later
we're a quarter of a revolution Later so this is telling me in a couple of things it's it's telling me that what the frequency is going on the Machine I can see that from my periodic event and I can calculate that I can see the amplitude but I can also see the phase shift so there's something going on differently in the vertical and horizontal direction okay and that's just doing that moving our transducer 90 degrees but this will tell us if we have a balance problem if we have a Misalignment or looseness or bearing or
a bent shaft we're going to get a different phase relationship yeah and that's one of the things we're going to talk about in the industrial Internet of Things the wave of the future if you will okay so we're gonna a direction is very important vibration Falls are directional you got to keep that in your head a little cartoon a little cartoon little animation of a bearing on a shaft it looks like the Bereans cocked and in Fact the inner race of the bearing is cocked so it's kind of pitching the shaft every revolution okay but
what's important here we're gonna capture an analog output from the transducer and it has all the different all the vibration of everything that that transducer sees is presented here okay I'm going to tell you what those three Wiggles are you can't see them right now but you will in a minute one is the rotation of the shaft it'll Put itself turning speed of the shaft will put a big peak in the spectrum the other is between each of these balls there's a carrier that separates the balls and keeps them spaced at the right intervals so
in a bunch up on one side of the bearing it spins with the shaft but only about half of shafts be about 40% of shaft speed actually in the third rotating system is the balls themselves they're spinning as they roll on race waste so you have three rotational Events going on the transducer is picking them all up in raw voltage versus time signal we apply transducer sensitivity typically however millivolts per gene and now it's a time waveform in acceleration okay because the the transducers typically accelerometer will pick up acceleration we can mathematically change that like
and talked about a moment ago but you don't have to do that right now so there's the three chat rotation the Train rotation or the cage of the bearing and then rotational rolling elements themselves number four we sample and digitize the data we can't take in to the FFT processor an analog signal it's you know what signals are infinite so we sample and digitize a very high rate and we grab points enough points that it really is a bunch of dots but it's they're so close together that it looks like the line okay so we
get a good representation of the signal and Then we do where all the magic happens is the FFT processor this the FFT that fast Fourier transform basically takes a time domain signal and turns it into a frequency domain signal the way it does that is it extracts the individual periods and defines them so if you look at this period it's part of that waveform I got three different rotational events going on this would be the lower frequency wanted a caged frequency but you can see It as you look at all the peaks here you can
see a subtle wave in that in this thing and it starts here it waves through and it ends there so any periodic event it'll start at a certain point it will go to a maximum and go through zero go to a negative maximum and then back to zero okay that tells me how long that event is if we know how long it is we can calculate the frequency the frequency in Hertz is one divided by the period in seconds so we Know this is half a second one one divided by 0.5 is two Hertz two
cycles per second okay if we're like rpm or CPM that're cycles per minute we multiply it by 60 so that's just a unit change but that's how we're extracting from here the FFT processor is pretty complicated this is the simple eyes version of that but we'll pull out the amplitude and frequency in period one the amplitude and frequency of period two and of pairing three so now in frequency wise We know what those three peaks are in the frequency spectrum as well as their amplitudes so here we are we are three periodic events need to
extract them all we apply this braid transform and it gives us those three peaks and where they're spaced in the spectrum so if we have the turning speed in the shaft frequency to here then this is some synchronous it's below running speed below turning speed this is 1 times our p.m. so it's it's synchronous and this We're gonna have to calculate what that is how it relates back to the turning speed I'll show you in a second so what's important we can identify each peaks frequency which peak is the rotating speed of the shaft that's
really important and how do the other Peaks or relate or what ratio do they have with respect to the rotating speed best concept is how do we judge the severity you don't have any criteria quite yet that's on the next slide now This looks complicated and it's pretty easy it's once you have it set up it's it's kind of a cookie cutter type thing so this was setting up alarm bands for bearing health for rolling element bearings okay some that we have so we have rolling element bearings or you use this parameter will have an
overall level which comes from whatever machine we have so our overall lovers can be point three to five inches per second we'll have sub synchronous which is Twenty percent of the overall level that's the amplitude we're going to have we have a 1 times RPM range will be ninety percent of the overall level we'll have two times RPM range or twice running speed and it's going to be a forty percent and three times its 30% in blade past frequency ranges and bearing defect ranges are twenty twenty five and fifteen percent so we set this up
with an idea of how machinery fails if it's 1 times RPM tourneys being the shaft or Some hunt small harmonics of that they're going to be a threshold type of arm when you get out of here the weight bearings fail you learn the amplitude is very small so we're trying to pick out really tiny Peaks basically out of the spectrum and apply alarms to them the nice thing about the database you can set your alarms any way you want and you can set them up to learn so that they'll adjust these levels these are a
good starting point twenty percent ninety Percent and so forth statistically you can look at every band and you can actually can use as many bands as you like the result is we have frequency amplitudes and you can compare some severity criteria to them so I have the stair step program and it looks like my frequency at turning speed of the shaft is exceeding that and at this higher frequency out there they also and once you're in a frequency format You compare everything the turning speed of the shaft to seeing what frequency it is frequency 1
739 / 1760 the turning speed in the shaft I get 0.42 x rpm so it's a sub synchronous frequency that's below turning speed if I have a peak at F to basically do the same thing kind of a no-brainer here but 17 16 / 17 60 is 1 times rpm it's turning speed at shaft so physically is turning 1716 times per minute but it is the one times rotational speed of the shaft once per Revolution okay 3 this mystery frequency out here 8025 I divided by 1760 and I get a fraction it's not four times
it's not five times on each beat it's four point five six that's telling me it's non synchronous or it's non harmonic and typically that's a very frequency that might be showing up okay we'll get a little bit more in detail with that there's me killed this is how we would commonly take our data and it usually goes into a database and the Database applies the alarms and tells us what's what's bad and right now it would shoot out an alarm report that would say r1 times rpm peak in position and three on the shafts of
a fan bearing three fan bearing four they both exceed the criteria in the vertical direction on those two bearings so that gives us some good information to go and hunt for what the problem is okay so everything's a process of elimination when we start with what Canton what is the problem What can't be the problem we move through the whole series which takes us to the vibration fault periodic table so this is an invention of full spectrum Diagnostics we use it in all our training it gives everything structure and the logical sorry azam we have
several things that we're going to talk about one is there's 35 faults on the table that encompasses just about everything in rotating machinery it's organized by frequency Content which is the columns so there's some synchronous range there's harmonic there's sub synchronous and non synchronous and modulation and we'll show those in detail in a moment it's organized by directional response and that's the color of the tile on the table red is radial yellow is axial even orange could be radial or axial usually it's by design by the gearbox it's the orientation of the teeth which really
Tells it which way it's going to respond so if there is an orange category they can be even in lastly once we've sorted by frequency content and directional response we can look in the tiles that remain on the table and they'll tell us what kind of diagnostic to do and the Diagnostics we have our phase analysis time waveform analysis orbits transient analysis or an ultrasonic analysis we don't need to know what those are we just need to know what to do next you Know if you're sitting down with your vibration guy and your supervisor it's
very likely you don't know a whole lot about vibration analysis this is made for the manager theme supply chain the asset managers in the whole system to help them understand vibration and I do this for every analysis I do I will basically show them this PowerPoint presentation and say here's how they narrow down your problem in its 5 slides 7 slides something like that and you get A logical sort now - here's what your problem probably is and it's really helpful you know they don't know anything about the diagnostic side do you but I just
explained this is exactly what I've just said to you it's synchronous problem it's in the radial direction it's one of these four and do a phase analysis and we need out which one is the oddball and we're - our solution yeah pretty much simple as that the light throws you Curveballs every once in a while like every week for me we're look at synchronous faults okay so what is synchronous synchronous is turning speed of the shaft it's turning speed of the shaft very important this is what we want to compare all the other faults on
the table too so if our fault is that turnings beam and our past example is 760 RPM that's going to be what we focused on so if it's at turnings be synchronous fault it's one of these 11 Things and we have to throw in our little oddball natural frequencies can occur at any frequency there they're predominantly based on the mass and stiffness of the system that's vibrating okay so if they get close to turning speed you can amplify the response but they're in every category so we have to prove or disprove everything on the right
now synchronous problems when you got rid of all these other grayed out tiles right so we went from 35 problems Down to 12 so what do we do next we look at the color and then what do we do next we look at what our little icon tells us to do okay so there's synchronous problems and synchronous is turning speed in the chat so here this case 1784 we divide it by 1784 when you get one time so I feel okay little fault cursor and put a little circle on here the squares are the harmonic
cursor so in your software you can probably put your cursor on the Main peak and see how the other Peaks are related to it right so two times rpm three four five and six times so this is probably a blade pass frequency and I have six blades on a pump or a fan you know I get a pulsation at that frequency if it's exactly an exact multiple an exact harmonic okay here's our harmonics balls harmonic Falls are exact multiples of shafts be ok notice there's a little overlap when I have a synchronous problem it's a
dominant 1 times rpm and Usually there's a dominant 1 times rpm in this column as well but it's at 2 times rpm as well so you can have a 2 or 3 times earnings being harmonics and start showing up you still have to figure out phase wise what the problem is they're they all have the in phase icon you know but for you know nothing simple there's always some overlap harmonics are company misalignment bent shaft another coupling angular misalignment bearings and Even that the animation I just showed you this morning of the bearing and balls
going around it had a cocked in a race so it was rotating and producing usually twice running speed harmonic so our - these are one of two times usually this column is based on the design of the machine so I'll get a gear mask at whatever the tooth count times running speed so if I have fifty three teeth on my gear I'll get a fifty three times Running speed peak in the spectrum if I have blade pass frequency like that last example ten thousand seven hundred and four die / 1784 I'll get exactly six times
so one two three four five of the exactly six times running speed that we might harmonic and this column is looseness type problems and they'll generate a whole string arm locks either either fraction fractional harmonics exact fractions or two times three times four times five times just a whole String when it starts to get loose okay and here's my example by a blade past frequency and that frequency exceeds my threshold I'll see how it relates to turning speed ten thousand 704 / 1784 I gets six times so it's a exact multiple it's a harmonic of
running speed that tells us there are six blades on the fan or the pump that were inspecting okay stop synchronous false false that occur at frequencies less than turning speed of the shaft so if I have a caged Frequency like I noted before it was at point four two times running speed it's less than 1 times rpm it's one of these types of problems so unless this problems can show it rubs some gear problems some electrical problems in oil world in journal bearings and so forth so synchronous in non synchronous overlapped on these two columns
so you can have low frequency sub synchronous and non synchronous problems but basically the main definition is sub Synchronous is the less than attorneys fee here's my example I have a peak of 749 CPM I have a peak at one time sorry PM 1784 and I divide those two I get point four one nine times running speed so so sync and you can see on the graphic obviously it's below the running speed non-synchronous is a group that is not equal to multiples of chastity so they're not harmonics so any anything in between the Whole number
of multiples of turning speed are what non synchronous frequency start and this includes oil world oil without all the bearing rolling element bearing frequencies are all non secrets and so how can it be there's so many different kinds of bearings I had a bearing database that had 18,000 bearings in it and there were three that were exact harmonics but you know you just take it out enough decimal places and it's going to be non synchronous Simulator anyway so we have several different non synchronous peaks sources one of those is this problem and this is a
good one because it's so tight I have a peak that shows up at 54:41 I divide it by running speed 79 before I get three point zero four nine you always take them out of three decimal places because this is not a harmonic it's not three times it's three point zero four nine so it's really close you know there's your huh three Times so I have one time two times three times four or five six this has been my harmonic cursor so I am NOT at three times I'm just above it and seems subtle but
you get the idea so that is very likely a very defect frequency it's showing up the last moodiness modulation this is a what shows up well a lot of times you can hear it's a pulsating combination of false so here ahead that's pulsating combination of false listening to it you can hear the pulsing Sometimes measuring it in the time waveform a lot of times it's low being beat frequency that you see but in the spectrum it's something a little bit different what's called sidebands so I the only way to show you this is to show
you by example I have my my Peaks I've been playing with all along it's still the machine at 1784 rpm turning speed I have my harmonic cursor none of these line up they're all non Synchronous okay I put my cursor on twenty thousand five 16 / running speed at eleven and a half times range me so it's non synchronous it's my eleven times it's not twelve times it's eleven point five times okay so I start doing the same thing with all the other Pete's / turning speed so I have thirteen point five twelve point five
one two five ten point five nine point five which is they're all non synchronous but they're all separated by turning speed frequency So twenty thousand five sixteen - 1784 I get eighteen thousand seven thirty two and I subtract turning speed from it again and get sixty nine so this is how modulation works there's a center frequency that might be some some known frequency and then sidebands on either side plus or minus the exact spacing so we'll get more into that as we go but that's one of one of the fall categories the last one okay
so we sort it by frequency and then we sort it by color Or direction in this case the dominant direction for the red box is in the radial direction so neither horizontal or vertical or both okay the dominant direction for the yellow blocks is axial and this is the big separator in the synchronous problems so we can eliminate you know if we have radial response there's four possible synchronous problems that produce radial response if we I have an axial response there's six possible and the gear is orange it can Be in either direction but we
can wipe out a whole bunch of possibly right off the bat with knowing what direction is dominant oh there's one oddball out here the bearing cage frequency the spacer between all the balls when he rotates if there's a thrust load on it it will respond in that direction you'll start to see an axial peden spectrum which is unusual that's the only one that varying Frequencies it acts in the axial direction radial hand or axial fault kou this is a lot of times by design of the machine so if we have a gear gearbox it can
be a right-angled gearbox herringbone it can be a spur gear you know that configuration might give us an idea of what directions can be dominant but as far as we know it's a gearbox without looking inside so it's more to convene their direction Electrical they can be multiple directions natural Frequency means turbulence things like that there's no really pronounced direction it could be any any new three and then we narrow down the possibilities so the recommended diagnostic is the icon in the upper right hand corner of each tile and I mentioned before we have a
phase analysis time way from orbit transient and ultrasonic analysis okay phase analysis very good for synchronous problems time waveform very good for Gear type problems orbits if I have journal bearings that's what the best enough that means to figure out what's wrong with them is with in orbit plot transient analysis for different natural frequency problems and ultrasonics for bearing problems so very enter a small spin outer race and change frequency and even very natural frequencies will show up occasionally so they all have their place this is telling us what to do so I sorted by
frequency content I sorted by Direction and then I go and do my diagnostic test to narrow down hopefully to the root cause all right so this is a lot of stuff but without a demonstration it's not as acceptable so we got one more little twist on this so I got a real world example here we have a AC induction motor it's direct coupled we have a bearing as a centre hung the fan inner and outer bearings they're rolling elements in this case so everything's Set up what else do I have it's an AC motor so
it's not TC okay I will start the sorting process based on this so the first thing we can do you don't know have any vibration at all here's a series of blocks that are designed related so we have to consider that machine design the drive type the coupling the driven machine type the bearing type and the roller configuration you know we're going to walk through each one of those for our Example so I have an AC induction motor I can get rid of DC electric problems and fluting as long as this then people might you
might not know what flirting is its electoral erosion of the raceways in the bearing from discharges of either current or voltage so this is a DC motor that that occurs sometimes AC induction motors on variable frequency drives it can also occur so but if it's just an AC induction motor usually it's electrically it's it's pretty good and You'll never get the erosion problems but there's two blocks that we just based on what we know about the machine you can get rid of those two direct coupled meaning that there's no gearbox so the for gearbox problems
can go away and to belt rack problems go away okay rolling element bearings throughout my oil world and oil whip these are journal bearing problems a thing called weight center hung rotor my overhung rotor unbalance doesn't apply it's a not the Specialty machine so there's something called roll bar e in the paper in aluminum and steel industry that doesn't apply this and what happened all my great blocks here I went from 35 possible faults down to 23 and I haven't done any vibration analysis yet it's all based on machine design okay and I can't tell
you how helpful this is a lot of times you'll try to prove that you're running through in your head as you're doing Diagnostics And you forget about certain things you say you know what about this problem of that problem and it's already off the chart if you don't have this chart and destructure logical sorting mechanism you go in circles sometimes and I've been there okay we're going to consider the frequency routine so this is the data for our machine or direct drunk-drive threat coupled over humph am a certain phone fan We have peaks in the
spectrum there's nothing actually there's nothing in the horizontal direction vertical direction the motor spine in Barrie's 3 & 4 there's a vertical 1 times rpm pink that's showing up in the spectrum okay how do I know this is 1 times rpm that's how this alarm dam is generated so I have a little one times I've been 2 times and I have a little as 3 4 5 6 times so that's how when we originally set it up in the database so the Database is telling us you have alarms at position 3 & 4 in the
vertical directions at turning speed of the shaft so it's a synchronous problem it's a turning speed in the shaft it's at 1 times rpm it's the first two columns on the table plus the natural frequency so we had all these blocks selecting everything that's not synchronous will also go away so those blocks all through here except for natural frequency so it's not a bearing Frequency it's not electrical it's not all that it's synchronous so we're down to nine problems from 35 to 23 now we're at 9 to 10 problems we're gonna sort by color next
to bunny direction dominant direction and you go back to this there's no axial vibration which is nice so horizontal and vertical they're radial vibration then only the vertical one has the alarms to it so we can say that this is not an axial problem so the Yellow blocks go away and we're stuck with after just sorting two times in removing the faults that are based on the design we're down to five different faults that it could possibly be okay so what do we do next we do what the table tells us to do next you
perform a recommended diagnostic upper right hand corner we have a phase phase phase and phase for these synchronous problems and we have transient analysis for the natural frequency problem okay this is One of the two tests that we traditionally use to look for natural frequencies one is a waterfall plot where we can start or stop or in it or if we have control of speed somehow you can either do a startup or post town or a control speed change and we can see if there's a peak in the spectrum close to some operating condition hey
the easier way I think is to do a natural frequency impact test so you get an instrument and hammer you hit the machine like a Ringing like a bell and the frequencies that come out of that ringing are telling you what the natural frequencies are so when you do that type of testing all the time so in this case we couldn't find a natural frequency so what's left these four phase Diagnostics for unbalanced as centricity loosens type a and an alignment offset in gradient direction what are those tests these are the categories so doing the
phase test not Really important right now understanding that what it gets you is is very so I checked for unbalanced and SM tricity I should have a horizontal to vertical phase shift of 90 degrees at each bear me so all I do is check the boxes for those that apply I do a little survey of the whole machine see how one point is related to a reference location and I can see how it's moving just a rough a rough animation of the machine I checked for misalignment across the Coupling if the coupling is moving out
of phase either radially or actually it's a good check for and hey you got something misaligned in that couple in this case we didn't have that we had normal unbalance conditions at low level we had no ax centricity the only one we did have we had a lot of vertical response and that's a good signature for soft foot conditions so basically it had a foot that was shimmed improperly or had too many shims or they forgot to do It where the ball was loose or broken there's some some condition in one footing foot on the
machine that gave us fits and in this case looseness type a is that type of fall so we end up with houston's type a okay everybody can understand it's just sorting things using what you know to eliminate problems and if you can't eliminate them they stay on the table okay I'm gonna jump to it a little different topic the industrial Internet of Things artificial Intelligence and vibration analysis I have about 15 minutes left I think I'm going to try to get some questions in after this if you guys have questions you can type them in
to your computer and they'll show up on the facilitator screen and we'll answer those so this is something I've done the last couple years and I continue to look at where the technology is going with a wireless transducer in cloud data storage all that type of The gold standard is the thing that everybody's looking for is to permanent wireless transducers 24/7 monitoring that can do a lot of things and the four things that have main interest right now our overall vibration training which is just an energy level response of the machine in overall ultrasonic training
which is a filtered high frequency failure mode for rolling element bearings you'll get really small impacts that you can only see in high frequency Range a lot of people are going to that the transducers that finding both on-demand time waveform and spectrum capability it's real important if you have an overall level that it seems a certain criteria that you do a waveform or a spectrum to see what's really going on there's some clue frequency content wise what's what's happening and then probably the hardest one is on-demand phase analysis or my case animation capability I'm showing
you a pump and it Probably had 30 measurements on it and these were all the amplitude and phase type measurements they're all simultaneously acquired so I can see how the machines moving and I can get an animation like this if we have on-demand phase analysis mean in one transducer link and talk to the other one simultaneously then we can do something like this on a real entry scale for every machine assuming you know things in the future keep going the way they Are and these wireless transducers gets smaller and more battery efficient and you can
link them all together on a machine you can put just a sonar net of transducers on your machine and get all kinds of animation response and phase response gold standard is also the transducers are powered by an infinite energy source which never will happen but you know battery technologies get better and better so that's something to watch transducers Sensor nets they can talk point-to-point and acquire data simultaneously was just kind of an over that as far as that's what this allows and actually we can do phase analysis right away that can be part of the
algorithm if we have a point-to-point acquired data we know the phase shifts from point to point and what they should be we can program that into our software and we can basically have smart smart machines smart sensors artificial intelligence algorithms Designed for trending detecting assessing and defining machinery problems this is phase analysis that we can do on the fly would be fantastic vibration data training interfacing with other plant process variables most immense transducer will get you temperature as well which is good they can do pressure or well they can't the transducer can't but we should
the plant usually will have pressures flow steam efficiency on some type of data system Of PI system the idea is to link to that so we can get another you know non vibration measurement that might be part of the puzzle infinite data storage and monitoring capability in the cloud everybody's going to that so it's not inexpensive but it's it's uh it seems like we have enough data storage now and the real thing is to work on the price in the battery life so the price point is is low for these MEMS transducers and The art
triaxial most the time and it's a it's a good it's a good place there's gonna be a big jump soon I think this the last one is long sight vibration analysis an elicit is eliminated or replaced with remote online monitoring I think we're not there yet that might be in the future there might be just smart algorithms that will tell you when your machine is going to fail but vibrations so subtle sometimes and there's multiple things that happen and it defies the Linear logic sometimes but the more transducers you have if have 24 transducers on
my machine instead of four I could do a lot more so it all depends on you know pricing the transducers and how they can link together and fire data this is kind of the flow chart so I have acquiring data with my transducer up here I can also acquire phase data like we mentioned if all these transducer locations are linked together I can get live phase Analysis which is fantastic so we have overall vibration levels we have time waveforms we have spectrums that we can capture right right now we're doing little packets of overall levels
so we're getting the least diagnostic information but if something changes and goes into alarm that prompts us to take a spectrum take a length one and when we have to take it everywhere we can target the location that the alarm came from so once we have that we can start using This type of logical circuit sorting mechanism that will be able to tell us what the cause of the problem is current state of the art it is route trendy being why do we stop that it's there's a lot of inaccessible locations there's dangerous things that
you can't monitor as well as you'd like to that is perfect for permanently mounted battery powered units especially a lot of places I go like refineries there's you know you just don't want to be close to some of These machines what they have out in the market right now but now tree powered units they do everything they do the training the ultrasonic the spectrum the waveform phase analysis orbits they can do all kinds of natural frequency tests anything you can think of they're thrown into these portable unasyn it's just you know you have to have
a skilled guy the nones vibration you knows how to use it to get the most out of it databases were constructed with these so We're uploading and downloading data constantly they don't really have algorithms they have some statistical analysis they can use but you do have to have a five guy that knows what he's doing infinite storage in storage really isn't an issue and even with hard drives being as big as their price point is low unacceptable and when you throw all the cost in I came up with roughly about $25 a point which is
what $400 a machine no 300 sorry so not bad on site or contract vibration required yeah there's still there's still a place for that manual route based portable data so this is the kind of stuff you're gonna get you can get a spectrum you'll get overall levels so here I'm moving between different overall levels and doing in and out of alarms and you can see how the spectrum is changing this is what we don't get the spectrum over here from just a single point so this is just Telling me I'm at why here I'm at
point three three four inches per second so I'm in alarm but this is the information I need to make a call on a piece of machinery okay there are supplemental spot checking methods a lot of places will give the operators like in power plants an overall meter in milk oh well it's battery-powered it's storing just a value there's no algorithms minimal vibration analysis training required data storage Is limited but you can download it price is low so it's it's good you're making use of your operators and people are walking around writing something on a clipboard
instead you're getting an actual measurement but it's only as good as the operators naked this current like wireless system options a lot of them the first one they're going to semi Curren amounted data collection to get some of this capability transducer battery powered in some cases and Sometimes they're wired in as well but here's here's the thing that makes it really valuable if you do a route based vibration analysis you're only getting about twelve measurements per year at any given point on the machine twelve measurements is tiny I have an example to the right this
was four days worth of data one one data point per hour so about ninety four measurements if we get this we can get better uniform data collection because it's magnet mounted Nobody's walking around and touching a different point they it never gets moved you're gonna get better repeatable trends and you're gonna get massive amounts of data if I'm route based it's twelve measurements a year if I'm Wireless rate when permanently amount of transducers if I can one per day I'm getting three sixty five measurements in the year one per hour almost eighty eight hundred measurements
making about half a million measurements if I do one Every minute so we know this is crazy but how crazy is it when I look at this I'll get to that okay price point is lower still need a vibe gun so forth okay this data is the starting point so I have some alarm levels that I mean plus 3 Sigma it's based on the real data and yes just statistics okay this is where the alarm problem will occur this was apply of regular vibration velocity which is the red dot and this scale is acceleration so
it's pinky that's Ultrasonic measurement and some of the stats on that but this is what you can do with the single point and wireless transducer you can take that data and you can get this was ninety four measurements this is one an hour and I can see massive statistical changes the gray was initial you know the first couple hours it's pretty ragged and then all of a sudden started zeroing in on a much better statistical learning level and This is only four days it's I think it's something that's phenomenal or just a basic vibration monitoring
you know you still need to get a spectrum in wave form but it's telling us a lot more then than we think it is and I was just using basic statistics and having them update every hour and it gets a really nice trend evolving systems Wireless semi permanent mounting data collection there's a lot of them out there that will do wire and Battery powered or it's it's you have the option of either data stored Oh spectrum and waveform can be collected on alarm of by request that's really important because you don't want to be pumping
spectrum every day you'll get a where the battery is out in no time price point still high capability is increasing so it's it's out there it's it's elusive every time we want to do something it's hating me what if we do this and that might cost a little more Money so it's it's pushing in the right direction but it's it's it's gotta be evolving all the time which I believe it is this is in fact this is one of the time weaith ones from one on one vendor out there which is horrible there it doesn't
even look like a vibration specter time waveform spectrum this is the spectrum which looks pretty good and I don't think these were collected at the same time this was like noise to me this looks like harmonics so there's Maybe a looseness problem on this alignment problem it's telling us something is going on and it gives us a clue this is another vendor where they narrow banded everything this is a rolling element bearing Raceway frequency and it was on a gearbox was just buried in the noise floor so we have to put it on a log
scale put some specialty alarms in it and we can start picking it out so there's a lot of things you can do with the databases as Far as pulling things out that vary so okay future battery-powered transducers unlimited life is what we want power compromise you'd love to go just full battery our transducers are getting better than the MEMS designed the mic micro electric oh the light I can't place a micro electro magnet mechanical systems so gnomes integrating plant process parameters creating algorithms and we having started creating algorithms chip real subtleties of Overall vibration synchronization
of transducers to get phase analysis basically the elimination for on-site vibrational switch I don't really approve up I think he has a very useful function but you know if you supplement it with an off-site guy or a contractor you can also be there so here's our grand look overall look at everything we acquire our data overall trans-time waveform spectrum where we're isolating potential problems we're Pulling up our current rule base and seeing what's good and bad an overall vibration or individual Peaks and in spectrum we're comparing that to plant processes so we're where are we
on the pump curve or the fan curve that could be the entire problem but we're never comparing our vibration to plant process maybe and we don't know that we update our machinery animation so we can have depending on what kind of net of transducers we have we can get some Decent animation and then even applying a rule base for potential fall so maybe this is moving like this but it's not high enough amplitude that it's an issue yet we can still say hey here's our potential problems you might have a loose fluid or soft what
we might have misaligned coupling and we might have some blade pass frequency problems they're showing up and then we apply that and get a better idea of where we sit statistically and then start the Process over so it's doing this not 12 times a year every hour every minute you're getting an update in a better idea of what new machines trying to tell you if it's hurting or if it's fact oh man happy alright I blown through an hour barely sorry about that try to hold it to an hour if you guys have questions I
think Nikhil get back on they need to contact me or you want a PDF of this presentation I think more than happy to Email you one so let me know and you can contact me if you have any other questions about training good morning this is Danny Marie from full-spectrum Diagnostics on the behalf of grace engineered products this is part 2 of introduction to vibration analysis a little bit about me my company full-spectrum Diagnostics we do certification and testing and all different levels of vibration of all kinds of different classes I've been Doing it 30
years and there's always something new that pops up we also have some live certification training we do it on-site at the customer site or we do have public classes in the Midwest as well but what we're getting into now and based on all this virus stuff is more the interactive training so a lot of webinar formats like we're about to get today and some online classes that I already have a learning management system on my website if you're Interested in something like that so always something new what you're seeing on the screen is the vibration
fault periodic table this is something that was invented by full-spectrum Diagnostics in it's a guide and gives you structure to your analysis and we're going to be using it today to show how it works we did some of that on Tuesday these will be a little different examples but same sort of format our company get to it our company also has a Machinery analysis division and I mentioned this on Tuesday that we do experimental mobile analysis which is looking for natural frequencies and structures in operating deflection shape where you're trying to get operating information about
your machinery and trying to diagnose its response big part of that is the animations they're created when you do this so you get a good measurement mesh of your machine and you bring it to life you could put Your cursor on any frequency of interest anything that's out of the ordinary and it'll show you the an immediate shape and like I mentioned the other day this is unbelievably useful I've been in large crowds of people where I presented vibration analysis studies and things that I've done and that you lose the room almost complete unless they're
engaged with something this brings total engagement everybody in the room can look at this animation And say yeah this there's something wrong the looks like the coupling is misaligned yeah exactly then they're all raising their hands trying to offer something that they can do to make the problem go away so my my little little thing for this they're trying to make vibration analysis visible and workable throughout the our customers management chain so today can be involved in their own asset management solutions which is which is true everybody's helping so it Really makes my job easier
and a lot more enjoyable third thing we have is we have an imaging division something new that came out there's a lot of high speed video cameras out there this is a version by vibrant technology makers of any scope the animation software that I just showed you on the last slide this video clip is processed with something called it's a little different from others out there it's a optical flow algorithm it enhances subtle Displacement rescales the amplitudes and now you can see things you haven't seen before and this is a bearing housing on a fam
outboard bearing you can see how it's movie and this is real life its amplified so obviously but they had all kinds of problems with this thing and they were always looking at the at the top where the bolt Bolton section for the bearing and that's always been tight and they've over tightened it and caused other problems what they didn't do was Go down and look in here this is the the foundation and it looks like the it's an accordion the way this thing's moving actually it's down in this area where the grouted in base something's
loose under there either one of the bolts is pulled out or there's a fracture or something in the grout line that's causing this motion but it's me wouldn't have been able to diagnose it unless we had this type of visual animation all right introduction to vibration analysis Part 2 we're going to talk about the basics of vibration analysis so amplitude is a how much vibe raishin is present frequency is how often does it occur it's a rate of occurrence so we can pinpoint what's causing that high amplitude in the third really useful parameter is Faith's
and it's a measure of directional relative motion and we'll get into that quite a bit part two we're gonna focus on the Amplitude and amplitudes of severity parameter we can trend displacement velocity or acceleration and we can do any one of those the there is a preferred parameter and we'll talk more on that so the basic idea is in understanding the energy levels and how those levels might impact a machine and then we're going to talk a little bit about transducers recommended severity parameters overall vibration training and analysis and some statistics I want To lead
into ultrasonic data trends and we're going to probably get into that next Tuesday this is a secondary trendy mechanism that the grace transducers have to offer the the first is you're gonna take an overall level you're going to trend that they also have spectrum and waveform capability unto man but also they're putting in one of the transducers in the tri-axial it's going to be a higher frequency transducer and we can play with that filter it and Adjust it so that we can see ultrasonic vibration and what that is is very high frequencies in its early
indication of bearing failure so I think next time I might mix it up a little bit and show you some ultrasonic trends and some technologies out there that might be a benefit for the grace project PDM process this is the overview that we talked about the other day and again I'm gonna be a little redundant and walk through this real quick just so Everybody's up to speed that if you didn't make it on Tuesday little seven step process that from finding the machine of interest to understanding the spectrum yeah first of all the best thing
to do is to know your machine so the Machine I have shown here is a driven over humph an application it's on Isolators and there's a machine based under that that's not much more information but the this is a class of machinery on the right here is the Acceptance levels and alarm levels four three four five six seven different classes of machinery in it there's like 18 different machine types in involved in this what we have is a fan or blower there's integral shaft direct driven and belt driven we have a direct driven version of
that and the icons along the bottom here will show you what all those machines kind of look like in profile this is our fan or blower unit it's telling me that the vibration allowable Level for this machine statistically is 0.3 to 5 inches per second so this is a velocity measurement and we're going to talk more about velocity and displacement in acceleration in a minute but this is the alarm level that would be set in the software system so the machine is taking data every hour every minute what have you and it's constantly comparing the
the data it's just accumulated to the allowable alarm level which is this point three to five this Will change this is just this whole acceptance and alarm criteria is this statistically set but it's across industry your machine's different from every other machine on here and each machine I might have five of these fans all lined together they're all different they're all going to have their own alarm criteria they're all going to have different levels of vibration the nice thing about having these these real-time sensors that are bolted in place or Magnet mounted in place is
that they'll continuously take data and any subtle change from the mean level is going to be recorded and as as a result somebody I mentioned on Tuesday the alarm levels are the mean level plus three sigma so statistically that's three standard deviations above and below the mean curve for the data that it calculates so as it goes in the database calculates a new mean level a new based on old data in the current data in a new statistical Data and your alarm curves get better endeavor so this machine might start out at point three to
five but it might be down 0.2 75 by the time all the statistical analysis is done there's really a lot of great artificial intelligence in the databases that can really make machine learning a good experience so machine of interest is this direct couple of run fan the main point is we have to define what is that alarm level so that we can start this Data collection process and make it meaningful okay this is acquiring the data we acquire the data with a transducer this is just showing a single axis accelerometer and what it looks like
on the inside the grace transducers are a little different they have their working element is on a chip inside the housing enclosure and it's a MEMS transducer mechanical electrical mechanical electro machine anyway system something like that I can never remember What that means you know so anyway it's some type of transducer it's calibrated so this shows 100 millivolts per G that's pretty common accelerometers will put out an acceleration signal it starts out as a voltage we turn it into acceleration by giving it this calibration factor and it's somewhere around 100 millivolts per G so and
it's when you get your transducer it'll give you exactly what that number is the accelerometer measures acceleration okay There's a reason that we take data with accelerometers it's because they're they're cheap and they're very useful what we would like it we don't want acceleration parameter in our measurement we would rather have velocity and I take you back to the last page all these little numbers here these are all velocity values velocities a better severity indicator we can do that two ways we can use a bolometer which are a seismic Velocity transducer but this one's expensive
the seismic ones are mechanical and they fail and they're not nearly as good as an accelerometer with no moving parts so what we do instead of measuring velocity directly we measure with the accelerometer and we mathematically integrate it into velocity probably a little too much noise for most of the people out there you don't really care about that but that's the process so that's why I have My my green bolded accelerometer and and the velocity parameter and we'll talk more about that proximity probes are one of the other transducers I believe that there's a way
to pull those into the database as well if they're already installed on the machine so data is acquired our perfume preferred transducer is an accelerometer our preferred vibration parameter is velocity and we have to remember vibration faults are directional I'm Showing you two transducers one vertical and one horizontal the unbalanced vector is sweeping by and Peaks out as it goes by the red transducer on red curve here and ninety degrees later the blue one is going to peak out so what does this mean they're out of phase by a quarter of a revolution okay so
the heavy spot takes a quarter of a revolution will longer to go by the blue peak and these two directions will have different amplitudes they can have different Frequency content they can have all kinds of differences so if I don't measure the horizontal the vertical in the axial I'm gonna miss something thankfully a lot of transducers in our tri-axial that MEMS accelerometer is also tri-axial so we'll pick up all three directions simultaneously what do we get we get an analog waveform this is voltage versus time until we put in that counter millivolt per G calibration
factor what we're seeing is all the Vibration in the system so let's assume line taking a measurement on the bearing housing here I'm picking up the rotation of the shaft I'm picking up the Caged frequency which is the spacer between all the balls it'll rotate at about 40 percent of shaft speed so this might be 1800 this might be 900 rpm the balls they spin as well so they have another vibration signature so when you look at this it's a complicated time waveform It's the combination of those three different frequencies in there okay kind of
hard to pick out what's what but we'll we'll fix that so shaft rotation rolling element train rotation and a rotation of the whirling elements those are the three components of this so far we can't take in that voltage measurement it's it's analog in its infinite so what that we do before we pull it into our data acquisition system is we have to digitize it so we Sample it we digitize it at a really high rate so that if looking at this it is a bunch of dots but you wouldn't be able to see it because
there's so many dots and they're so close together but this is the way the computer can understand it okay so we'll put in that millivolts 4G number we'll pull it into our data collector we'll sample it and digitize it and then it's ready for the real the real analysis which is the fast Fourier Transform the fast Fourier transform is a fast a computer method for the Fourier series which is a an infinite series they do some tricks in the computer program that makes it quicker so you don't have to wait for infinity we apply this
processing to complex signals and we're assuming the complex signals are some of periodic events in this case it's very periodic so what sinusoidal repeating patterns in there so we have three different periodic effects in here And one is the shaft one is the cage for the bearing and one is the bulb themselves the FFT processor defines those individual periodic events and pulls them out so it strips them away from the complex signal so this low-level wiggle here if you look at all the peaks you can see a low-level wiggle in in the waveform so it's
a it's it's buried in there somewhere there's another peak of the different period length and it's the repeating period the Rotational speed of the shaft this is a higher frequency peak which is probably the ball spin frequency has a shorter period is higher frequency longer period lower frequency so basically what we've done we've taken a time domain signal this complex time waveform we've converted it to the frequency domain and the way we do that is with the Fourier transform but this is the some simplistic way to do it the frequency in Hertz is equal to
one cycle over how Many seconds it took to make that cycle okay so I pick out one cycle I start here I go through a maximum a minimum and back to the original point again if I know how long that was let's say it was half a second one divided by 0.5 is two Hertz okay two cycles per second if I'm a CPM person most cycles per minute type person I can multiply it by 60 and be 120 rpm basically okay so Hertz or the units of cycles per second and the period is in terms
of seconds and the Whole idea is to strip out these components and turn it into a frequency spectrum which is what we're doing here so I have the same periodic events of the top three different periods if I use that frequency as one over the period I can calculate their frequency component f1 is this low frequency period f2 is the green one little higher fruit frequency but that's the period length and the third one is the ball spin frequency which is a shorter wavelength There okay so I've just done the simple calculation and I have
my three frequency what I want to do and what's important identify each peaks frequency so I go in here and put my cursor on it and it'll it'll tell me what that frequency is now those will show up in the next step choose my parameter it's either Hertz or RP M or CPM usually rpm is the reserved for just the rotating speed at the shaft but rpm and CPM are basically the same unit Cycles per minute revolutions per minute same deal which peak is the rotating speed of the shaft that's super important so we go
look on our bearing our drawings whatever we use when we design the machine and we find out what the rotational speed is supposed to be if I go on to the bearing or the motor nameplate I can find that value and it'll be close to what the actual under load speed is but if it's says 1765 rpm it's probably you know a two pole or a Four pole motor that synchronous speed is 1800 but they don't never run right at the synchronous speed so roughly 1800 rpm and that is what the information I need to
know because I'm gonna ratio all the other Pink's to that speed so if that peak is 1760 I'm going to take this frequency and divide it by 1716 to see how these two are related and the same thing same thing between 1 and 2 there how do we judge severity we don't have any alarms on this yet okay right now we Probably have overall alarms on the waveform but assuming that we're in generating the spectrum we have to have something to compare it to the alarms define how much is too much okay frequency band alarms
define where all our frequency ranges will have limits this is a cookie-cutter calculation for making this stair step pattern this pattern is percentages of the overall level so I take point three to five inches per second that's my Overall vibration that I'm trending I can make alarms out of it fractions of that in the frequency domain okay I have to know a little bit of information I want to know how my one time's rpm relates to the other frequencies and I can use my periodic table chart to help me with that but I find out
the rotating speed to 1760 that's f2 I want to find what about what this peak down here is I put my cursor on it it says 739 I divide it by running Speed and now I can see how it relates to running speed its point for 2 times our p.m. so it's 40% of the speed of the shaft and the f2 is 1760 so I I know that that's the running speed so that equates to the 1 times rpm that's a synchronous frequency I go out here put my cursor on f3 it's 802 5 CPM
/ running speed and I get 4.5 6 this is non synchronous it's not an exact harmonic it's not four times running speed or five times or I needs mean it's four Point five six okay if I have a non synchronous piece like this it will be a most likely of bearing defect frequency okay we have four different varying defect frequencies they're all non synchronous so if we're looking for peaks in this range that's likely to be what it is but we we have a way of with the periodic table to add a little structure and
method to it so we can narrow down okay speaking of which this is the periodic Table and we went through a little bit on Tuesday but we're gonna do a quick example it's a different example so even if you missed it it'll be something new design of the machine we're gonna look at things things but false that can't apply there's 35 different faults some of them can't apply because they're not part of the machine design and you know there's no gearbox there's no belt drive for this application so those can come off the table so
I did it all at once Instead of one at a time I have an AC induction motor so DC motor problems go away and fluting goes away I have rolling bearings so there's no no oil world from journal bearings there's no gearbox there's one two three four different gearbox faults those come off the table there's no belt drive there's a belt drive misalignment and a belt frequency they come off the table now it's not a pump it's a fan so Cavitation won't be a problem there's it's not a specialty machine so barring roll barring as
a special modulation type fault so I've dropped a lot of stuff off I think I'm down to twenty three different faults instead of thirty five okay so now I can start my sorting the first sorting mechanism we talked about last Tuesday is the frequency groupie so we look at all the data we collected this is positions one two three and four They're on the bearings the two motor bearings the two fan bearings we're gonna take data in the axial horizontal and vertical direction so if I had one of the gains transducers I put it on
here it would tell me XY and Z or actually a horizontal and vertical at position one and the same thing at all the other positions what do I see when I lay them all out I'm looking for alarm band faults so we've created this little stair step based on the overall level The machine if there's any end of individual peak that crosses that line we want to know about it and there's something going on that we're going to have to investigate for this machine position three in the vertical direction I have a high one x
rpm so turning speed of the shaft is 1760 so that's what pops up it's a little above my alarm level I'm gonna have to take a look at that I also have a position for in the vertical direction that same one x rpm problem But I have a four point five six x reminds me I have a non synchronous frequency in there okay so my the two different frequencies of interest are seventeen sixty and eight zero two five one is synchronous one is non synchronous so I'm going to split those two up I'm going to
first do the analysis on the synchronous frequency do the other so frequency group this peak at running speed is synchronous so it's one of these four or eight nine ten Different things okay we're going to have to have a little more information consider the directional group B so this is radial down here these are my four radial measurements it's on the fan it's at 1 times rpm and the highest peaks in the vertical direction okay so I can get rid of all the yellow tiles on the table that were bent shaft angular misalignment bearings those
don't apply anymore because those are all axial problems so I'm down to five Different problems okay now what do I do I look for the diagnostic that the little tile is telling me to do so in the upper right hand corner there's a phase icon so I have unbalanced has a phase problem diagnostic so there's s interesting mechanical looseness type a in angular offset and the phase analysis we'll talk about a little bit you don't really know need to know how to do it at this point more of an informational guide for you it's structuring
using the Default periodic table so we have a phase test week that applies to four of our faults and we have a transient test that applies to natural frequencies natural frequencies are considered a synchronous ball actually there's considered any type of fault their frequency depends only on mass and stiffness in the system not rotational speed so they can be anywhere in the spectrum and cause a problem so we have to assume that that's a potential Problem do a natural frequency test and make sure either refute it or accept it as the real problem so we
do this we find out which which fault is the problem this one turns out to be mechanical looseness type a it defied all the other phase rules for this so we're down to one fault that fits the bill and we can make our recommendations based on that the other fault you remember we had to we're gonna walk through the same thing So I consider the design of the machine and we get rid of all the gearbox and belt drive and oil film bearings and DC motor problems and so forth so we're down 35 down to
I think 23 faults same as before now we're just looking in a different frequency it's just 8025 is we take the heat thousand twenty-five divided by seventeen sixty we get four point five six so we know it's non synchronous we know it is on the fan bearing and we know it's in the vertical Direction okay so frequency group non synchronous some of them we've gotten rid of already there's a couple more we can get rid of pull pass frequency it has an electrical response that isn't in our spectrum should be at 7200 so that one
doesn't apply electrical line frequency same thing we should see some type of two times line frequency in there we don't see it so we get rid of both of those turbulent flow is usually some Synchronous and it looks like a haystack not a defined peak very natural frequency is usually a much higher frequency with side bands and the Caged frequency is sub synchronous okay so if we get rid of those we're left with these four potential problems one like always is the natural frequency problem the other three are the outer race defect the ball spin
in the inner race defect on the rolling element bearing in position four on our fan so what do we Do we we look at four directional type help look in there nothing happened so it looks like it's probably are all a radial problem but you know we still have to check out the natural frequency for sure okay so we diagnostic test inside each of these icons is the the test that's recommended and ultrasonic analysis so we pull an ultrasonic spectrum and look for impacting in the high frequency spectrum and then we also do a transient
natural frequency test so There's our Diagnostics and as it turns out in this case we found that it was an inner race bearing defect okay these three will have three specific frequencies that we'll be looking for if we know the bearing make make model and type vendor we can determine what all these frequencies are so two of them didn't pan out this is the one that fits the fits the mold so it had a very effect and it had a mechanical looseness type a problem So the looseness in that bearing was likely what starts the
jackhammer effect and it shows up on the bearing as the bearing starts to fail okay all right now the new stuff we're gonna talk about time the amplitude frequency and phase the key things are amplitude frequency and phase there's the biggest diagnostic tools the amplitude is a severity indicator so it's how much okay Here I am inside the icon there's mils and there's inches per second there geez so This is displacement in thousandths of an inch this is inches per second it's velocity this is acceleration and in G's okay so this is our first wave
this is how our online transducers work they'll be collecting data and collecting data and doing analysis until an alarm is exceeded so it's our first wave that something has changed and something's impending failure and we're going to have to figure out what it is before it fails frequency There's Hertz which is cycles per second there's orders would be one times two times three times four or five orders of shaft rotation so it's just normalized frequency and CPM and rpm are cycles per minute revolutions per minute frequency is how often the fault occurred you know if
we go from the time wave form to the frequency domain it's going to show up as a peak in our spectrum and that peak is also going to be alarm criteria probably as an overall level And as a spectrum band alarm will get a little bit more into that as we go the last thing is phase analysis so phase is motion and direction it's showing us how the Machine is movie and what we're really interested in is usually across couplings if we have a coupling misalignment in the radial direction will show that radial 180 degrees
out of phase response kind of like that first animation I showed on the second slide of this presentation we also look across The machine for bent shafts we look on the bearings for cocked bearings so there's there's several things that we can use phase for the what makes it incredibly useful is there's about 12 different problems that all have the same frequency signature they show an elevated one times rpm response so basically everything if you're looking at the table everything that's a synchronous problem in the first two columns of the table plus natural Frequencies that
can be what we're looking for we're trying to distinguish all those things in phase analysis that allows us to do that and we'll show you how that happens okay Oh in time timing waveform that's the basic signal that's where everything starts and when we talk about time a little bit it includes all the amplitude all the frequencies and all the phase information in in one will package unfortunately you know it's real simple to look at when you're looking at One frequency and one wiggle in the shaft but they get awful complicated so when we go
from the the time domain to the frequency domain it's it's really the way vibration analysis should be done there's only a couple of problems where we need the time waveform directly to make a diagnosis the rest of it is in the frequency domain the overall amplitudes very trendabl so here we've shown horizontal vertical and axial assuming this is a track steel Transducer they're all sampled simultaneously and will have three different amplitude trends if we need to do an FFT analysis it looks for the periodic events and calculates the frequencies okay so in this case they're
all rotational speed probably an unbalanced type problem okay they also have phase now the time wave form phase it's a shift indicating a directional motion to have this shift we need two different time wave forms to compare so If we're on the same bearing we might go from a bearing 1/2 bearing to in the vertical direction and if they're both moving the same way then they'll lay on top of each other like this so one might be higher than the other but we have basically a zero degrees phase shift if they're moving together if I
have a horizontal and a vertical vibration in one knee on the same bearing we're looking for an unbalanced effect remember we did that show that animation And we have the red one going past the transducer and then a quarter of a revolution later the blue one goes past the transducer that's a 90 degree phase shift so we can look directly in our time waveforms and and see that shift if they're clean enough obviously there's other methods we can use a laser tach and compare the heavy spot in the shaft to the laser tap location and
see what that is as well there's a couple different things we'll look at a little Bit later on in the presentation so zero degrees 90 degrees this is a hundred and eighty degrees so they're moving completely out of phase so this would be across across the coupling basically this is a misaligned coupling because one half is moving one direction and the other half so moving the other way they're always fighting each other okay all of these occur at one times rpm or the ten we can occur at one times rpm so unless You have phase
you wouldn't be able to decipher the difference between them and that's why we use it so pretty important okay we're gonna talk about amplitude first amplitude is how much it's severity it's where we start off so the first thing we're gonna do when we have one of these transducers installed and I'm just showing one direction here so that really you're getting XY and Z and you'll get free trends is just the time waveform we'll pull that out we have Some algorithm inside the logic of the transducer that stores the highest amplitude and that's what we
see in our trends we use this amplitude to set new alarm levels so this might be an alarm level based on my chart of rules of thumb 0.35 inches per second when it runs down here somewhere I don't want to use 0.35 inches per second if I'm running at 0.1 all the time I want to know how big and how fast it changes from point 1 to 0.15 or 0.1 to 0.25 this Type of alarm on there too highly set I might miss something like that so that's the greatest thing about doing these transducers to
stay in one place all the time and they're constantly taking data there's no human interaction that to bother them they get fantastic trends this would be like January February March April all that for route based measurements you get 12 measurements a year if I took a measurement every day I'd get 365 Measurements with the in place wireless transducers if I took it every hour I'd have almost 8800 measurements every minute three hundred three hundred fifty thousand something like that something ridiculous like that there is data overload but you're going to get fantastic trends in this
you'll be able to see real subtle changes that are from plant processes instead of you know just motion from month-to-month taking the transducer on and off things like That okay great twins so amplitude wise that's what we're doing what can these amplitudes be they can be displacement and mils typically or microns there's velocity and inches per second and acceleration and G's those are the units that we prefer right three different types of measurements this is the one that's preferred the velocity and we'll tell you why you know in a few minutes here all right here's
my alarm for my machine of interest 0.325 I don't Want to wait this long for this thing to creep up to failure I want to see it right here maybe where something has changed and I don't know what that is so we can pick up subtle changes like I mentioned with the online systems much faster vibration parameters themselves we just mentioned that we can take displacement velocity or acceleration as our parameter of interest and which one is best well maybe we've got to tell you what They what they do first the displacement as a measure
is usually measured with proximity probes directly on the shaft proximity probes are usually designed for oil film bearings where there's no rolling elements and what they'll do the shaft rides on an oil wedge as it rotates so what the probes are for they are inserted through the bearing housing and they come really close with him about 50 mils of the shaft 30 to 50 mils and they have a magnetic flux that Changes with shaft motion so they're able to detect thousandths of an inch really tiny measurements tens of thousands and it's real detailed you can't
get that on the housing of a journal bearing all the vibrations in the shaft and it has to go through the oil wedge and then the bearing housing and the housings are pretty big and it gets muted out by the time it gets to a an accelerometer on the housing so it's really good if you have journal bearings To use displacement with your proximity probes we use velocity pretty much you can for all vibration measurements on rotating equipment you can measure directly with a bolometer or something called a seismic velocity transducer but that isn't the
easiest method the flow meters are expensive the seismic transducers are mechanical so they can fail the easiest thing to do is integrate that signal mathematically from an accelerometer so actually we're Taking an acceleration measurement and we're mathematically turning it into velocity there's very few drawbacks to doing that except extreme low speed rotating machines so that's the standard method accelerations measured directly from an accelerometer transducer there's a few good reasons to use acceleration one of which is high speed gearboxes if you have centrifugal compressors they have lots of teeth on their high-speed shafts and you can
get Really high gear mesh frequency and that's one of the limitations of velocity you don't see those gear mesh frequencies nearly as well and manufacturing usually quotes their alarm levels in acceleration okay we're going to talk first about amplitude displacement and this is a little complicated but it makes a lot of sense once you see how it goes and it's a real simple explanation but it's there's a little story to it failure modes from Vibration they come in two methods one is overload which is low cycle fatigue and once is repetitive loading which is high
cycle fatigue low spike low cycle fatigue can usually be designed out but there's something that's changed recently in the power industry they're not using main coal power plants anymore as base load they're using a lot of them as peaker plants and you have all these really big pieces of equipment a lot of force draft and induced draft fans and They're not made to start and stop you you start them and two years later you turn them off at the average but now they're starting and stopping every day you get a lot of low cycle fatigue
from that big torque in that changing temperature really quick so the overload capacity these things really shoot to a high level when you turn them on there's no soft start they were never designed for that and you start to get a low cycle fatigue Problems and then you have to start limiting how many times you can do that as a day or a shift before you're going to cause real big problems repetitive loading we're we get high cycle fatigue we want to stay under that limit so that the lasts forever and on our chart this
is called an SN chart which is stress in cycle diagram you can see there's a low cycle fatigue line there's something called an endurance limit which is where we want to be because if we're on this Side of the endurance limit and we're low enough underneath this curve will have infinite life okay we're pretty close to that so stress reversals on a log scale so this is cycles and this is amplitude we want to be under this curve okay and this is cycle limited frequency limited this is not once you get any amplitudes below that
so there's a level of dynamic stress that can be tolerated forever and that's beyond underneath the endurance limit and that's what we're Rooting for here I've did a little fun exercise and it makes makes a lot of sense so what I'm trying to say is displacement amplitude is a function of frequency and I'm going to show you that it actually is here's just a paper clip okay we we canna bend it to extreme amplitudes without immediate failure however if we apply the loading multiple times the clip will break after a small number of applications this
is over load or low cycle fatigue due to a dynamic Loading okay I take paper clip number one two three four five six I have four before it fails four five six six eight so an average of five and a half cycles to fail if I open this up 180 degrees and bring it back open it up bring it back doesn't take very long to fail now if I open it up to ninety degrees I get 16 17 18 you know up to 23 cycles so it averages 19 and a half cycles before it fails
third one I go 45 degrees and I Even get bigger numbers of cycles so on average about 70 cycles to failure so cycles or frequencies of stress or reversals five and a half nineteen and a half seventy my amplitudes are going down and then cyclic life is going up okay so displacement which that's all this is I'm bending it a certain flexing it 180 degrees I get a limited lifetime so I only can only do that five and a half times and then it's going to fail so This is my failure line that in my
displacement failure line and if I'm if I'm a big fan in a power plant and my vibe guy comes to me and says I have so many Mills of vibration I can't do anything with that he has to tell me what frequency he's talking about so I so I can gauge what that amplitude is and what it means if I have five mils of vibration that's okay here you know but it's not here I'm not going to get seventy cycles out Of that it's limited right there right now the endurance limit is about a million
cycles so in in mechanical engineering if you design something to have a cyclic life below a certain threshold it'll last forever and that forever number is ten to the six or a million cycles so it'd be a million revolutions of a shaft okay and the lower you go the more cyclic life you have okay I have a large adduced fan in my power Plant the vibration the analyst says the bearing vibration amplitude is 5 mils or 5 thousandths of an inch is this amplitude acceptable can I even answer I need a different additional piece of
information we just learned that displacement vibration is a function of frequency I need to know what the rotational frequency of the fan is then I can I can tell them my answer now part of this answer is the rotation frequency the other part is my starting point my Velocity and velocity in inches per second for this type of fan that we have in the powerplant 0.325 inches per second so I need to calculate how much displacement is equal to point three to five inches per second if I stay under this velocity value I'm going to
have infinite life it'll be below my endurance limit if I go to a point five inches per second I'm above my cyclic limit and it'll fail right so I want to know is five mils above or below this This limit in velocity okay there's a way to do it with an equation I don't expect anybody to do this but this is the relationship that you got to start thinking in your head the overall alarm for this class of equipment is 0.32 v that's philosophy if the measure vibration is five mils of displacement and we have
rotational speed of 1790 we can calculate the allowable displacement okay and I don't want to do this so I would say hey go back and take a Velocity measurement so I don't have to do this every time and now we can use this point three to five inches per second but there are cases where people do this so we found out that there's three point four seven mils is equal to 0.32 five inches per second so this is the equal displacement or 0.32 five inches per second so the machine is not acceptable we're running at
five mils were way above this okay and we're on the bad side of that Allowable curve now if he said we have emails of vibration I'd have to go back in with the same information and calculate what is the allowable displacement limit based on the velocity for eight mils and find out if that's good or bad and it's gonna be bad again okay now this is a roundabout way I just wanted to tell get it through your head this is variable so the displacement amount isn't enough you have to tell me what frequency we're talking
about so That I know where I am along this curve and what's allowable so that's kind of tedious if I use velocity instead and my velocity is 0.3 inches per second the stress due to that velocity is going to give me infinite life if the stress is above roughly 0.3 will have finite life and I say point three because if you look at all the alarm values and the acceptable curves and so forth point three is like rating them so here's my criteria now now why why is this Important this flat part of the curve
is velocity it's an energy level it's not related to frequency in it's flat so if my frequency is 1800 rpm I have to worry about 0.3 inches per second if my frequency is 5,400 rpm same thing I look at just a threshold level it makes it so much simpler so you know it's easy it's easy to do you don't want to be calculating a an allowable displacement for every number that comes through you just go with the velocity kinetic energy Related I'll arm value and it's you get great results and they've been doing this for
a long time so I like sorry about the long roundabout way of explaining this but that's what people still don't quite get in their heads when they quote the displacement values you have to know what frequency to see where you are and how many what amplitude you can tolerate okay now acceleration has the same type of problem there's an acceleration or an Inertial force generated will increase what speed and will be a function of frequency the centrifugal force the unbalanced force there's a mass offset and there's a radius offset of that mass and there's rpm
in here and it's rpm squared actually so it's it's even a little more nonlinear but this is the path that follows it it opposes the displacement path that we talked about earlier they almost meet in the middle it's a little off and I'll show you that In a sec but this is the trend so if I'm quoting things in acceleration let's say I have 12 G's is that good or bad I have to go you have to tell me what frequency we're talking about I have to calculate an equivalent velocity level and see if that's
good or bad so it's tedious so you can't use so you really don't want to use acceleration and you don't want to use displacement unless you're you know proximity probe where you're measuring it directly you Want to use philosophy it's great over a broad range of frequencies in it's a very simple alarm criteria here's what's called the contour of equal severity this is the velocity measurement so I have it from 2 Hertz up to 10,000 Hertz it's pretty flat all the way across there these are the equivalent displacement for this value of vibration so if
this is 0.3 inches per second at 10 Hertz the equivalent displacement limit is 10 mils okay the equivalent Velocity limit but at that 10 Hertz is 0.07 G's so okay point O seven G's doesn't mean anything to me 10 mils doesn't mean anything to me unless I know for sure what the frequency is it's so much easier just to use the velocity and as a across the board it's a very severe okay so reinforcing the point this is the best alarm parameter is velocity due to its flat response and it's independence of frequency and when
we're Looking at the amplitudes here's the something I brought up on Tuesday I'll do a little more of this next Tuesday but this is some sampling and some statistics on just four days of data from a power plant so this was a big vertical pump I have a bunch of statistics in here working on this but I'm looking for an alarm criteria and what I have is a value that's changing that the more data I get as I'm taking data I'm adding to my statistical Population and once I get out here four days later my
alarms of criteria has gone down here and it's squeezed in there and by the way I do want to have alarms in both directions these alarms are set by a mean plus 3 Sigma distribution so the mean value the average value plus or minus 3 standard deviations and that's what gives me these these curves on either side the top one I obviously I want to know if vibration goes up I want to be able to Detect that but also I want to detect a vibration goes down if I go from 0.175 inches per second and
I dropped down to 0.1 something something changed something happened it might not be good you know usually a low vibration is good but maybe it's still the Machine turned off it shut down for some reason and now I I'm not taking any data it's flat and sometimes it happens and you'll run the Machine or you'll have non operating machine and you won't know it until Something else tells you okay oh the other thing we can trim more than one per M okay I mentioned earlier the the grace nodes they have a tri-axial MEMS accelerometer in
them two of those axes the x and y directions I believe the frequency ranges of thousand Hertz the third direction they're starting to change out those and make that I think an 8,000 and 9,000 CPM Hertz signal so they're gonna have better capability in the transducers They currently have they're gonna be able to monitor the x y&z low frequency range plus they can do some some sampling and bandwidth filtering to be able to get the really high frequency usefulness out of them so 5 kilohertz up to 8 kilohertz or whatever the limit is on these
so that's a nice nice development way to go this is the severity chart the amplitude parameter severity bearing health for rolling element bearing machines oh man I'm um I Didn't get through nearly as much as I wanted to today so this is very parameters we already talked a little bit about the walkthrough I just noticed it's almost 11 o'clock I will try to fill in just a minute amplitude parameters there's severity here this is another suggestion there's different frequencies that are bound to show up based on the design of the machine so there's one x
rpm there's blade pass frequency there's gear mesh Frequency you're popping up a packet of overall energy information from this chart basically every second every time you collect data off your machine and it comes up as a kilobyte package or whatever into the cloud there is a way you can probably do that with each frequency you're interested in so this is one two and three times harmonics there's sub-synchronous there's bleed past if you know what the bearing is you can put those values in and upload just That type frequency band instead of the whole spectrum I
believe the spectrum is calculated originally and then if you just filter off different sections you can get all kinds of statistical information on discrete frequencies in the spectrum good morning my name is Danny am Bray this is the third installment of three different setups on webinar for great engineering products introduction to vibration analysis and thank you for Joining us I see there's well over 300 people that are already on the line thanks for coming back this is the third installment so if there's something that you see in this one I might brush pass it a
little bit faster on one of my reviews you can go back to that first seminar in last Tuesday and see a really good overview of everything I just hate to be redundant on every six 8016 webinar or at least I feel I'm redundant and I'd rather get into a little more Information but and also if he please the recognize that this is normally a two-day class so I'm taking 16 hours and turning it into three so there's a lot that you will miss I mean this is just a brief overview of everything just to get
you oriented to vibration you might might be able to answer a question or two from your from your vendors or your sales people but you won't obviously won't know everything about vibration I've been doing this for 30 years and I Still sees things monthly that surprised me but anyway full spectrum Diagnostics we do training and certification live training asnt and ISO based guidelines we also have a lot of interactive stuff so I've been doing these webinars short courses and then I also have an online learning management system software that takes subscriptions for on your own
learning learn on your own time basically and they're used as troubleshooting or as formal teaching it Doesn't either way the way you see on the screen is the vibration fault periodic table will touch on various aspects of it today it is the backbone it's the framework structure for learning vibration I believe but also doing analysis where you can walk through and slowly eliminate problems by free see content bi-directional response and then zero in on the root cause okay we also have a machinery analysis Division we specialize in some high-end machinery animation analysis called experimental modal
analysis which is frequency analysis for natural frequencies we also have operating deflection shape analysis of machinery in the end product of it is something that can be usable and understandable by anybody and the unit you're looking to hear looking at right now on this side there's a steam turbine there's a gearbox with couplings on both sides and You're coupled up to a generator and this was one of the actual problems that we saw there probably three four hundred measurements here physical measurements we had to put down but you can see right away there's thrusting across
this coupling there's nothing on this side this coupling is running beautifully but we receiving this coupling and we're pitching the generator a little bit so there's a couple of problems that we can see right away and you might not know Anything about vibration but it makes total sense to see the motion and this is phase analysis kind of face on steroids and we'll get a little bit more into phase analysis in this section today the third little division we have is any scope OTS video so instead of taking physical measurements we take a high-speed video
the clip this processed that we enhance the displacements and rescale the amplitudes and you can see what can't be seen visual so there's Something like 1.3 million pixels in each one of these images potentially we could use all those pixels we only use about 10% right now to get a incredible view of what's actually going on so today's analysis or instruction introduction to vibration analysis part three is going to have a quick overview the PDM process we're going to have a look at the vibration fault periodic table and do an overview of that so it's
described as a logical sorting Mechanism providing and now this framework in methodology and the whole idea is to eliminate false until you get down to the root cause we're going to look at base and basic vibration analysis that we started last time and we ended up had to cut it a little short we are in the amplitude phase of it and we're going to look at frequency and phase analysis today and then the last section is ultrasonic vibration analysis and trending this is How rolling element bearings for you up to now we've been talking about
basically trending the overall energy of the machine from the grace transducers sitting on top of the machine and we're not really picking up a frequency analysis we're going to talk about frequency analysis we can do that on demand if we wish it's just a power consumption issue so we don't do it all the time but we're trending the overall level okay The ultrasonic vibration analysis is another measurement it's a high frequency filtered measurement and this is how rolling on that bearings fail if you have other problems like looseness misalignment bent shaft various things like that
they'll fail at tourney's feet of the shaft so they have a particular frequency group that you're dealing with the ultrasonics they'll fail at a frequency hundreds of times higher out in the ultrasonic range so we're going To look at briefly at what that ultrasonic vibration is and how we can use it to trend the output of the grace transducer okay the overview the very basics we have the machine of interest so we're going to choose a machine and knowing the machines important when you're setting up your database because each machine has a different allowable vibration
level based on by design okay they're not all the same we're gonna put our transducer on it this is a Calibrated transducer you see something like a hundred millivolts per gene that's typical that will give us a value that means something so the analog voltage output is voltage versus time when we put this calibration factor in we get acceleration versus time it's millivolts per G so we get acceleration as our amplitude times our axis and we have a usable signal well not quite the analog signal is infinite okay it's It goes on and on we
can't process something like this it would take us forever instead we digitize it and sample it at a very high rate so we can see all the dots here and the dots are so close together they look like lines when you're done so you basically turning this into a bunch of dots that are equally spaced so you don't lose any and the important information you're after I think yeah so it mimics the signal and it sets it up for doing the FFT process the FFT processor fast Fourier transform strips out all the individual periodic events
out of the complicated signal so we have this complicated time waveform with lots of Wiggles in it each one of those Wiggles corresponds to something it's if you overlay them all there the periodic all the periodic events inside that trace the FFT processor finds the subtle low-frequency period it finds the More dominant second period in here and then there's a third higher frequency period involved okay not real important how it doesn't specifically but that's the the easy thing so I can use a very simple mathematical equation frequency equals 1 divided by the period if I
know this period length and it took half a second or something to do that 1 divided by 0.5 is 2 hurtless 2 cycles per second ok so I have a frequency I can do the same for all these if I know how long This periodic event was I can calculate the frequency it generates so now I go from the time wave for a time domain to a frequency domain okay the only thing left out is how much is too much F - looks like it's the biggest peak but we don't know exactly what f2 is
we go in here and we look at our machine we get a strobe light out and get a laser we do something we find out what speeding machinists now we find out the speed is 1760 so f2 is my running speed My turning speed of the shaft f1 is something below running speed and f3 is some frequency we haven't determined yet if I know where one times rpm is I can make my stair-step path and this we talked about a little bit I think last Thursday this stair step pattern is giving me alarms on each
frequency band okay so I have a whole series of alarms now we'll get a little more into that so we're answering the question how much is too much so if any one of these bands Produces an amplitude that's above our limit like this one or this one we can go in and do some analysis and figure out what's causing that how we can deal with it the vibration fault periodic table it's a structure and method it's a sorting mechanism it has different three different steps basically first is we're going to sort the vibration by frequency
content so there's synchronous harmonic sub synchronous non synchronous and Modulation these are all the columns on the tables the second part of this it's organized by a directional response these are the colors the yellow the red and orange and after we're done sorting those two times we organize our faults by diagnostic so we have five different Diagnostics we can do just to sort out what's what so in this case if I think it's in fate or synchronous column I have a bunch of phase Diagnostics I would do okay to see which one of these Faults
is the is the culprit if it's in over here in a non synchronous range I might use an ultrasonic or a transient or an oil orbit analysis to figure out the problem okay so we're all working our way toward the root cause the various components synchronous is one x rpm our turning speed of the shaft okay rotating speed of the motor and pump and what happened okay that's 1 times our P.m. everything in these two columns produces a 1 times rpm they're very similar ok this is the only one little oddball this is going to
appear everywhere the natural frequency is not a it's a frequency based on mass and stiffness so it's not based on some blades or gears or anything like that it is all mass and stiffness we have to disprove that you know concur it can occur anywhere it's non synchronous but it can be close to Running speed and still amplify so we have to prove down the road here if this is a problem or if it's a phase problem in the third part of the analysis so the first two columns are synchronous turns being of the shell
there is a little bit of overlap but the three columns columns 2 3 & 4 are harmonics so there are exact multiples of running speed and the easiest way to understand this is if I have 53 teeth on my dear I'm going to get 53 times earnings beat exactly 53 Maybe every tooth that engages I get a little bit of a pulse so every revolution of the shaft I get a pulse per tooth so 53 teeth if I have a pump with five blades I'm going to get exactly five times running speed and it's a
pulsation and pumps and fans and compressors when a fluid is compressed past an obstruction so in a pump it's a cut water you'll get a you'll squeeze that fluid whatever it is and it'll pulse as each blade goes by that cut one I guess might as well use the last one too in electric motors AC induction motors that you have rotor bars and they're part of the design of the motor but they switch back and forth from positive to negative polarity so it's important to know if here that sequence is working properly you'll have it
an exact number of rotor bars so it will be 48 rotor bars and you'll see a 48 times earnings beat pulsation Okay so synchronous harmonic my next grouping is sub synchronous and it's less than shaft turning speed so below running speed of the shaft non-synchronous vaults are basically anti harmonic faults they're not equal to multiple so she have speed they might be five point one two they're not five times earnings mean they're not six times your running speed they're actually a fraction five point one two five let's say times running speed okay They're easy to
recognize in the spectrum when you compare them to the turning speed of the shaft the last is modulation type faults that it's a pulsing combination so the beat frequency or something that generates side bands in the spectrum we have several examples of that coming up so we'll cover that pretty well okay so there is the vibration fault periodic table we do a sort by frequency we do a sort by or directional response in this Case that's the colors and I'll show you that right now if you see the radial response in your machine then that's
the red blocks okay that means that axial is in a dominant direction we can eliminate it if you see axial is a dominant response all the radial ones go away okay if you see orange or if you have a radial or axial response it'll be an orange fault on the block these are usually by design so a good example of that is a gear box in The gear design if it's a spur gear it's more radial if it's herringbone there's that they'll be an axial component so the overall vibration could be either one of those
okay in lastly we have the Diagnostics the phase time Lia form orbits transients and ultrasonics and we these are inside each box so let's say I have a synchronous fault its radial directed my dominant direction I'm gonna have these four blocks and they all have a phase icon in there so there's a phase Test that I can do for each to prove or disprove each one of those okay and that's how the diagnostic works so to thority mechanisms frequency group and directional response and then the icons themselves are telling us what to do next and
how to narrow it down thinking like a vibration analyst this is kind of how the process works and it's evolving okay all this wireless transducers and cloud data and AI systems there's gonna be a little bit Of time before it's perfect but this is the kind of the stretch we're looking for okay we're acquiring data we're doing overall trends we're doing time waveforms in spectrum at selected positions on the machine minimum we want to have a greased transducer there triaxial we'll put one on motor out or motor inboard pump inboard pump outboard okay basically at
every Barry you want an XY and Z response so what you'll get is twelve measurements the top block Here are the overall levels and that's primarily what we're sensing we're looking for overall levels we're checking for changes something to go and alarm and once that happens let's say we're the there is where the block here and we get into the alarm range then we're on demand gonna say hey we need to capture a time waveform we need to capture a spectrum we need to review that see if there's any alarms in that spectrum okay we
can also pull implant Process may have parameters pump curves fan curves that might be something that we can pick out that's useful in there where we're operating on the curve when something like this happens you get a high vibration so it might just be an operational problem the best efficiency point is right there where you'd have minimum vibration you stray away from that on a pump and you'll either capitate or recirculate and the vibration levels will go up so if we can Integrate those plant processes it's fantastic this one is something that grace is working
on this is phase analysis so we can look on the same transducer from X Y and Z's to see what the dominant response and the phase response is but the real power and that is having the transducer talk to themselves so I have four different transducers there's a way that we're working on to sync all the clocks So that they all capture data exactly simultaneously and we give good phase measurement if that turns out we can animate something like that and get a you know a rough animation but something that's going to tell us how
the machines moving and that's part of the this process to help us figure the underlying faults determine potential faults update the rule base you know here I show that there's an alignment issue a looseness issue and a blade passing issue so those Are things that might not be an alarm yet but there are things we can't rent so instead of just training overall vibration we might be able to trim the phase response which is how how the machines moving when did it start how bad is it getting and so forth so we have a degree
of analysis there then we acquire data all over again so if we do this process over and over every hour every minute what have you will get incredible trends that we can then use To our benefit and extend the life of the machines okay from the last Thursday we did some looking into the real basics the time and amplitude frequency and phase and they're all interrelated in many ways the time waveform signal is the basic signal that we get it's the first thing coming out of the transducer and we can turn it into a spectrum
but most of the time we're extracting a peak value out of it and passing that value on okay so We're going to get an amplitude out of it we can trend that velocity signal coming out but we can also trend we'll find out in a few minutes the ultrasonic end of that as well so the time we're going to look at a second here amplitude is in different units mils and inches per second or G's the dominant response parameter that we want to look at is velocity in inches per second frequency that's up to you
how you like to look at your data usually people it's either Hertz cp/m so cycles per minute or cycles per second you can also normalize your data and look at it in orders if you wish the amplitude is how much is the severity parameter frequency is how often so it gives us a look at what the source of that response that amplitude change is when you go into the frequency domain and the last is fades in phase tells us motion and direction and there's a seven different phase rules so that we can Apply to understand
how the machines movie and they're all independent of each other so one of them might say of that chat the other might say a bearing okay and very interesting technology and NS visual so everybody can understand once a phase analysis is done so we'll get into that time waveform the basic signal first analysis parameter time waveform includes all amplitude and frequency and and phase Sora we'll get there in a second the Overall amplitude is very trendabl so what we're seeing here is the output of a tri-axial accelerometer so we have horizontal vertical and axial simultaneously
the interesting feature is far as what we're concerned with right now is tracking the the amplitude so I have an amplitude in in horizontal amplitude vertical amplitude axial amplitude and I'll have three different trend lines that I can run statistics on I can also calculate the frequency okay And when we get to that in a second but the frequency won't be a parameter that we're interested in until there's some amplitude excursion telling us that there's a problem then on demand or or by default we can calculate the frequency content of the of the signals coming
out of this and get a little deeper in depth okay but right now it's just the amplitudes training gives us a really good idea and XY and Z and all in the bearings is the best possible way to Go there is phase information and like I mentioned you can do this manually or you can do it eventually if we can sync all that and transfer users and the best idea of phase is looking across the coupling so let's say I'm looking across the coupling there's been an amplitude change we go and look at the two
different grace transducers they're talking to each other and we note that the fae they're in phase with each other okay their time waveforms lay On top of each other they're not shifted all right that would say that the couplings in phase and it must be something else or not misaligned if we see something like this we see a 180-degree phase shift our tabs are completely out of phase with each other and if we look at the time waveform the waveforms are at 180 degrees out of phase all right so that's saying yes we might have
a coupling misalignment the third one is what we see in an Unbalanced condition whether it's residual unbalance or it's a faulty unbalance we're going to see a 90 degree phase shift between fertile vertical and horizontal okay that 90 degree phase shift is the transducer or the heavy spot has to go 90 degrees further from horizontal to vertical to be crossing the transducer so now we see this this out of phase time shift those are the three important frequencies where the phase definitions that we're looking at Either it's in phase it's a 90 degree shift or
it's out of phase that's going to allow us to distinguish about eight different faults amplitude wise how much we talked briefly about this last Thursday I'm logging the amplitude so I got one little leader here and I'm waiting for it to go into alarm okay what is this alarm level it's based on the machine so I have a center hung direct coupled fan or blower system my alarm levels going to be point three to Five inches per second so here we're using velocity that's where my alarm line is okay and we'll start trending once we
know the Machine we know what rough estimate what the alarm levels are going to be now these are much more meaningful now this is just January through December this wouldn't be a route like measurement walk-around routes you take your data every month you're logging into the database and you get something Sparse like this if you're using a wireless transducer you can command it to do it once a day you can take data once an hour what have you so let's say we're taking it once an hour and in a month that's a lot of data
points you can see two different trends here you can see a flat response going through here and then you see a jump and then maybe another trend like this so two different slopes but you see a jump right here this is for a month a month That could just be slight miss placement of the transducer before you take your data or many other things but if you're a transducer that's magnetically mounted to the machine and staying put all the time you don't have any of that manipulation this might be actually some type of fault that
popped up that's very subtle that we'll be able to get when we start filling in these dots with more data so even though we're not getting a lot of frequency information or any Frequency information until we do a spectrum the amplitudes got a lot of stories to tell so we'll worry about that a little bit we can take our data and set our alarms or whatever in displacement in velocity or an acceleration the next couple examples are going to explain why we're going to use velocity velocity is a very flat severity parameter and it goes
across a really big frequency range okay my pay per click example about displacement Last time this is a s SN curve which is a stress versus cycles failure curve that's used in metallurgy and mechanical engineering was of interest to us because we can have low cycle failures where we get large displacements but very low number of cycles and we can have pipes hice cycle fatigue failures where they have extremely long lifetimes and it all depends on the amplitude if we're doing displacement amplitude it's a function Of frequency and I can prove that with my paperclip
example I'll do 180 degrees of displacement and I'll go back and forth until I fail that paperclip and it's about five and a half cycles okay so I did it six times for each one of these so five and half cycles is failure for a displacement of 180 degrees so I plot that on my line okay I don't know what the exact value is I need a strain gauge but do the same thing at ninety degree Bend it takes much higher cycles To fail so over three times longer it lasts but it's allowable as a
little lower okay nineteen point five cycles my amplitude of displacement was half of what was over here and the third example is I have a 45 degree Bend and I'd been that back and forth 45 degrees and I get about 70 cycles this is telling me my displacement amplitude as a function of frequency function of number of cycles Okay so if I'm asked is five mils an acceptable vibration level an acceptable displacement level I I can't tell you what that answer is I would have to know what frequency we're talking about so I can actually
calculate where that Falls that five mil Falls with respect to this allowable curve it may be a little better example is a low frequency limitations of overshoot when you turn on an electric motor unless you have a soft start on it it'll pulse pretty good You'll get a good overshoot where I mean you've gone beyond the limit that you want to go the tolerance limits it'll settle back down and run nice most fossil plants have base load capability and that's what they're designed for a base load mean the tournament and you won't turn that thing
off for six months to a year okay unless there's some type of problem that you have to fix people design for that so for a base load plant you might say Well we can plan on having one start and stop cycle every month so for twenty years that's two hundred and forty cycles and I can plot that on my LC off curve so I can say there's my max I don't want to run anywhere above that well now these plants are starting to uses pker units so natural gas plants are taking more of a base
load capability they're turning on and off fans in fossil plants to adjust for load what does that do we still have every Time we start or stop and still have the same amplitude we're not following that allowable curve anymore so we have four times as much as many starts so 960 starts so instead of twenty one twenty years of life we'll get five years of life if we do that every day we get a ridiculous amount it starts and stop 7300 that's about seven to eight months of operating all right so that we're we haven't
started seeing it yet but the pker type on/off stuff is going to be a Big fatigue factor for big AC induction motors okay and we can see how displacement amplitude is a function of frequency with this example as well okay velocity the velocity parameters analogous to kinetic energy makes it relatively independent of frequency response so if i suggest a an alarm level of velocity it's basically based on what i choose for my piece of equipment so if i have a horizontal pump my value is point two nine inches per Second so if I operate below
point two nine inches per second I'll have infinite life okay doesn't matter what frequency it's flat across the frequency range there's no slope to that line if I operate above 0.3 inches per sec above 0.29 I'm gonna have finite life I have eventually it's going to fail so that's my alarm level I can stay lower than that I'll have better outcomes of my machinery okay The last parameter is acceleration in its inertial force so it's a centrifugal force that's generated from an unbalanced shell there's an equation for that and we don't need to know how
this works but it's the mass offset what radius is that offset times rpm divided by a thousand squared rpm is in there meaning that it's changing the speed actually it's changing what's being squared but you get a curve that looks like this now this is the displacement Curve going this way this is the acceleration curve going that way okay so the same sort of deal is 1g bad 1g it'd be horrendous over here but up here you wouldn't even feel it so there it's acceleration as a function of speed as well or a function of
frequency which brings me that this chart that kind of sums it up this is what's called a contours of equal severity chart and we show velocity we show relative displacement to that velocity and we Show relative acceleration to that velocity we can choose any parameter we want but when it all comes down to it if I have a point that's right there that's 10 mils I have to know what frequency it is and if it's at 10 Hertz then I can calculate an equivalent velocity and see if I'm above or below that line okay there's
no curve to it be tables worth of data to be able to do it for any amplitude level so all you have to really remember is velocities flat There's no slope to it it doesn't it's independent of frequency it's not heaven it doesn't have any limitation on that so from low frequency to high frequency all we have to know is what that alarm limit is in the frequency doing all right so we're having a couple parameters nice we've been talking around this the last couple of seminars webinar this is about four days worth of data
and phenomenal trend changes the Amplitudes are very simple mean plus three sigma vibration and what that means is the mean vibration plus or minus three standard deviations from that mean and we can have lots of different statistical alarms on this and it's constantly updating because you're constantly grabbing data this was once every hour for four days and I can see a change in my alarm levels which is pretty impressive there's another parameter down here this is velocity Four for my main trend that I'm looking at this is high frequency acceleration and it's a filtered measurement
that we'll get into shortly that's this one's called peak view but it's a high frequency energy okay all you're doing is filtering out the low frequency you're using the same time signal that you've used before it's just filtered a different way and you're looking for the high frequency end faults instead of the low frequency And all that can be trended as well very good rolling element bearing parameter for detecting those types of problems so along with the time waveform which we're seeing basically the the peaks from the time waveform we can also do with frequency
responses for more diagnostic purposes but the way that the the node captures data we don't need to capture the entire spectrum to make it useful we can capture peaks in different frequency ranges so we can specify the 1 times our P.m. range or the sub synchronous or the harmonic ranges of interest and we can pull a value off of that and trend each of those values so the the database setup is is always changing and it's it's got some really good capability you just have to have some ideas and how to do this statistics this
is this would be what this is like so I have a bin for my 1 x rpm and that's you know basically I can put a do a spectrum put a filter on one x rpm and pull that value off I can Also do it for blade passing for varying frequencies for ear machine all the different things in here I know the bearings themselves what make and model number it is I can put a very narrow band in there and look for these frequencies to appear and it's very subtle stuff and the in the background
noise and be very very very interesting to pull those out statistically which shouldn't be too bad we're going to look At the frequency now how often something happens there's a lot of sources and you think about it I have a direct couple of Center hound fan and overhung fan over here but same deal sub-synchronous frequencies the rolling element bearings can cause sub synchronous the isolation system the springs that the structures on can balance and cause a low frequency vibration that sub synchronous synchronous in shaft speed attorneys me To the shaft harmonics are from misalignment looseness
blades and gears non synchronous frequencies come out at belt frequencies electrical resonance and rolling element bearings and modulation comes from electrical problems gears and bearing problems okay if we're only looking at the time waveform we're not seeing the frequency content we're not seeing the individual peaks in the spectrum that and seeing what percentage of each peak is is Adding to the problem but we can calculate it so the way to probably do this would be on-demand or at the beginning or end of a run cycle capture a full spectrum and you know store it in
the database otherwise you can continue on with just the amplitude levels okay the overall amplitudes but as we talked to the other days of the series how do you calculate a frequency from the time wave form you have to know the encapsulate the entire period in time so We start here we go to a negative maximum little positive maximum and then we go back to zero and repeat if we know that periodic event frequencies one over the period if it took two seconds then it's 1 over 2 it's half a Hertz and pretty easy calculation
real easy for the FFT processor as well okay frequency content we're going to do this real quick sub synchronous false or excuse me Synchronous false or at 1 times rpm the label on the top or on the sorry on the motor the nameplate data is probably going to tell us roughly what the load unloaded speed of the motor is when it came out of the shop that built it ok yours is going to be a little bit different because you're hooked up to another machine so there'll be some load on it so it might slow
it down a little bit the best way of knowing how fast your machine is turning he has to stroke And use a strobe light use a laser tack or go in with a high-resolution spectrum and actually measure it right so in this case 1784 is my turning speed of the shaft if I have a fault at one times are very close to 1 times it as in any case this is the mundane way to do it but my faults at 1784 my speeds of 79 4 I divided them I get 1 times our p.m. okay
so synchronous fall our monic faults are multiples of turning speed okay so I have to know how does this peak relate To that peak 10,000 704 when I put my cursor on it I divide by 1784 I get exactly 6 so this is 6 blinks on a fan or six blades in a pump what have you right so we have an exact multiple of turning speed sub-synchronous Falls are below running speed we have a peak here that's below turning speed we put our cursor on it divide it by running speed we get 0.4 and I
for 1/9 times running speed so it's about 40 42 percent of running Speed subsynchronous non-synchronous Peaks are not multiples of running speed I got a picture 54:41 I divide it by running speed I get three point zero four nine times your earnings beat not three times not four times it's not a whole number it's why we take it out to a couple of digits out here there's three times here's my harmonic cursor one two three four five six and so forth there's my three times Earnings beat this is at three point zero four nine so
it's non-synchronous it's probably a bearing defect okay you need a spectrum to be able to pick that out modulation events I think I get an example of a different example last time but a modulation event is a series of Peaks they're equally spaced so there's a center frequency which I have in green if I go and divide that by runnings mean I get 27 times so 27 of something if this was on a motor so it's probably 27 Rotor bars in the motor a whole number okay if I do it the same thing I divide
all these other Peaks out I'm getting some weird numbers they're not 26 25 you know so it's not a 1 times RPM spacing that's how some rolling element bearings fail they'll have they'll modulate at one times rpm this is modulating at an electrical frequency this is 120 Hertz or you multiply it by 60 it's 7200 CPM is a telling me that there's a rotor bar past problem in my motor okay you don't Really need to diagnosis to that extent I'm just trying to get you an idea of there's a center frequency and there's a spacing
on the side bands and the spacing is telling you the source okay and how its modulating so that's one type of modulation fault the last tidbit for analysis here of time amplitude frequency and phase is phase it's motion and direction it's telling us how that piece of machinery is moving that's Going to be in one of the six or seven phase tests that we perform and it's going to narrow down the response and we'll be able to pick out the root cause on the table these are the phase diagnostic icons this is the group so
it's mostly synchronous problems right and one natural frequency yet this year problem doesn't play into it so there's three five ten there's ten different phase type problems here that we'll have to dig into they all have the same Spectrum they all have a dominant one x rpm possibly at two x rpm harmonic and they look enough alike that we can't tell one from the other okay so if we don't do phase analysis we're not going to be able to define any of those problems visually gives you better idea this is offset anger or angular misalignment
I have my analysis I've done across the coupling in the axial direction in their 180 degrees out of phase I do that same Thing in the vertical direction in their 180 degrees out of phase this is an offset in this line either horizontal or vertical depending on the direction okay phase it's how the system is vibrating define is the relative motion to a fixed reference like a laser a relative motion to a rotating reference measured in angular degrees the Manian full phase numbers are zero degrees 90 degrees and 180 it's the force is in the
machine That are making it correct and push back and forth okay so if we can figure out phase wise how the machines moving we're going to be able to decide for the problem how is it done real rough real rough idea of how it's done we wrote as a transducer we have a piece of reflective tape on the on the shaft somewhere that's given me a position reference that tack is hooked up and I look at the the transducer output in the tack output on The same scale and I can see that one rotation every
time it rotates in into view of that reflective tape I get a pulse every time the heavy spot goes by I get a pulse so if I know the distance between that tack in that in that pulsing and I can equate it to phase I can see what angle my heavy spot is okay but even even better this is that's more for balancing even better for a phase diagnostic my tack is at a single Position and doesn't move everything's relative every phase measure my make is relative to that tax that tacklin so I can make
little tick marks of I leave the tack where it is I put my transducer in a different spot and this waveform is going to shift around so it'll tell me a different phase number for each location you really have to do it live and in the vibration introduction of vibration class we have a motor demonstrator we go and we do a phase analysis and we mark The bubble charts so you know I know that a lot of you out there might not get this or really you can care but it's a great technology for deciphering
problems if we don't do it we're kind of lost this it these are the phase rules so there's six different rules we're looking for unbalanced as centricity we're looking for over on rotor unbalance were looking for bent shaft misalignment across the coupling bearings and soft foot conditions or Mechanical looseness type a right we're looking for all of these anything with a phase icon in it that's what we'll be able to distinguish okay last thing we're going to look at very neat effect frequencies in the velocity spectrum we're gonna look at ultrasonic impact and friction and
then the five failure stages for rolling element bearings so this is the high frequency technology that we haven't really talked about yet so far we've been focusing on Velocity measurements overall velocity for trendy purposes this is another trending program that we can look at within the same accelerometer doesn't require any new technology same time waveform coming out as we use for the lower frequency stuff we're just filtering it differently so it's all software should be transparent to you the user okay cager fundamental train frequency always occurs some synchronous I have Statistics here from 18,000 rolling
element bearings the average cage frequency is 0.4 to 8 it ranges from point four times runnings mean to point four six so there's a little bell curve under there and this is where it shows up so my synchronous or 1 times frequencies here it's below run running speed a little less than half of running speed it's typically where it shows up my example at 7:49 I divide it by running speed I get 0.42 so I'm within That range right oops where am I point four yeah point four two point four six so chances are that's
a change frequency that's showing up in my spectrum ball spin frequency its average is three point eight eight times Runnings beam and the range is one point nine two five point nine times running speed so it's a lower frequency range here my example I see a pink and it's at point five four four one time's running screen or excuse me CPM I divide it by Chinese me to the Chat and get three point zero four nine not three times it's non synchronous three point oh four nine okay so very likely a bearing defect my next
example is ball pass frequency outer it's a fault on the outer race and the balls are exciting and every time they hit it its average is seven point seven five seven times running speed the range is four point two two eleven point three so this one's out here at fourteen thousand six nineteen not sure what it is I put My cursor on it get that number I divide it by running speed and I get 8.19 for its non synchronous chances are it's a what can either be an outer race or inner race oh sorry folks
there's some reason there we go I think I took care of my computer got unplugged excuse me technical difficulties so 8.1 49 it could be either an hour race or an iterates okay we're not sure but it's in the range of Both the last couple here I have a peak at 17,000 563 so you know the drill you divide it by running speed 9.8 4 5 you got another P 35 127 I don't know what the source of this is I divided by running speed and it's nineteen point six nine it's also non synchronous but
it's twice exactly twice the first one so this is the fundamental bearing defect this is the harmonic of that so the exact multiple of that okay what is it as far as the range it is either an Outer race or an inner race we don't know for sure right here we have something unusual happening this is some modulation okay I have a center frequency and I have equally spaced side bands okay so I try to find the center twenty thousand five sixteen and I divide it by running speed I get 11 and a half do
the same thing for each of these other peaks and I get one and a half nine and a half so they're separated by one times rpm this is Typical of inner race bearing defect it's a non synchronous frequency it's in the right range and it modulates one times rpm because it's going in and out of the load zone every revolution so if this bearing is vertical down in the lower part of the bearing that take it gets more load then when it does at the top in that pattern repeats every revolution you'll get a modulation
at 1 times our p.m. and it shows up the side Vance it's Faced at one time sorry for you okay so there's bearing defects we know how to identify them if we don't know what the bearings are we know how they present themselves they're always non synchronous they always should be in a certain range if we want to know if it's coming from the inner race of the outer race of the ball or the the cage we can kind of figure it out but there's a better training method that we'll see before we'll ever see
anything in the Velocity spectrum this is a ultrasonic demodulation okay so we're going to look at that we're going to look at that and then we're going to look at the failure stages of bearings this is something called the whole thing is called de modulation so what it's doing is it's filtering the time waveform that we would normally collect and we're looking for high frequency impacting okay walk through the 7th or 8th steps real quick And see what's going on about 8 minutes left we pull the the same time waveform goes into our analysis tool
and we do a little software magic to to filter it and change it so the the raw signal has all the residual unbalance looseness misalignment electrical hydraulic very very secure machine it has everything in it okay we don't care about the big Wiggles we're looking for the real high-frequency stuff that's writing on top of it I mean we have to put it Through a filter typically it's a high-pass filter a bandpass filter I believe the the new grace transducers have the capability of making one of the transducers a high frequency a much higher frequency it
goes from 1000 Hertz up to I think 8,000 Hertz so we'll be able to capture much higher frequency events so if we put this through a high pass or bandpass filter we eliminate the low frequency wiggles in it and we only get the high frequency Stuff writing on top okay if we zoom in on that we'll see a couple of things we'll see a pulsing of them so every time a ball hits that fault in the Raceway being and it rings down being being being so there's a certain rate the impact rate is very important
we could also really zoom in and see what the ring down pattern is so we can see that it's a natural frequency typically that you're ringing the housing structure or Something but we don't really care about the ringing part we care about how often did we ring the bell that's telling us what the hammer is the hammer is the ball hitting that fault in the Raceway and then hitting them the next ball hitting it in the next ball in the next ball there will be a prescribed rate we'll be able to decipher what the source
is okay we get these transients through the string of transients and it's very low amplitude and it's they're All spaced out in time so we have to zoom in on them we can put it through some type of software peak detection something called rectification where we can eliminate or multiply it so it's looks like a bigger pink and there's another thing called time constant enveloping which is the blue line right here so we're drawing an outline of the pulsing of that what we really care about is that peak event okay so each Vendor has proprietary
signal processing to do just this and this would be something that grace would develop in the coming months we'll put it through a low-pass filter now the low-pass filter eliminates the high frequency events in there and like I just mentioned we don't care about the ringy we care about how often we run the bell the curve the blue curve down below is the outline of that pulse rate it's more it's called a sawtooth profile this we can't rent so We put it through a detector and we can trend the level that's coming out of this
and I made it look pretty variable but it pretty clean but it can be jagged and different so we will trend this over time and when it goes into alarm there's two possible things that could be it could be either impacting due to a defect in the Raceway or it could be friction from lack of lubrication so either way we probably give it a shot at grease and see if it Settles down and that works quite a bit but there is if it comes back there is some type of damage starting in the Raceway very
early indication this isn't where you change the bearing this is where you maybe step up to training a little bit these are the two things that you'd see in the spectrum so you can do a spectrum of that of that sawtooth waveform and if there's if there's no sawtooth peak in there there's just noise floor random noise you'll see Something like that so every survey this will go up and down a little bit we can trend the overall level of that energy if it is a discrete peak due to a piece of Raceway coming out
little chunk of metal being separated you'll see a discrete peak show up a discrete impact in a whole string of harmonics so you should be able to identify the source this should be non synchronous and it should equate to an inner race or outer race defect frequency in last the five Failure stages of bearing got two minutes left new bearing you're going to have is stage zero a lot of people don't even know this exists it's a new bearing break-in period you have machining marks on your Raceway that you're trying to get rid of if
you do a spectrum a velocity spectrum the normal spectrum you won't see any bearing defects if you do an ultrasonic spectrum you'll see just random noise for all you're doing is breaking off the little peaks the Little errors and machining and smoothing out the Raceway actually stage one early micro levels subsurface falser lubrication issues you're going to get no response in the velocity spectrum and you is going to get random noise for so we're just starting to wear the bearing and very subtle you won't probably won't even see it stage to you ongoing micro level
subsurface false or lubrication issues lubrication issues have just Random noise we can address that with a little grease subsurface faults that just means that we won't be able to see them on the raceway they'll be below the raceway they'll be cracks in the metal lattice structure three micro macro level visible surface damage evidence appears in the ultrasonic spectrum and the velocity spectrum so Stage three is where we start seeing defects in the velocity spectrum defects in the ultrasonic spectrum this was a low Fraction below the raceway surface and it hits out when it loses all
the contact there so they're deep edges this is what you're looking for this is a serious defect so the bearings got a finite lifetime left stage for pronounced visual damage visual spectrum defect harmonics and sideband modulation it just goes to pot so this was a bearing in a nuclear vertical pump at a nuclear plant and they asked me to take a look at it it had all kinds of varying Frequencies non synchronous peace and the velocity spectrum notice they're not very big but there's a lot of them and in the in the demodulated spectrum the
ultrasonic spectrum there's pinks and side bands on the peaks which is unusual so they were two gear decorating and cream extremely fast and when they pulled it out there's debris all over the inside of the very encasing pretty pretty bad fault very close to failure alright I think That's it for this time I appreciate everybody coming out for these webinars it's great information if you're interested in training I I do a lot of that and I can do it live or I can do it through webinars or I can do it online at your own
pace doesn't matter