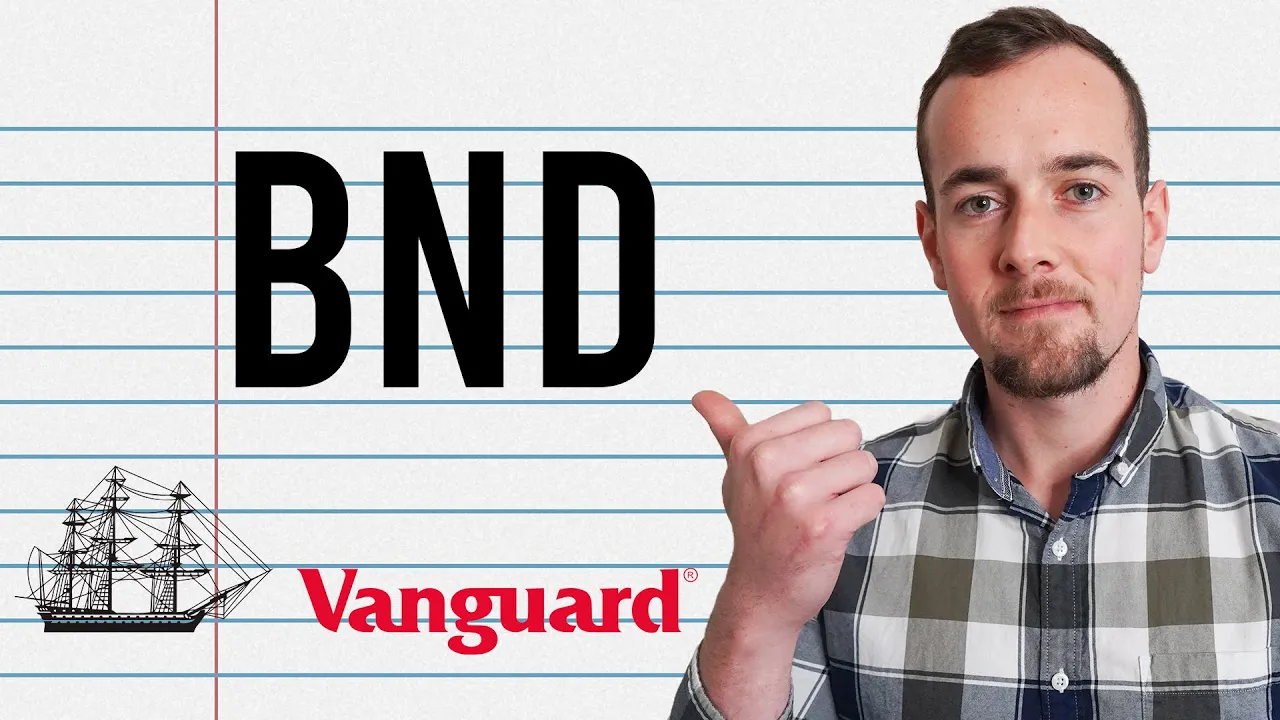
next on the list here we have our first bond fund which is the Vanguard Total Bond Market ETF trading under the symbol bndd this fund provides investors with Diversified exposure to the investment grade us bond market which is a blend of treasuries as well as corporate bonds bonds are designed to provide investors with consistent income and the price fluctuations are going to be limited compared to equities for example as you get older it becomes more and more important to diversify a portion of your portfolio into bonds to limit your downside potential with your overall portfolio now a common approach that people follow here is called the rule of 120 that's where you take 120 and subtract your current age and that is the percentage that you should have allocated into equities or stocks with the rest going into bonds so if you were 20 years old for example you might want to have 100% in equities and not necessarily worry about bonds yet but by the time you hit 30 for example that would be 90% equities 10% bonds and it's recommended to change that every 5 years so at the 35-year Mark for example you might want to do an 85% equities 15% Bond portfolio taking a look here at more details the expense ratio is . 3% and the 30-day SEC yield for the dividend is coming in at 4% so most of the returns here are going to be generated through the dividends instead of the underlying share price of the fund increasing over time if we take a look here at the year-to-date performance this is up 3. 53% so you are having some returns generated from the underlying share price going up but as mentioned most of your returns are going to be expected to be generated from the yields collected from the bonds which is going to be paid out in the quarterly dividend payment if we take a look here at the portfolio composition this particular ETF has a total of 11,2 54 bonds which is pretty crazy the average maturity is 8.
3 years with an average duration of 6 years you can also see here that the total amount invested in this fund is an astounding $336 billion now if we take a look here at the style box here this is going to be different for bonds compared to equities but this is sitting here in the top middle quadrant so that means that you have a medium duration here on your bonds and the longer the duration is the more risk there is considered to be so those are going to be slightly higher yields that's sitting right in the middle and the majority of your money is going into Treasures so you're at the very top in terms of looking at the left hand side in terms of the bond quality treasuries are going to be considered the lowest risk and then you have the corporate bonds that sit below that and within corporate bonds there's going to be credit ratings which are going to show you what is considered to be investment grade bonds and then you have junk bonds and that's based on the credit worthiness of the individual companies taking a look here at the overall credit rating you can see 68% of the fund goes into US government or treasuries the next largest component is triple B's which is 13. 2% and then you have 12. 3% in a rated bonds 3 and 1 12% in AAA and 3% in able a all of these here are going to be corporate bonds and we can actually see some of those later on when we take a look at some other details looking here at the issuer type you can see that the largest component here is treasury or agency bonds at 47.
7% then it's going to be government mortgage-backed bonds and then you have industrial followed by Finance representing large components here of this bond fund and if we look at the maturity window here this shows us the average maturity for these bonds so 1 to 5 years is going to be the largest category here at 44.