The following content is provided under a Creative Commons license your support will help MIT open courseware continue to offer highquality educational resources for free to make a donation or to view additional materials from hundreds of MIT courses visit MIT opencourseware at ocw.mit.edu doesn't run Flash Player so I had to run them on the on um uh Chrome all right so um let's move on to our Second chapter and hopefully in this chapter you will feel a little better if you felt like it was going a bit fast in the first chapter and the main reason
why I actually went fast especially in terms of you know conference interval some of you came and asked me what do you mean by this is a conference interal what does it mean that it's not happening in there with probability 95% Etc I just went really fast so that you could see why I didn't want to give you A first week doing you know probability only and without understanding uh what the cont thetical context for it was right so hopefully all these things that we've done in terms of probability you actually know why we've been
doing this and so we're basically going to go back to what we're doing maybe start with some statistical uh setup but the goal of this lecture is really going to go back again to what we've seen from a purely uh uh statistical perspective all Right so the first thing uh we're going to do is explain why we're doing statistical modeling right so in practice if I if you have data If You observe a bunch of points and here I gave you uh some uh some some numbers for example so here's a partial data set with
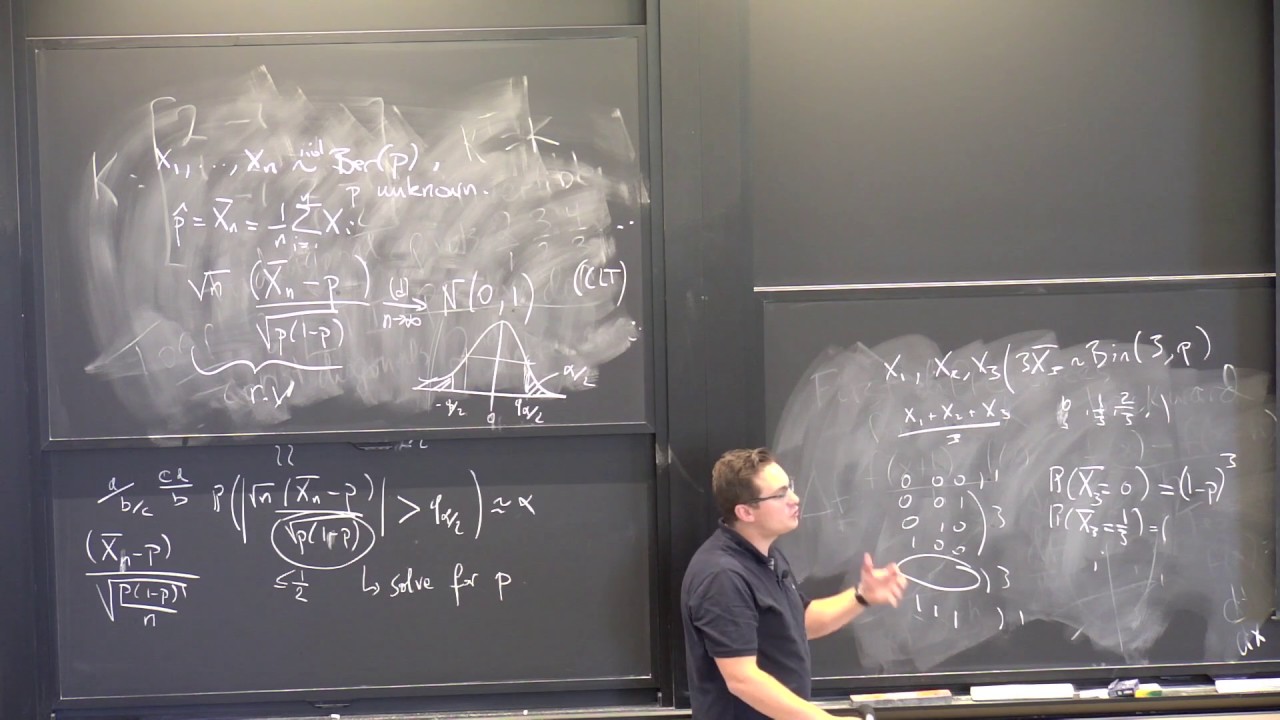
the number of siblings including self that were collected from college students a few years back right so I was teaching a class like yours and I actually asked students to go and fill Out some Google form and tell me a bunch of things and one of the questions was including yourself how many siblings do you have and so they gave me this list of numbers right and uh and there's many ways I can think of this list of numbers right I could think of it as being just a discrete Distribution on the set of numbers
between one I mean I know there's not going to be an answer which is less than one unless uh well someone doesn't understand the question but uh All the answers I should get are positive integers 1 two 3 Etc and you know there probably is an upper bound but I don't know it on the top of my head so maybe I should say 100 uh maybe I should say 15 uh depends right and so I think the largest number I got for this was six all right so uh um here you can see you have
pretty uh standard families you know lots of ones twos and threes okay so the way what statistical modeling is doing is to try to compress This information that I could actually describe in a very naive way so let's start with the basic uh uh uh usual statistical setup right so I will start many of the board that look like X1 xn random variables and what I'm going to assume as we said typically is that those guys are IID and they have some distribution all right so they all share the same distribution and the fact that
they're IID is so that I can actually do Statistics statistics means you know looking at the global uh averaging things so that I I can actually get a sense of what the global behavior is for the population right if I start assuming that those things are not identically distributed they all live on their own right that my sequence of number is your number of siblings uh the shoe size of this person uh the depth of the Charles River and I start measuring a bunch of stuff there's nothing I'm going to Actually get together I need
to have something that's cohesive and so here uh uh I collected some data that was cohesive and so the goal here the first thing is to say what is the distribution that I actually have here right so I could actually be very general I could just say it's some distribution p and let's say those are they're random variables not random vectors right I could collect entire vectors about students but let's Say those are just random variables and so now I can start making assumptions on this distribution P right what can I say about a distribution
well maybe if those numbers are continuous for example I could assume they have a density right a probability density function that's already an assumption maybe I could start to assume that their probability density function is smooth that's another assumption maybe I could actually assume that it's peaceway Constant that's even better better right and those things make my life simpler and simpler because what I do by making the Su successive assumptions is reducing the degrees of freedom of the space in which I'm actually searching the distribution and so what we actually want is to have something
which is small enough so we can actually have some averaging going on but we also want something which is uh uh big enough that It can actually express it has chances of actually containing a distribution that makes sense for us so let's start with the simplest possible example which is when the XIs belong to 01 and as I said here we don't have a choice the distribution of those guys has to be Burn only and since they're IID they all share the same P right so that's definitely the simplest possible thing I Could think of
they're just burnly P okay and so all I would have to figure out in this case is p and you know this is the simplest case and unsurprisingly it has the simplest answer right we will come back to this example when we study maximum likelihood estimators or method of Moments estimators by the method of moments but at the end of the day uh uh uh the things that we did the things that we will do are always the Naive estimator you would come up with is what is the proportion of one and this will be
in pretty much all respects the best estimator you can can think of all right so then we're going to try to assess his performance and we saw how to do that in the first chapter as well so this problem here somehow is completely understood we'll come back to it but there's nothing fancy that's going to happen but now I could have some more complicated things right so for example In in the example of the students now my XIs belong to the sequence of integers one two three Etc okay which is also denoted by n maybe
without zero if you want to put zero in N right so the positive integers or I could actually just maybe put some prior knowledge about how humans have time to have families but you know maybe some some people thought of uh their college mates as being their brothers and sisters and one student Would actually put you know 465 siblings because you know we're all good friends and uh or maybe they actually think that all their uh Facebook contact are actually their siblings and so you know you never know what's going to happen so you maybe
you want to account for this but maybe you know that people are reasonable and they will actually give you something like this now intuitively maybe you would say well why would you bother doing this if You're not really sure about the 20 but I think that probably all of you intuitively guess that this is probably a good idea to start putting this kind of assumptions rather than allowing for any number in the first place because this eventually will be injected into the Precision of our estimator if I don't if I allow anything it's going to
be more complicated for me to get an accurate estimator if I know that the numbers are either one or two Then I'm actually going to be slightly more accurate as well all right because I know that if for example somebody put a five I can remove it then it's not going to actually screw up with my estimator all right so now let's say we actually agree that we have numbers and here I put uh seven numbers okay so I just said well now the numbers let's assume that the numbers I'm going to get are going
to be one all The way to say this number that I denote by larger than or equal to seven which is a placeholder for any number larger than seven okay because I know maybe I don't want to distinguish between people who have nine or 25 sbls okay and so now this is a distribution on seven possible values discrete distributions and you know from you know your probability class that the way you describe this distribution is using the probability Mass function okay or pmf okay so that's what how we describe a discrete distribution and the pmf
is a uh just a list of numbers right so as I wrote here you have a list of numbers and here you wrote the possible value that your random variable can take and here you write the probability that your random variable takes this value okay so the possible values being one two three all the way to larger than or Equal to seven and then I'm trying to estimate those numbers right if I give you those numbers at least up to this you know compression of all numbers larger than or equal to seven you have a
full description of your distribution and that is the ultimate goal of Statistics right your the ultimate goal of Statistics is to say what distribution your data came from because that's basically the best you're going to be able to do now admittedly if I Started looking at the fraction of ones and the fraction of twos and the fraction of Threes Etc I would actually eventually get those numbers right just like looking at the fraction of on gave me a good estimate for p in the verly case it would do the same in this case right it's
a pretty intuitive idea it's just the law of large numbers every every body agrees with that if I look at the proportion of ones The proportion of twos the proportion of Threes that should actually give me something that gets closer and closer as my sample size increasing increases to what I want but the problem is if my sample size is not huge here I have seven numbers to estimate and if I have you know 20 observations the ratio is not really in my favor right I mean you know 20 observations to estimate seven parameters some
of them are going to be Pretty off typically the ones with the large values right if I have only 20 students look at the list of numbers I don't know how many numbers I have but it probably is close to 20 maybe 15 or something and so if you look at this list no nobody's actually H nobody has four or more siblings in this list right there's no such person so that means that eventually with from this data set my estimates so those numbers I denote by say P1 P2 P3 etc those Estimates P4 hat
would be equal to what from this data zero right and P5 hat would be equal to zero and P6 hat would be equal to zero and P larger than or equal to seven hat would be equal to zero that would be my estimates from this data set so maybe this is not maybe I want to actually pull some information from the people who have less siblings to try to make a guess which is probably slightly better for The larger values right it's pretty clear that in average there's more than zero the proportion of the population
uh with of households that have uh four children or more is definitely more than zero all right so it means that my data set is not representative and what I'm going to try to do is to find a model that try to use the data I have for the smaller values that I can observe and just pull it up to the other ones and so what we can do is to just reduce those Parameters into something that's you know understood and this is part of the modeling that I I talked about in the first place
now how do you s suly describe a number of something well one thing that you do is the pone distribution right why the I mean there's many reasons right I mean again that's part of statistical modeling but once you know that you have number of something that can be modeled by a pesso why not try a pesso right you could just Fit a pesso and the pesso is something that looks like this I I I guess you've all all seen it but if x follows Aon distribution with parameter Lambda then the probability that X is
equal to Little X is equal to uh Lambda to the X over factorial x e to the minus Lambda okay and if you've did the the the first the sheet that I gave you on the first day you can check that those numbers so this is of course for x equal Z one Etc Right so X is in uh natural integers and if you sum from xal 0 to Infinity this thing you get e to the Lambda and so they cancel and you have a sum which is equal to one so it's indeed a pmf
but what's key about this pmf is that it never takes value zero but this thing is always strictly positive so whatever value of Lambda I find from this data will give me something that's certainly more interesting than just putting the value zero but more importantly rather Than having to estimate seven parameters and as a consequence to actually have to estimate one two three four of them being equal to zero I have only one parameter to estimate which is LDA the problem with doing this is that now Lambda may not be just something as simple as
Computing the average number right I mean in this case it will but but but in many instances it's actually not clear that this parameterization with Lambda that I Chose is I'm going to be able to estimate Lambda just by Computing the average number that I see it will be the case but if it's not you know remember this example of the exponential we did in the last lecture we could use the Delta method and things like that to estimate it all right so here's uh here's the you know modeling 101 so the purpose of modeling
is to restrict the the the space of possible distributions to a Subspace that's actually plausible but much simpler for me to estimate right so we R we went from all distributions on seven parameters which is a large space that's a lot of things to something which is just one number to estimate now this number is positive okay any question about the purpose of doing this okay so we're going to have to do a little Bit of formalism now and so if we want to talk right this is statistic class I'm not going to want to
talk about the P model specifically every single time I'm going to want to talk about generic models and then you're going to be able to plug in your favorite word you know Pon binomial exponential uniform all these words that you've seen you're going to be able to plug in there but we're just going to have some generic notation some generic terminology for a Statistical model all right so here's the formal definition so I'm going to go uh through it with you okay so the definition is that of a statistical model okay and so uh sorry
that's a statistical experiment I should say uh I'm sorry okay so a statistical experiment is actually just a pair E and that's a set and a family of distributions P Theta where Theta ranges in some set Capital Theta okay so I hope you're up to date with your uh Greek letters so it's a small Theta that's a capital Theta I know I'm not the best uh I don't have the best handwriting so if you don't see something just ask me okay and so this thing now so each of this guy is a probability distribution all
right so for Example this could be a Pon with parameter Theta or a burnly with parameter Theta okay or an exponential with perameter I don't know 1 over Theta squ if you want okay they're just indexed by Theta but for each Theta this completely describes the distribution it could be more complicated this Theta should be a pair could be a pair of mu Sigma square and That could actually give you some n mu Sigma Square okay so anything where you can actually rather than actually giving you a uh uh full distribution I can compress it
into a parameter but it could be worse it could be this guy here right Thea could be P1 P larger than or equal to 7 and my distribution could just be something that has Pmf P1 P larger than 7 right that's another parameter is this one has seven seven it's seven dimensional this one is two dimensional and all these guys are just one dimensional okay all these guys are parameters is that clear what's important here is that once I give you Theta you know exactly all the probabilities Associated to this random variable you know its
distribution perfectly okay so Here uh uh so this is the defin is that clear for everyone is there a question about this distribution about this definition sorry all right so really the key thing is the statistical model Associated to a statistical experiment okay so let's just see some examples exle is probably just better because again with formalism it's never really clear uh actually uh that's the next slide okay So there's two things we need to assume I mean there's okay so the purpose of a statistical model is to once I estimate the parameter I actually
know exactly what distribution I have okay so it means that I could potentially have several parameters that give me the same distribution that would still be fine because I could estimate one guy or I could estimate the other guy and I would still recover the underlying Distribution of my data the problem is that this creates really annoying theoretical problems like things don't work the algorithms won't work the guarantees won't work and so what we typically assume is that the model is so-called wellp specified all right sorry that's not well specified U I'm jumping ahead of
myself okay well specified means that your data the the distribution of your data is actually one of those Guys okay so some uh vocabulary so well specified means that for my observations X there exists a Theta in capital Theta such that X follows p subeta I should put a double bar okay so that's what wellp specified means okay so that means that the distribution of your actual data is just one of those guys this is a bit strong of an assumption all right It's strong in the sense that you know I don't know if you've
heard of this uh sentence uh which I don't know I can tell you who it's attributed to but that's probably means that this person did not come up with it uh but it said that um all models are wrong but some of them are useful all right so all models are wrong means that maybe it's not true that this Pon distribution that I assume for the number of siblings for college students Maybe that's not perfectly correct maybe there's a spike at three right maybe there's a spike at one because you know maybe those are slightly
more educated families they have less children maybe this is actually not exactly perfect but it's probably good enough for our purposes and when we make this assumption we're actually assuming that the data really comes from a pestl model there is a lot of research that goes on about misspecified models and that tells You how well you're doing in the model that's the closest to the actual distribution that's pretty much it yeah X is uh so right so by data so it's always the way I gener I I denote one of the generic observations right so
my observations are X1 xn and they're IID with distribution P always so X is just one of those guys I don't want to write x five or X4 it's just one they're IID so they all have the same distribution so Okay no no no they're all IID so they all have the same P Theta they all have the same p which means they'll have the same Peta so I can Pi any one of them so I just remove the index just work quick okay so when I write X I just mean think of X1 right
there IDE I can pick whichever I want I'm not going to write X1 it's going to be weird okay is that clear okay so this uh particular Theta is called The true parameter sometime to since we're going to want some variable Theta we might denote it by Theta Star as opposed to Theta hat which is always a rator but uh I'll keep it to be Theta for now and uh so the the aim of the statistical experiment is to estimate Theta so that once I actually plug in Theta in the form of my distribution for
example I could plug in Theta here so Theta here was actually Lambda so once I estimate this guy I would plug it in and I would know the probability that my random variable takes any value right by just putting a Lambda hat and Lambda hat here okay so my goal is going to be to estimate this guy so that I can actually compute those distributions but actually we'll see for example when we talk about regression that this parameter actually has a meaning in many instances and so just Knowing the parameter itself intuitively or say more
let's say more so than just Computing probabilities will actually tell us something about the process so for example we're going to run linear regression and when we do linear regression there's going to be some coefficients in the linear regression and the value of this coefficient is actually telling me what is the sensitivity of the response that I'm looking at to this particular input all Right so just knowing if this number is large or if this number is SL small is actually going to be useful for us to just look at this guy all right so
there's going to be some instances where it's going to be important sometimes we're going to want to know if this parameter is larger or smaller than something or if it's equal to something or not equal to something and those things are also important for example if Theta actually measures the True right so Theta is a true unknown parameter true efficacy of a drug okay let's say I want to know what the true efficacy of a drug is and what I'm going to want to know is you know maybe it's a score maybe I'm going to
want to know if Theta is larer than two maybe I want to know if Theta is the average number of siblings is this true number larger than two or not right maybe I'm interested in knowing if college students come from um uh so come So maybe from a sociological perspective I'm interested in knowing if college students come from a household with more than two children right so those can be the questions that I may asking myself right I'm going to want to know maybe Theta is going to be equal to one half or not so
maybe for drug efficacy is it completely standard maybe for elections are the is the proportion of the population that that is going to vote for this particular candidate equal to 0.5 or is it different from 0.5 okay and I can think of different things when I'm talking about the regression I'm going to want to test if this coefficient is actually zero or not because if it's zero it means that the variable that's in front of it actually goes out and so those are things we're testing actually having this very specific yes no answer is going
to give me a huge Intuition or a huge understanding Of what's going on in the phenomen that I observe but actually since the questions are so precise it's going to be much more I'm going to be much better at answering them rather than giving you an estimate for Theta with some confidence around it all right it's the sort of the same Principle as trying to reduce right what you're trying to do as a statistician is to inject as much knowledge about the question and about the problem that you Can so that the data has to
do a minimal job and and force you actually need less data right so for now on we will always assume and this is because this is an introstats class you will always assume that Theta the subset of parameters is a subset of R to the D that means that Theta is a vector with at most a finite number of coordinates why do I say this well this is called a parametric model so it's called a parametric Model or sometimes parametric statistics actually we don't really talk about parametric statistics but we talk a lot about non-parametric
statistics or a non-parametric model can somebody think of a model which is non-p parametric for example in the siblings example if I did not cap the number of siblings to seven but I left I let this list go to Infinity I would have an infinite number of parameters to estimate very likely The last ones would be zero but still I would have an infinite number of parameters to estimate so this would not be a parametric model if I just let this list of things to to be estimated to be infinite but there's other classes that
are actually infinite and cannot be represented by vectors for example function right if I tell you my model PF is just the distribution of X's the probability distributions that have density F right so what I know is that the density is not negative and that it integrates to one right that's all I know about densities well f is not something you're going to be able to describ with a finite number of values right all possible functions this is a huge set it's certainly not representable by 10 numbers okay and so non-parametric Estimation is typically when
you actually want to parameterize this by a large class of functions and so for example histograms is the prime tool of nonparametric estimation because when you fit a histogram to data you're trying to estimate the density of your data but you're not trying to represent represent it as a finite number of uh of points even though that's really I mean effectively you have to represent it right so you actually truncate somewhere And just say those things are not going to matter all right but really the key thing is that this is non parametric where you
have an infinite POS potentially infinite number of parameters whereas we're going to only talk about finite and actually finite in most most overwhelming majority of cases is going to be one right so Theta is going to be a subset of R1 okay we're going to be interested in estimating one parameter just like the Parameter of a of a Pon or the parameter of an exponential the parameter of verley uh but uh for example rarely we're going to be interested in estimating mu and sigma Square for the for the normal okay um so here are some
statistical Models All right so I'm going to go through them with you so we start right so if I tell you I observe I'm interested in understanding Uh the I'm I'm still that shallow and I'm interested in understanding the proportion of people who kiss by bending their head to the right and for that I collected n observations and uh I'm interested in making some inference in the statistical model my question to you is what is the statistical model well well if you want to write the statistical model you're going to have to write this e
oh sorry I never told you what e was okay well actually let's Just go to uh the examples and then you'll know what e is so uh I'm I'm uh I'm you're going to have to write to me an E and A P Theta okay so let's start with the burnly trials so this e here is called the sample space and in uh normal people's World words it just means the space or the set in which X and back to your question X is just a generic observation Lips okay and hopefully this is the smallest
you can think of okay so for example for br trials I'm going to observe a sequence of zeros and ones so my experiment is going to be as written on the board is going to be one 01 and then the probability distributions are going to be well it's just going to be the burnly distributions indexed by P right so rather than writing P sub P I'm going to write it as Bally P because it's clear what I mean when I write that is everybody uh Happy actually I need to tell you something more this is
a family of distribution so I need p and maybe I don't want to have P that takes value Z or one right I mean it doesn't make sense I would probably not look at this problem if I anticipated that everybody would kiss to the right and everybody would or everybody would kiss to the left so I'm going to assume that P is in 01 but does not have zero in one okay so that's a statistical model for veral trial okay okay now the next one what do we have uh exponential okay okay so when I
have exponential distributions what is the support of the exponential distribution what value is can to take zero to Infinity right so what I have is that uh my first Space is the value that my r variables can take so it's well actually I can remove the zero again zero to plus infinity and then the family of distributions that I have are exponential with parameter Lambda and again maybe you see me switching from P to Lambda to Theta to Mu to Sigma Square honestly you can do whatever you want but it's just that it's customary to
have these particular Greek letters okay And so the parameters of a of a uh exponential are just positive numbers okay and that's my uh exponential uh uh model what is the third one can somebody tell me okay okay so p uh is a p random variable discrete or continuous go back to your probability all right so the answer being the opposite of Continuous good job um all right so it's going to be what values can aant take I'm all the natural integers right so 0 one two three all the way to Infinity we don't have
any control of this so I'm going to write this as n without zero uh I think in the slides it's n star maybe actually no you can take value zero I'm sorry this actually takes value zero quite a lot that's the typically Min is actually the mode uh so It's n and then I'm going to write it as with parameter well here it's again Lambda as a parameter and Lambda can take any positive value okay and that's where you can actually see that the model that we had for the siblings right so let me actually
just squeeze in the siblings uh model here all right so that was the bad model that I had in the first place when I actually Capp this let's Say we we just capped it at seven forget about larger than or equal to seven we just assumed it was seven what was our uh sample space we said seven so it's one two to seven right those were the possible values that this thing would take and then what was my uh what What's my parameter space so that's going to be a nightmare to write but I'm going
to write it okay So I'm going to write it as something like probability that X is equal to K is equal to P sub K okay and and uh that's going to be for um P okay so that's for all KS right for uh k equal 127 and here the index is the set of parameters P1 to PK and I know a little more about those guys right I know they're going to be non- Negative PJ non- negative and I know that the sum to one okay so maybe writing this you start seeing why we
like those exponential and short notation because I actually don't have to write the pmf of a p i mean the p is really just this but I call it P so I don't have to rewrite this all the time and so here I did not use a particular form so I just have this thing and that's what It is the set of parameters is the set of positive numbers that s of uh sorry P1 to p7 PK and some to seven right and so this is just the list of uh of numbers that are non-
negative and some up to one so that's my parameter space okay so here that's my Theta this whole thing here this is my Capital Theta okay so that's just the set of Parameters that theeta the set of parameters that Theta is allowed to take okay and finally we're going to end with the star of all and that's the normal distribution and in the normal distribution there's you still have also some flexibility in terms of choices because the N naturally the the normal distribution is parameterized by uh the normal distribution is parameterized by two parameters right
mean and Variance I'm going to WR so what values can a g ROM variable take the entire real line right and the set of parameters that it's uh it can take so this is going to be n mu Sigma squ and mu is going to be positive and sigma square is going sorry mu is going to be in R and sigma square is going to be uh positive okay so again here that's the Way you're supposed to write it if you really want to identify what Theta is well Theta formerly is the set of mu
Sigma squ such that well in uh well R time 0 Infinity right that's just to be formal but this does the job just look just find it okay you don't have to be super form okay so uh that's not three that's like five actually I just want to write another one let's call it five bit and five this is just Gan with known variance and this arises a lot in labs when you have measurement error when you actually receive your measurement device this thing has been tested by the Manu Factor are so much that they
actually comes and on the side of the box it says that the standard deviation of your measurements is going to be 0.23 okay and actually why they do this is because they can brag about accuracy right I mean that's how they sell you This particular device and so you actually know exactly what Sigma score is so once you actually get your data in the lab you actually only have to estimate new because Sigma comes as comes on the label and so now what is your statistical model well the numbers you're going to be collecting still
live in R but now the the models that I have is n mu Sigma squ but the parameter space is not mu in r in Sigma positive it's just mu in R and to be a little uh more fatic about this this is enough to describe it right because if Sigma is the sigma that was specified by the manufacturer then uh uh this is the sigma you want but you can actually write Sigma is equal to Sigma square is equal to Sigma Square manufacturer right you can just fix it to be this particular value or
maybe you Don't want to write an index that's manufacturer and so you just say well the sigma when I write Sigma Square what I mean is the sigma square of the manufacturer yeah yeah yeah for a particular measuring device you know you're in a lab and you have some measuring device I don't know uh something that measures the I tensile strength uh of something and it's just going to measure something and it will naturally make errors but it's been Tested so much by the manufacturer that they actually and calibrated by them they know it's not
going to be perfect but they knew exactly what error it's making because they've actually tried it on thing for which they exactly knew what the tensile strength were okay yeah this oh like 5 uh Place Prime okay and we can come up with other Examples right so for example here's another one okay so the names don't really matter right I mean uh you know I called it the siblings model but you won't find the siblings model in a textbook right so I wouldn't worry too much but for example let's say you have something so let's
call it six you have uh I don't know a truncated and that's the name I just came up with but it's actually uh not uh Exactly describing what I want but let's say I observe Y which is the indicator of X larger than say five when X follows some exponential with parameter Lambda okay this is what I get to observe I only observe if my waiting time was more than five minutes because I see somebody coming out of the candle station being really upset and that's all I record it's been waiting for more than 5
minutes And that's all I get to record okay that happens a lot these are called sensored Data I should probably not call it uh truned but this should be censored okay you see a lot of sensored data when you ask for people how much they make they say well more than uh five figures and uh that's all they want to tell you okay and so you see a lot of sensored data uh in um survival analysis right you uh you're trying to understand understand how long your Patients are going to live after some surgery okay
and uh and uh maybe you're not going to keep people uh live and you're not going to actually have their being touching their family every day and ask them if the guy still alive and so what you can do is just to ask people maybe five years after their study and say please come in and you know you will just have happen to have some people who say well you know the person is deceased and you will only be able to know that The person deceased less than five years ago I mean but uh you
only see what happens after that okay and so this is this truned and sensored data happens all the time just because you don't have the availability to uh do better than that so so so this could happen here so now what is my statistical experiment right so here I should really I should probably write this like that because just told you that my observations are going to be X so there's some unknown y I will never get to see this y I only see to get to see the X what is my statistical experiment please
help me so is it the real line my sample space is it the real line sorry do you know every who does not know what this means I'm sorry okay so this is an called an indicator so I I write it as it's if I wrote well that would be one with a double bar you can also write I if you prefer if you Don't feel like writing one double bars and it's one of uh say I'm going to write it like that one of um a is equal to one if a is true and
zero if a is false okay so that means that if Y is larger than five this thing goes one is one and if Y is not lar larger than five this thing is zero okay so that's called indicator indicator function Okay it's very useful to just turn anything into a zero1 so now that I'm here what is my sample space 01 what whatever this thing I did not tell you was taking value was the thing you should have uh if I end up telling you that's taking value six or seven that would be your example
space okay um okay so it takes value 01 and then uh what is the uh Probability here what should I write here what should you write without even thinking yeah so let's assume there's two seconds before the end of the exam you're going to write burn and that's where you're going to start checking if I'm going to give you extra time okay so you write burnly without thinking because it's taking value zero one so you just write bur but you still have to tell me what possible parameters this thing is taking right so I'm going
to write it P because I don't know and then P takes value okay so sorry I could write it like that right that would be perfectly valid but actually no more it's not any P the p is the probability that an exponential Lambda is larger than five five and maybe I want to have Lambda as a parameter okay so what I need to actually compute is what is the Probability that Y is larger than five when Y is this exponential Lambda which means that what I need to compute is the integral between five and Infinity
of uh what it one over Lambda how did I Define it in this class I change what oh yeah right right right you're right Lambda e to the minus Lambda X DX right so that's what I need to compute what is this yeah so what is the value of this Integral you take appropriate measures okay and uh again that's just Bas counsel us right so when I'm going to integrate this guy those guys are going to cancel I'm going to get zero for Infinity I'm going to get a five for this guy and uh well
I know it's going to be a positive number so I'm not really going to bother with the sign because I know that's what it should be okay so I get e to the minus 5 Lambda and so that means that I can actually Write this like that and now parameterize this thing by Lambda positive okay so what I did here is I changed the parameterization from P to Lambda why well because maybe if this I know this is happening maybe I'm actually interested in reporting Lambda to MBTA for example right maybe I'm actually trying to
estimate one over the uh one over Lambda so that I know what is the uh uh well Lambda is actually the Intensity of arrival of my uh of myal process right if I have a PR process that's where how my um my uh trains are coming in and so I'm interested in Lambda so I will parameterize things by Lambda so that the thing I get is Lambda you can play with this right I mean I could parameterize this by one over Lambda and put one over Lambda here if I wanted but you know your the
context of your problem will tell you exactly how to parameter This okay um so uh what else I want to tell you okay let's do a final [Applause] one by the way are you guys okay with u you know PL exponential burnly uh I don't know binomial normal all these things I'm not going to go back to it but I'm going to use them heavily so you know just spend five minutes on Wikipedia if you forgot about What those things are uh usually you've you must have seen them in your probability class so that should
not be crazy name and again I'm not expecting you I mean I don't remember what the density of an exponential is so it would be pretty unfair of me to actually ask you to remember what it is even for the gaon you're not expected to remember what it is but I want you to remember that you know if I add five to a gan then I have a gon with me new plus 5 If I multiply it by something right I need you need to know how to to operate those things so uh but uh
knowing complicated uh densities is definitely not part of the game okay so um let's do final one I don't know what number I have now I'm going to just do uniform that's another one everybody knows what uniform is a uniform right so I'm going to have X which uh my observations are going to be uniform on the interval 0 Theta right so if I want To define a uniform distribution uh for a random variable I have to tell you which interval or which set I want it to be uniform on and so here I'm telling
you is the interval zero Theta and so what is going to be my uh sample space I'm sorry 0o to Theta and then what is my uh probability distribution my family of parameters so well I can write it like this right uniform Theta Right and Theta let's say is positive can somebody tell me what's wrong with what I wrote this makes no sense tell me why yeah yeah this set depends on Theta and why is that a problem there's no Theta right now there's the families of thetas which one did you pick here right there's
no this is just something that's indexed by Theta but I could have very well written it as uh you know just uh not being great for a second I could have just written this as T right rather than Theta okay that would be the same and then what the hell is Theta there's no such thing as Theta we don't know what the parameter is the parameter should move with everyone and so that means that I actually am not allowed to pick this data I'm actually just for the reason that there's no Parameter to put on
the left side there should not be right so you just said well there's a problem because the parameter is on the left hand side but there's not even a parameter I'm describing the family of possible parameters there's no one that you can actually plug it in so this should really be one and I'm going to go back to writing this as Theta because that's pretty standard is that clear for everyone I Cannot just pick one and put it in there I just take the the the before I run my experiment I could potentially get numbers
that are all the way up to one because I don't know what Theta is going to be ahead of time now if somebody promised to me that Theta was going to be less than 0.5 that would be sorry why do I put one here uh I could put Theta between zero and one but if somebody's going to promise me for example that Theta is Going to be less than one then yes I could put zero one all right is that clear okay so now you know how to answer the question what is the statistical model
and again within the scope of this class you will not be asked to just come up with a model right that will just tell you quest would be a probably good idea here and then you would just have to trust me that indeed would be a good Idea all right so what I started talking about about uh 20 minutes ago so I was definitely ahead of my of myself is the notion so that's what I was talking about well specified remember well specified says that the true distribution is one of the distribution in this parametric
families of distribution the true distribution of my siblings is actually a Pon with some parameters and all I need to figure out is what this parameter is When I started saying that I said well but then that could be that there are several parameters that give me the same distribution right it could be the case that P five and P 17 are exactly the same distributions when I start putting those numbers in the formula which iced okay so it could be the case that two different numbers would give me exactly the same probabilities and in
this case we see that the model is not identifiable I mean the parameter is not Identifiable I cannot identify the parameter even if you actually gave me an infinite amount of data which means that I could actually estimate exactly the pmf I might not be able to go back because there would be several candidates and I would not be able to tell you which one it was in the first one okay so what we want is that this function Theta maps to P Theta is injective and that's really to be fancy what I really mean
is that if Theta is different from Theta Prime then P of theta is different from P of theta prime or if you prefer to think about the contrapositive of this this is the same as saying that if P Theta gives me the same distribution as Theta Prime then that implies that Theta must be equal to Theta Prime right the logic those two things are equivalent right so that's what is what this means that so this is we say that the Parameter is identifiable or identified doesn't really matter in this model okay and this is something
we're going to want okay so in all the examples that I gave you those those parameters are completely identify right if I tell you I mean if those things are in probability box it means that they were probably thought through right so when I Say exponential Lambda I'm really talking about one specific distribution and not uh uh there's not another Lambda that's going to give me exactly the same distribution okay so that was the case and you can check that but it's a little annoying so I would probably would not do it but rather than
doing this let me just give you some examples where would not be the case okay and here's an example if I take X on so now I'm back to just do using this Indicator function but now for a gan right so what I observe is X is the indicator that Y is what did we say positive okay so this is a burnly random variable right and it has some parameter P but P now is going to depend sorry and here what is n new Sigma Square so the P the probability that this thing is positive
is actually I don't think I put the zero Yeah it was oh yeah because I have Okay so this distribution this P the probability that it's positive it's just the probability that some Galan is positive and it will depend on mu and sigma right because if I draw I have zero and I draw uh my gussan around mu then the probability of being of this burnly being one is really the area under the curve here right and this thing well if mu is very Large it's going to become very large if mu is very small
it's going to become uh very small and if Sigma changes it's also going to affect it is that clear to everyone but we can actually compute this right so so the parameter P that I'm looking for here as a function of mu and sigma is simply the probability that some Y is non- negative which is the probability that Yus mu / Sigma is larger than minus mu ided Sigma by the way when you uh studied Probability is that's some operation you were used to making removing the mean and dividing by the standard deviation what is
the effect of doing that on this on the Gin random variable yeah so you normalize it right you standardize it you actually make it a standard Gan you remove the mean it becomes a mean zero Gan and you remove the variance to for it to become one so when you have a gan remove the mean and divide by standard deviation it becomes A standard Gan which this thing has n z one distribution which is the one you can read the quenes of at the end of the book right and that's exactly what we do did
okay so now you have the probability that some standard Gan exceeds mu over Sigma which I can write in terms of the cumulative distribution function capital F like we did in the first lecture so if I do this cumulative distribution function what is this probability in Terms of five let well that's what your name tag says one minus one minus mu over Sigma what happened to F in this in in our you think I defin this for fun uh 1 minus F of mu over Sigma right right because this is one minus the probability that
it's less than this and this is exactly the definition of The cumulative dist so in particular this thing only depends on mu over Sigma agreed so in particular if I had 2 mu over 2 Sigma P would remain unchanged if I have 12 mu over 12 Sigma this thing would remain in change which mean that P does not change if I scale mu and sigma by the same factor so there's no way Just by observing X even an infinite amount of time so that I can actually get exactly what p is I'm never going to
be able to get new n Sigma separately all I'm going to be able to get is Mu over Sigma so here we say that mu Sigma the parameter mu Sigma or actually each of them individually those guys they're not identifiable but the parameter mu over Sigma is identifiable so if I wanted to write a Statistical model in which the parameter is identifiable I would write 01 veral and then I would write 1 minus pi over of mu over Sigma and then I would take two parameters which are mu and R and sigma squ positive or
let's right Sigma positive right No this is not identifiable I cannot write those two guys as being two things different instead what I want to write is 01 Vernal 1 minus and now my parameter uh I forgot this uh my parameter is Mu over Sigma can somebody tell me where mu over Sigma Lives what values can this thing take any real value right okay so now I've done this definitely out of conven venience right because that was the only thing I was able to identify the ratio of mu over Sigma but it's still something that
has some meaning it's the stand it's the normalized mean it really tells me what the mean is compared to the standard deviation so in some models in reality in some real applications this actually Might have a good meaning for me it's just telling me how big the mean is compared to the standard fluctuations of this model but I won't be able to get more than that I all right so now that we've set a parametric model let's try to see what our goals are going to be okay so now we have a sample and a
Statistical model and we want to estimate the parameter Theta and I could say well you know what I don't have time for this analysis collecting data is going to take me a while so I'm just the and I'm going to say that over Sigma is for I'm just going to give it to you and maybe you will tell me ah not very good right so we need some measure of performance of a given parameter we need to be able to evaluate if you know eyeballing the problem is worse than Actually collecting a large amount of
data we need to know if even if I come up with an estimator that actually sort of uses the data does it make an efficient use of the data would I actually need 10 times more observations to achieve the same accuracy so to be able to answer these questions well well I need to Define what accuracy means and accuracy is something that sort of makes sense it says well I want Theta hat to be close to Theta and but Theta hat is a Random variable so I'm going to have to understand what it means for
a random variable to be close to a deterministic number and so what is the parameter an estimator right so I have an estimator and I said it's a random variable and the formal definition so an estimator is a measurable function of the data okay so when I write Theta hat and That will typically be my notation for a uh an estimator right I should really write Theta hat of X1 xn okay that's what an estimator is so if you want to know what the estimator is this is a measurable function of the data and it's
actually also known as a statistic and you know if you're interested in you know I I I see every day I think uh when I have like you know A uh dinner with normal people uh and they say I'm a statistician oh yeah really like baseball and they talk to me about you know batting averages like that's not what I do but for them that's what it is and that's because in a way that's what a statistic is a batting average is a statistic okay and so here are some examples you can take the average
X and bar you can take the maximum of your observation that's the statistics you Can take the first one you can take the first one plus log of one plus the absolute value of the last one you can do whatever you want that will be an estimator some of them are clearly going to be bad but that's still a statistic and you can do this now when I say measurable I always have uh so you know gradu students sometimes ask me like yeah how do I know if this estimator is measurable or not and usually
my answer is well if I give you data can you Compute it and they say yeah I'm like well then it's measurable that's a very good rule to check if you can actually if you're uh something is actually measurable when is this thing not measurable is when it's implicitly defined okay and in particular the things that can give you problems are uh well oh yeah soup or INF anybody knows what a soup or an INF is it's like a Max or a Min but that's not always a Tain okay so if I have X1 so
if I look At uh the infim of the function f ofx for X on the real line and F ofx sorry let's say X on one infinity and F ofx is equal to 1 /x right then the infinum is the smallest value it can take except that it does not really take it it's zero right right because 1 /x is going to zero but it's never really getting there so we just call the in zero but it's not the value that it ever takes and this things might actually be complicated to compute and so that's
When you actually have problems right when the limit is not you're not really quite reaching the limit you won't have this problem in general but just so you know that nstimer is not really anything it has to actually be measurable okay so the first thing we want to know I mentioned it is uh so an estimator is a statistic which does not depend on data of course okay so if I give you the data you have to be able to compute it and that probably should not Require not knowing an unknown parameter okay so an
estimator is said to be consistent if when my data when I collect more and more data this thing is getting closer and closer to the true parameter all right and we said that you know eyeballing and saying that is going to be four is not really something that's probably going to be consistent but they can have things that are consistent but that are converted ing TOA at different speeds okay and we know Also that there's this is a random variable it converges to something and we there might be some different Notions of convergence that kick
in and actually they are and we see that it's weakly convergent if it converges in probability and strongly convergent it spe converges almost surely okay and this is just vocabulary it won't make a big difference okay so we will typically say it's consistent but you say any of the two Um well so in parametric statistics it's actually a little difficult to come up with but in non-parametric ones I could just say if I have Yi XI Yi and I know that Yi is f of x i plus some noise Epsilon I and I know that
F belongs to some class of functions let's say so class of smooth functions massive right and now I'm going to actually find the following estimator I'm going to take the average so I'm going to do Le Squares right right so I just check I'm trying to minimize the distance of each of my f of XI to my Yi and now I want to find the smallest of them okay so if I look at the infimum here then the question is uh um so that could be uh well that's not really an estimator for f but
it's an estimator for the smallest possible value and so for example uh this is actually an estimator for the variance of Sigma Square this might not be attained and this might not need be measurable if f is massive right so that's the info vers some class F of okay so those are always things that are defined implicitly if it's an average for example it's completely measurable okay any other question okay so we know that the first thing we might want to check and that's definitely something we want about an Estimator is that it's consistent because
all consistency tells us is that the as I collect more and more data my estimator is going to get closer and closer to the parameter there's other things we can look at for each possible value of n now right now I'm have I have a finite number of observations 25 and I want to know something about my estimator the first thing I want to check is maybe if in Average right so this is a random variable is this random variable in average going to be close to Theta or not and so the difference how far
I am from Theta is actually called the bias okay so the bias of an estimator is is the expectation of theta hat minus the value that I hope it gets which is Theta if this thing is equal to zero we said that Theta hat is unbiased and unbiased estimators are things that people are looking for in General the problem is that there's lots of unbiased estimators and so it might be misleading to look for unbiasedness when that's not really the only thing you should be looking for okay so what does it mean to be unbiased
maybe for this particular round of data you collected you're actually pretty far from the true estimator but uh one thing that actually uh uh what it means is that if I redid this experiment over and over and over Again and I averaged all the values of my estimators that I got then this would actually be the right the true parameter okay that's what it means it's if I were to repeat this experiment in average I would actually get the right thing but you don't get to repeated experiment Ty okay just a remark about estimators look
at this estimator xn bar right think of the kiss example I'm looking at the average of my observations and I want to know what the Expectation of this thing is okay now this guy is by linearity of the the expectation is this right but my data is identically distributed so in particular all the XIs have the same expectation right is that everybody agrees with this when it's identically distributed they all get the same expectation so what it means is that this guys Here they're all equal to the expectation of X1 right so what it means
is that this guy I have the average of the same number so this is actually the expectation of X1 okay and it's true in the kiss example this was p and this is p the probability of turning your head right okay so those two things are the same in particular that means that xn Bar and just X1 have the same bias so that should probably illustrate to you that bias is not something that really is telling you the entire picture right I I can take only one of my observations burnly 01 this thing will have
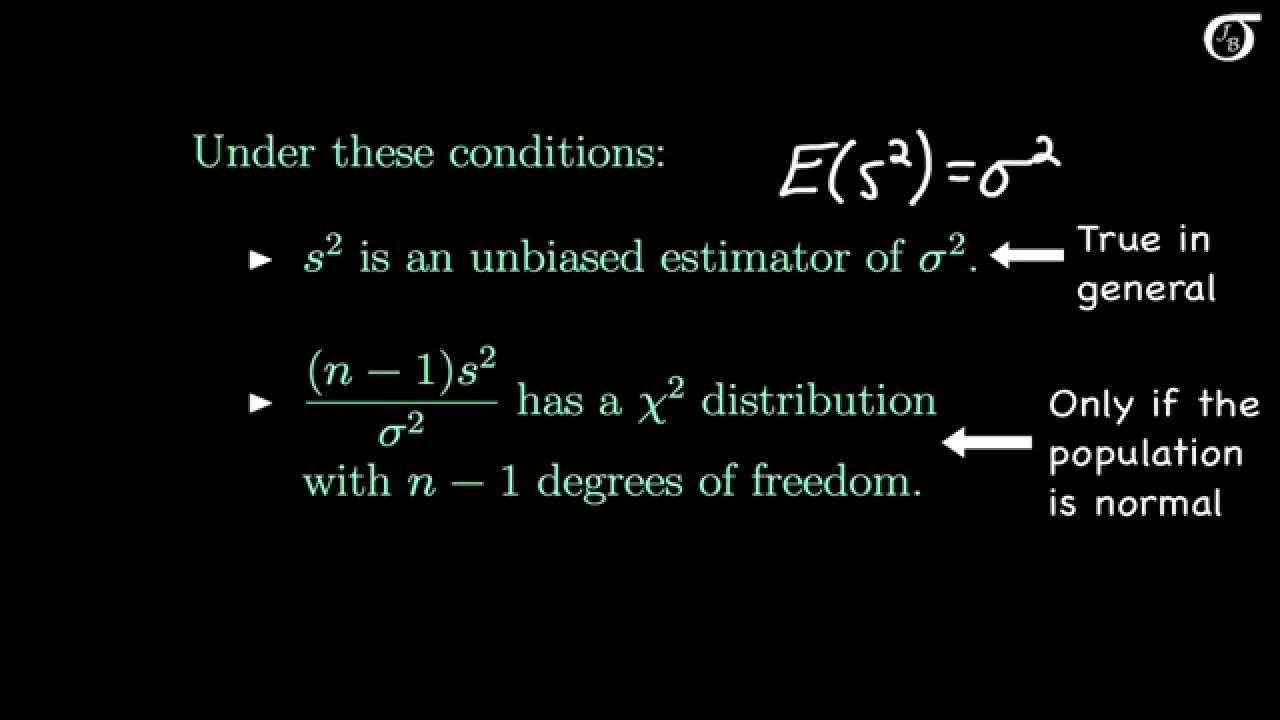
the same bias as if I average a thousand of them so the bias is really telling me where I'm in average but it's really not telling me what fluctuations I'm getting and so if you want to start having Fluctuations coming into the picture we actually have to look at the risk or the quadratic risk of an estimator and so the quadratic risk is the find as the expectation of the square distance between Theta hat and Theta okay so let look let's look at this so the quadratic risk sometimes it's denoted people call it the L2
risk of theta hat of course Worse I'm sorry for maintaining such an ugly board I keep this uh stuff uh okay so I look at the square distance between Theta hat and Theta this is still this is a function of a random variable so it's a random variable as well and I'm looking at the expectation of this guy okay that's the definition I claim that when this thing goes to zero then my estimator is actually going to be consistent Everybody agreed with this so if uh goes to zero as n goes to infinity and here
I don't need to tell you what kind of convergence I have because this is just a number right it's an EXT expectation so it's a regular usual calculus th convergence then that implies that Theta hat is actually weekly consistent what do they use to tell you This yeah this is the convergence in L2 right this actually is strictly equivalent this is by definition saying that Theta hat converges in L2 2 to Theta and we know that convergence in L2 implies convergence in probability to Theta right that with the picture we're going up and this is
actually equivalent to weak consistency by definition of weak consistency okay so this is actually Telling me a little more because this guy here they're both unbiased Thea xn bar is unbiased X1 isn't biased but X1 is certainly not consistent because the more data I collect I'm not even doing anything with it I'm just taking the first data point you're giving to me so they're both unbiased but this one is not consistent and this one we'll see is actually consistent xn bar is consistent and actually we've seen that last time and That's because of the what
guarantees the fact that X and bar is consistent law of large numbers right actually it's strongly consistent because of a strong LW of large numbers okay so just uh for in the last two minutes I want to tell you a little bit about how this risk uh uh is linked to see I says quadratic risk is equal to B squ plus variance so let's see what I mean by this so I'm going to forget about the Absolute values I have a square I don't really need them if Theta hat was unbiased this thing would be
the expectation of theta hat right it might not be the case so let me see how I can actually see put the bias in there well one way to do this is to see that this is equal to the expectation of theta hat minus expectation of theta hat plus expectation of theta hat minus Theta okay I just removed the same and added the same thing so I didn't change anything now this guy is my bias right so now let me expand the square so what I get is the expectation of the square of theta hat
minus its expectation should put some square bracket plus two times the cross product so the cross product is what expectation of theta hat minus expectation of theta Hat Time expectation of theta hat minus Theta and then I have the last Square expectation of theta hat minus Theta squ okay so Square cross product Square everybody's with me now this guy here if you pay attention this thing is the expectation of some random variable so it's a deterministic number data is the true parameter it's a Deterministic number so what I can do is pull out this entire
thing out of the expectation like this all right and compute the expectation only with respect to that part but what is the expectation of this thing it's zero right expectation of theta hat minus expectation of theta hat is zero so this entire thing is equal to zero so now when I actually collect back my uh my quadratic terms my two square terms in this Expansion what I get is that the expectation of theta hat minus Theta 2 is equal to the expectation of Theta hat minus expectation of theta hat squ plus the square of expectation
of theta hat minus Theta right so those are just the two uh the first and the last term of the previous equality now here I have the expectation of the square of the difference between A random variable and its expectation this is otherwise known as the variance right so this is actually equal to the variance of theta hat and this well this was the bias we already said that there so this whole thing is the bias Square okay and hence the quadratic term is the sum of the variance and the squared bias y squar bias
well because otherwise you would add dollars and Dollars squares squared right so you need to add dollar squared and do Square so that this thing is actually homogeneous okay so if x is in dollars then the bias is in dollars but the variance is in dollar squ okay and the square here forc you to put everything on the Square uh scale right so what's nice is that if the quadratic risk goes to zero then since I have the sum of two positive terms both of them have to go to zero that means that my variance
is Going to zero very little fluctuations and my bias is also going to zero which means that I'm actually going to be on target once I reduce my fluctuations because it's one thing to reduce the fluctuations but if I'm not on target it's an issue right for example the estimator four the value four has no variance every time I'm going to repeat the experiment I'm going to get four four four four variance is zero but the bias is bad the bias is four minus Theta And if Theta is far than far from four that's not
doing very well okay so um next week uh we will uh well we'll talk about uh what is a good estimate what what how estimators change if they have high variance or uh uh low variance so uh or high bias and low bias and we'll talk about confidence intervals as well all right


![The 6 MUST-KNOW Statistical Distributions MADE EASY [4/13]](https://img.youtube.com/vi/V3Qxj2C7rP0/maxresdefault.jpg)