you you welcome back folks this teaching is going to be specifically dealing with trading the key swing points okay so what swing points are going to be teaching in this module we're going to be revisiting the Asian open a London open the New York open and the done then close all right so engineering the daily range now obviously I teach with power three that the general rule of thumb is get age' is a consolidation then learning increase the higher the low of the daily range New York is part of the expansion and then London close
creates the higher low of the date or the opposite end of the range that's formed in London but not always is that the case in some instances the Asian open will create the daily high or low as seen here in this example below the day's formed during the Asian open and then the highest formed in the London session conversely as I mentioned in the beginning this is a typical power 3 scenario where we have consolidation in Asia then when it's bullish we create the low of the day and then it expands throughout the rest of
the day now London open it can create obviously as I teach with power three it can create the low or high the day in this example here you can see the London session creates the very low lower than it was at the beginning of the trading in Asia or London can be part of a retracement when the asian session creates the low today so the way we're going to use this information is if Asia creates a low or high the Danis example creates a low and starts to run and expands outside of the Asian range
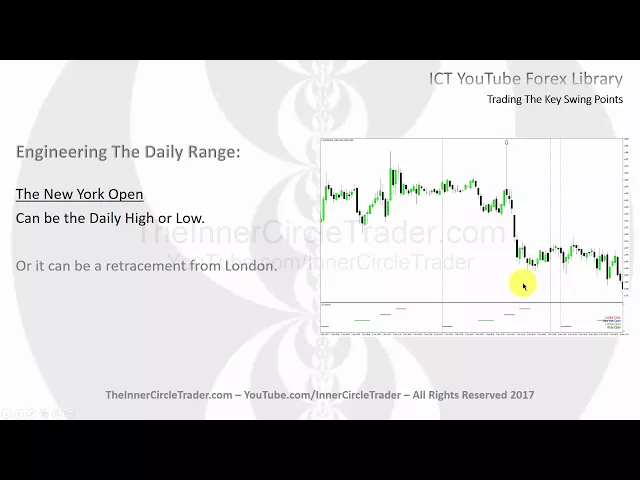
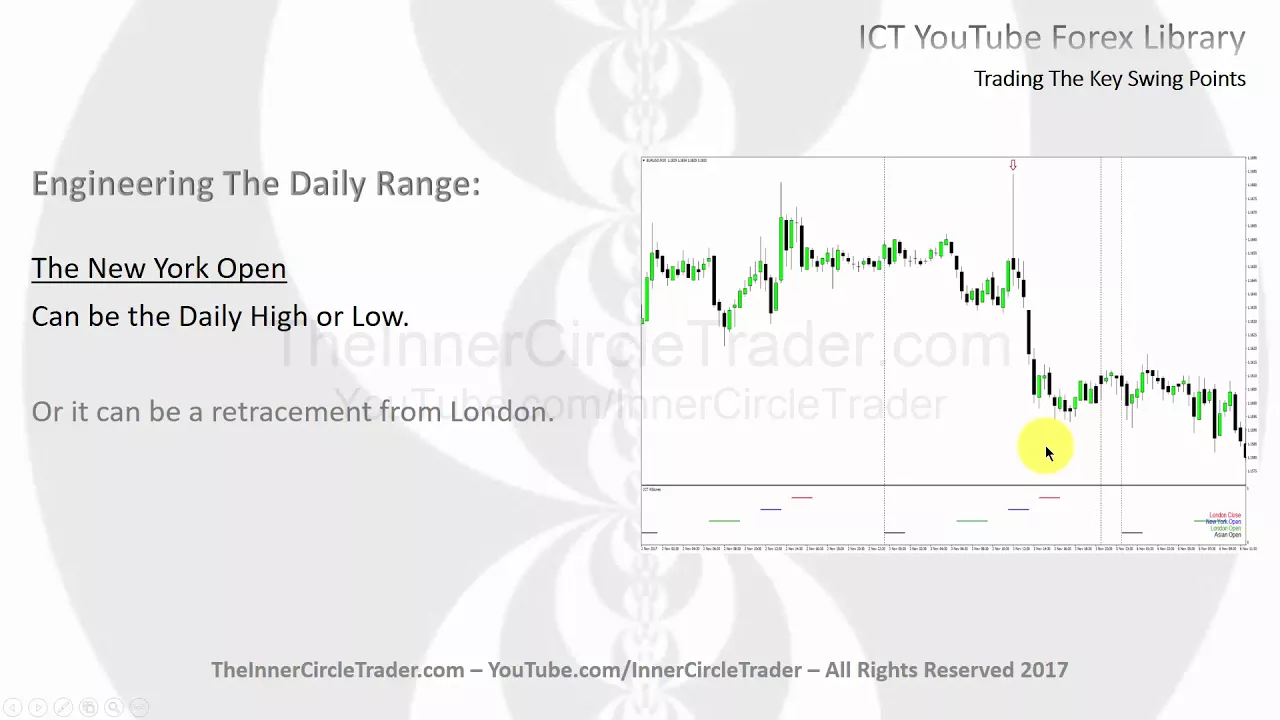
this drop down in London is typically going to be a retracement of the initial leg or impulse leg of the intraday move if we're bullish we're going to assume that Asia creates the low and we're retracing down into what would be optimal trade entry and that could be eight long so the long and open can be a part of the move that occurs and originates from the Asian open now the New York open this to can create the high or low the daily range as well as you can see there's an example of the market
staying in a consolidation drops down and when you have to assume that we would be bearish this particular day but there may be a big news event that comes out and it creates a run on liquidity and we can see that running above these equal highs here creating the New York open raid on liquidity that makes the high the day in the market trades the lower as a result equally significant we can see the New York open can be part of a retracement from the London open here we see the low formed in London creates
an impulse swing trades back down into the New York open creates a nice retracement and then rallies creating the high the day later on during a New York and overlap of London close so both scenarios this is the classic scenario this is what I teach and have taught for years this is the easiest setup when we want to trade the New York open so the swing point takes place here we'd have to assume that were bullish before and then the low has to be formed and shares a clear impulse swing during the London session then
retraces during the loving lunch going into New York open we can see the turning point here or swing point that would be treated rather handsomely now this is a bullish in area it would just as equally effective if it was London getting a high today it trades lower during the London session then retraces pop into New York session creating a retracement which is a classic continuation on the bearish idea or down close premise for a daily range or your particular market and expansion going towards London close so everything we're showing here just can be done
in Reverse ok the London close now this can be the high or low of the day typically for bullish and London's created the low of the day or age has created a load of the day.i London closed tends to be the opposite end of the range now it doesn't always close to high and/or low into the range but generally as a rule of thumb I believe that it will serve you well other instances it can create the high the day when it's been an arrangement as you can see here the market was in a large
consolidation we have equal highs market runs up throwing London clothes takes those highs and creates the actual high the day and trades lower this could be done in Reverse this could have easily been equal lows down here and it could have eventually drove down to get the equal lows and making the low of the day and or it can be a reversal point from a longer-term perspective as we see here the market has been trading higher during the London closed time period during the London close time here market makes a reversal on Friday next week
the following link it opens trades in consolidation and begins to move lower and lose significant lower on the following weeks Tuesday so it can act as a reversal now how do you use these swing points you want to be using higher timeframe price levels and when these specific key swing points or time of day overlap with higher timeframe levels you can anticipate what would be otherwise expected on the higher time frame for instance if we had a key resistance level that we were watching on a daily timeframe if we came to this level in mind
and we're going to speak hypothetically here because there's so many examples I could literally make a five to six hour long video and there wouldn't even scratch the surface which is the reason I have to have a mentorship because there's so many types of conditions and setups that are available not that you need to know every single one of them but it makes you very versatile as a trader as you can see things in the marketplace that aren't gonna surprise you you can anticipate them and wait for them to come in but if we're looking
for our key resistance level on the daily chart that could be the time of day when London trades up to that key resistance point and at the time of the day we're into trades there you could be a seller at London close even while the day was bullish because it's hitting that higher timeframe daily resistance price point that could be the point in which the best to sell short and that would be a scenario and the same thing would be applied to all these key swing points or time of day because we have characteristics been
shown here and we also went beyond what was typically taught as my ICT power 3 there's some blending of the rules and I've given you generic characteristics if you will for each of the four major key swing points so I want you to go through your charts and pull up a 15-minute time frame or it could be a 30-minute time frame and I want you to look at all the times that the market turns and create significant daily highs and lows and when it makes intro and weekly highs and lows and look at the monthly
highs and lows when are they forming and you'll be able to see a storyline over time studying it in reference to the higher time frames key support resistance levels that you would otherwise look for when these time periods or key swing points trade to them you will see significant in high probability turning points hopefully you enjoyed this presentation obviously if you want to find more you can visit my website at the inner circle trader.com