The purpose of this video is to give you a solid introduction to abdominal MRI when I went through residency I found that there weren't really any concise resources that provided the most essential body MRI concepts and although most residents got pretty comfortable with brain and msk MRI they were generally pretty weak at bought EMR I found that early on most trainees find the large number of sequences in abdominal Ammar confusing and don't understand the sequences themselves how to use them or how to approach an abdominal MRI so the goal of this video is to fill
that gap we're gonna briefly review the most essential basic MRI concepts and pulse sequences only enough to gain an understanding of the common pulse sequences used in body imaging specifically this is gonna help us make sense of all of the acronyms that we see for each of the sequences like SS f SC we'll go through a typical abdominal MRI protocol and review a normal abdominal MRI will also introduce basic tissue characterization and then illustrate these concepts by reviewing an abnormal abdominal MRI study future videos we'll review approaches to specific types of studies like pelvic MRI
prostate MRI liver MRI etc which will include a discussion of normal and abnormal imaging appearances let's get started with some basic physics this is gonna be far from a comprehensive review we understand that everyone has a different physics background so we're gonna assume no background even if you have a basic MRI physics background I strongly suggest that you watch this video through we will review only the most essential concepts recall that CT uses x-rays to create images of things that display their attenuation of those x-rays if it attenuates x-rays more like bone and metal it's
gonna look brighter and if it attenuates x-rays less like gas in the lungs it's gonna look darker on the image MRI is completely different and a little bit more complex we can spend hours going over MRI physics and even then we'd still just be scratching the surface but the primary purpose of this talk is to get you looking at body MRIs and as possible and unfortunately that still requires at least a superficial understanding of a few key MRI principles also apologies to The MRI physics purists this is intentionally oversimplified I've included some links in the
description just some great MRI resources if you are interested in having or taking a deeper dive simply put the signal that we get and look at in clinical MRI comes from imaging hydrogen nuclei in water and in fat these hydrogen nuclei like in other subatomic particles possess spin or spin angular momentum and this spin gives the nuclei a magnetic moment to put it in a simpler way think of each hydrogen nucleus behaving like a tiny bar magnet with a vector illustrating the magnetic moment in the absence of an external magnetic field all of these tiny
bar magnets are pointed in all different directions and if you look at the net magnetization vector of any particular tissue it would be about zero there would be no net magnetization vector in any direction in an externally applied magnetic field however like an MRI machine the tiny bar magnets tend to want to align with the magnetic field so in a tissue you end up with more magnetization in the direction of the magnet the tissue has a net magnetization vector in the direction of the main magnetic field As shown here let's look at an MRI machine
so a big part of this MRI machine acts essentially as a big magnetic field that is aligned down the bore of the magnet and that's marked here as b0 the main magnetic field is down the bore of the magnet which is also called the z axis or z axis the strength of the magnetic field in clinical MRI these days is most commonly 1.5 or 3 Tesla and this diagram shows these magnetic moments of the individual hydrogen molecules aligning with this field since the majority of them align these add up to a net magnetization vector in
the direction of the main magnetic field when a magnetic moment is aligned in the field like we're showing here this is considered a low energy state put more simply the little barbed magnets are naturally pulled in this direction along the z axis or z axis it's easier for them to align with the field than to oppose it the z axis again is the longitudinal direction down the bore of the magnet so how do we translate this into MRI signal next we apply something called a radiofrequency pulse or RF pulse that is designed to tip the
net magnetization away from the z axis The RF pulse is essentially a smaller varying magnetic field applied at a specific frequency in a direction that is perpendicular to the main magnetic field it's not really a radio wave but instead it's electromagnetic energy with a frequency that is in the radio wave spectrum a key point is that in order to tip the magnetization away from the z axis the RF pulse has to be at a frequency that matches the spin of what it's trying to tip down for now who cares about these details what matters most
is that the RF pulse tips the net magnetization away from the z-axis and into the XY plane how much it tips away from the z-axis is called the flip angle here for simplicity let's say that this is 90 degrees for now and again with this 90-degree RF pulse shown here with b1 the net magnetization is tipped into the XY plane again perpendicular to the z axis that we described prior the RF pulse does two things one it tips the net magnetization vector into the XY plane as we just showed in this diagram and two it
also makes most of the hydrogen nuclei start to precess in phase at a particular frequency think of precession is Like a wobbling motion or spinning of an object like a top the particular frequency that protons precess at is called the larmor frequency which is calculated by this larmor equation the equation says that the frequency here F is determined by the magnetic field or b0 here the stronger the magnetic field the faster it precesses in sync after the RF pulse the frequency also depends on the nucleus itself which is reflected in this term here gamma which
is the gyromagnetic ratio if that's too much for now just remember that the RF pulse does two things it tips the magnetization into the XY plane from the z-axis and causes the protons to precess or wobble in sync in a particular or at a particular frequency another important point to realize is that we generally detect MRI signal in the XY plane with a coil essentially a coil of wires we know from basic physics that if we put any coil of wires in a varying magnetic field this is gonna create a measurable current in the coil
so an MRI a net magnetization vector tilted into the XY plane like we've shown on this MRI diagram here if the detector was down here we have a net magnetization Back vector in the XY plane that is precessing in the XY plane so it's pointing towards than away then towards the coil and that varying magnetic field is gonna create a current in the coil and that's where we get the MRI signal let's look at that in another way instead of looking at it in the magnet or on an MRI diagram we can look at it
on this XYZ Cartesian system so again the magnetic field here is in the direction of the z axis which is down the bore of the magnet the net magnetic moment is going to be in the direction of the main magnetic field shown here as a blue arrow an RF pulse is applied at the right frequency and at a particular flip angle here 90 degrees for simplicity and again it's gonna do two things one it's gonna tilt the net magnetization vector into the XY plane and two the protons are gonna precess in sync with each other
so the entire net magnetization vector is precessing in the XY plane as illustrated here as mentioned earlier we detect signal in the XY plane with a coil detector the varying field in the XY plane towards than away than towards and as it precesses is gonna create a varying Magnetic field that's gonna create a current in this coil which is the MRI signal itself so this is all great we understand how we get MRI signal but the key of any imaging is to differentiate tissues from each other so that we can anatomically look at organs and
detect disease within them so how does MRI differentiate between tissues so again after the RF pulse we've tipped our net magnetization into the XY plane and as we showed earlier the nuclei are also precessing like a top at a particular frequency in sync in that plane this doesn't happen forever and over time you start to lose your signal over time through interactions with the surrounding environment the net magnetization vector will relax back to the said axis remember these at axis is the longitudinal axis so this process is called longitudinal relaxation also known as t1 relaxation
at any given point between the XY plane and the z axis there's going to be a net magnetization vector with a z-axis component or a longitudinal component and a transverse component in the XY plane what matters here is that depending on the tissue environment the Net magnetization will relax back into the z axis at different rates so at any given time different tissues will have different amounts of detectable signal and can be differentiated based on this the vector hasn't recovered all the way back into the z-axis it has a partial longitudinal component if we apply
an another RF pulse when it has a partial component the resultant net magnetization in the transverse plane will be equal to the amount of the z-axis component just prior to the RF pulse this is important because as we mentioned we detect signal in the XY plane so in order to detect differences in t1 relaxation we need to allow them to relax at different rates in the z-axis and then apply an RF pulse and listen in the XY plane a separate but related process is transverse relaxation or t2 relaxation remember we also mentioned that after an
RF pulse not only do we tip the net magnetization into the XY plane but the hydrogen nuclei also start to precess in the XY plane in sync in order to maintain signal in the XY plane or in the transverse plane the precessing molecules have to one remain in sync as they precess and to stay in the XY plane so Over time the transverse signal goes away which is called transverse relaxation or t2 relaxation in this diagram we have here we have these z axis pointing upwards and that's again the magnetic field direction and over here
we have the XY plane that's flat and early on we have a single line here that represents all of the precessing molecules in sync and the red line here is the net magnetization vector that shows full signal at the beginning here over time so this yellow line here represents time over time the nuclei begin to lose their phase coherence and they precess slightly out of phase and eventually lose signal in the XY plane in other words they relax in the transverse plane transverse relaxation or t2 relaxation this is based on interactions of the hydrogen nuclei
with the molecular environment and it's also referred to as the true t2 effect a key point that might not be immediately apparent is that anything that causes t1 relaxation as we showed here and moves into the z-axis or moves the magnetization towards the z axis is always gonna result in a concomitant loss of transverse magnetization if all of the magnetization was in The z axis the transverse component is gonna be 0 in other words any t1 relaxation is always going to cause or be accompanied by t2 relaxation but there are other additional interactions that can
also result in more t2 relaxation as illustrated in this diagram down here where we lose phase in the XY plane remember the precession has to remain in phase to keep transverse signal so there is further loss of signal when they lose phase coherence knowing this we can see that the t2 relaxation is always less than the t1 relaxation in other words t2 relaxation happens more quickly because again anything that causes t1 relaxation also causes t2 relaxation plus loss of phase coherence causes t2 relaxation so t2 times are always lower than t1 times again don't lose
sight of the main point here if none of that made sense the main point here is that different tissue environments results in different relaxation rates and therefore different tissues can give us different amounts of signal and they look different on imaging I should mention that t2 refers to true t2 effects due to energy transfers with the tissue environment again the mechanisms Aren't important but what is important is the concept of t2 star t2 star refers to observed transverse relaxation which includes the effects of magnetic field inhomogeneity remember earlier we mentioned that hydrogen nuclei precess at
a particular frequency the larmor frequency that was directly proportional to the magnetic field strength any magnetic field in homogeneity will result in some protons that experience higher field strengths and others with lower field stress so the ones that have higher field strengths precess faster than the other ones if that happens then of course you know that there will be a resultant loss in signal in the transverse plane very quickly because the transverse magnetization depends on precession remaining in sync local field inhomogeneity can be caused by things like metal calcium hemosiderin all things that affect the
magnetic field that hydrogen nuclei around these things experience as a result things around the metal for example will lose t2 signal very quickly and show up as very dark on these images t2 star is always gonna be shorter than true T 2 because t2 star is just the t2 effect plus the Effect of the magnetic field inhomogeneity before I go on if you have no MRI background and are lost right now that's okay just stick it out we'll get to more clinically relevant things relatively shortly if you take one thing away from the last few
slides it should be this any given tissue has a particular t1 relaxation time namely how fast it recovers magnetization of the z axis and 82 relaxation time how long it takes for transverse signal to decay and we can differentiate tissues based on this which is the whole point of imaging now in order to create MRI images the MRI goes through a complex set of precisely time manipulations RF pulses gradients etc called pulse sequences we're gonna go over some pulse sequences commonly used in abdominal imaging in the next section but these pulse sequences are what are
run to get you all of the images that you end up looking at on the workstation the pulse sequences can result in images that are t1 weighted or t2 weighted which describes which characteristics of the tissue we're trying to look at are we trying to differentiate tissues based on their t1 relaxation or their t2 relaxation no Sequence is purely t1 or t2 weighted but a pulse sequence is designed to try to bring out the t1 or t2 characteristics of each of the tissues to differentiate them and we'll briefly talk about how that happens in the
next section so let's start diving into what tissues are gonna look like on these t1 and t2 weighted images that you're gonna be look at looking at using the concepts that we've learned of relaxation remember an MRI we're really only imaging hydrogen atoms in water and in fat mostly water so let's start by considering pure water and pure fat here we have water in fat hydrogen atoms yellow is fat and blue represents hydrogen and water and they are aligned with the external magnetic field in the longitudinal or z-axis we apply a 90-degree RF pulse and
the net magnetization vector is knocked down to the XY plane and precesses in sync in the XY plane water has a very long t1 relaxation time so it likes to stay closer to the XY plane for a long period of time fat on the other hand has a short t1 relaxation time so it recovers towards the z-axis pretty quickly fat now after some time has a much larger component than the water in the Z-axis the fat has recovered quite a bit more in the z-axis so when we apply another RF pulse at this point again
the fat is gonna have a lot more signal than the water on pulse sequences that are t1-weighted fat is gonna be very bright and water is gonna look relatively dark similarly it takes a long time for the t2 signal of water to decay so you maintain your water signal on t2 images for a long time t2 on t2-weighted images water looks very bright fat is a little more complex we won't talk a little fat on t2 for now what about all of the other tissues what are they gonna look like on MRI so again MRI
is looking at hydrogen molecules in water and in fat and we talked about pure water and pure fat on the last slide we've also displayed these in the first two rows so pure water and pure fat so water is gonna be t1 relatively dark and t2 pretty bright or very bright fat is going to be bright on t1-weighted images it's more complex on t2-weighted images but for fast spin echo or fast t2-weighted images fat is gonna look relatively bright in other tissues in the body like the liver or the pancreas or other tissues we're not
really dealing most Of the time with pure water or pure fat instead the hydrogen molecules in water and in fat mostly water actually are in an in an environment of other macromolecules these macromolecules are going to affect the t1 and t2 relaxation times of the hydrogen molecules in the water in those tissues so we're still imaging the water for example on the liver but the t1 and t2 relaxation times are severely affected by the macromolecules that are in the liver that's why in a normal liver the t1 signal is relatively bright and the t2 signal
is relatively dark as an aside most lesions that you're looking for a lot of lesions that you're looking for in the liver are gonna be t2 brighter than the t2 dark background liver so they're gonna stand out in comparison similarly on t1-weighted images most lesions are gonna be relatively t1 dark compared to a brighter liver but we'll talk about that more in the liver MRI video most pathology in general is gonna have a high water content so it's mostly gonna be t1 darkish and t2 bright or it's worth knowing a few commonly seen things that
do not follow those signal characteristics for example the Signal of blood products depends on the age of the blood products but for now and especially in body imaging we're often looking for sub acute blood and it's often gonna show up as t1 hyper-intense or t1 bright the t2 signal and blood is gonna depend on when you're imaging it this is similar to protonation Tyrael and mucin mucinous material more proteinaceous and mucinous materials can be t1 bright and t2 darker especially when the mucin becomes very dry or in space a tit hit hemosiderin or chronic blood
products are gonna be dark on all sequences so dark on t1 and dark on t - and very fibrotic tissues are also gonna be dark on t1 and t2 ated images there's not much water and densely packed fibrosis lastly not on this diagram but air and metal are going to look completely black on all sequences because there are no water or fat hydrogen nuclei in either if this is confusing you don't worry after we get through this introductory stuff we're gonna pull up some MRIs and review all of this stuff again for now look at
this image this is a t2-weighted image through the upper liver you see the CSF is bright here that's almost like pure water this is a t2-weighted image fat is Bright here the fluid and the stomach is bright the liver is relatively dark and we have a focal lesion here that is relatively bright this happens to be a hemangioma but notice how good MRI is at contrasting the background liver to the focal hepatic lesion let's move on to a brief primer on pulse sequences remember pulse sequences are essentially precisely timed RF pulses or radio frequency pulses
and gradients designed to generate MRR signal that can be detected and turned into an image the parameters of the pulse sequence are what will determine the tissue contrast for example whether they're more t1 or t2 weighted a gradient echo pulse sequence is one of the simplest pulse sequences a gradient echo pulse sequence starts with a single RF pulse for example this is a 90-degree RF pulse but it can be lower magnetic field gradients are then applied and we don't have time to go into details about gradients but essentially gradients results in a varying magnetic field
in space in a particular direction essentially a gradient in magnetic field in a direction that's why they're called gradients so you can have X gradients and Y gradients that vary In the X&Y planes respectively for example if the magnetic field strength is different in different position for example in the x-axis then we know from our more equation earlier that hydrogen atoms are gonna spin at different frequencies in different locations so with that gradients allow us to make the RF pulses selective to a particular slice of tissue it allows us to collect data from a very
specific area and spatially localized the MRI signal ie know where the MRI signal is coming from this is beyond the scope of this talk so we're not gonna talk about gradients very much more and we're really not gonna include them in our diagrams and model up the picture so we have this RF pulse gradients do their thing and then sometime later we have this echo and this is a gradient echo this is signal that we can sample and then we do it again a little bit later with another RF pulse and then another echo down
the road here okay so now we have enough information here to define two key pulse sequence parameters T E or time to echo and TR or time to repetition that are both measured in milliseconds the T E is the echo time or time to echo which is defined as The time in milliseconds from the center of the RF pulse to the center of the echo the T R is the repetition time or time to repetition also measured in milliseconds defined as the length of time between corresponding consecutive points on repeating series simply more simply put
from RF pulse to RF pulse these parameters are important and are what determines tissue contrast this is a very important point you can have a gradient echo sequence that is more t1-weighted t2-weighted or somewhere between the type of pulse sequence doesn't determine the tissue contrast the pulse sequence parameters ie te and T are predominantly due in a spin echo pulse sequence there are two RF pulses at the beginning we have a 90-degree RF pulse here followed by 180-degree RF pulse technically speaking a spin echo can start with any two RF pulses but most commonly we
use a 90-degree RF pulse followed by a 180 degree RF pulse and that's how we identify that this is a spin echo sequence so the 90-degree RF pulse here tips the spins in to the transverse plane and causes the nuclei to precess in sync in the XY plane as we've mentioned multiple times over Time after this 90-degree RF pulse there's gonna be some longitudinal relaxation back towards us at axis and transverse relaxation or t2 relaxation also remember that there is transverse decay due to magnetic field inhomogeneity x' what we introduced when we talked about t2
star if certain nuclei experience a lower magnetic field they're gonna precess slower than the other protons get out of phase which is gonna result in a loss of signal in the transverse plane so after all of those types of relaxation are occurring in the interim we then apply a 180-degree pulse which is also called a rephrasing or refocusing pulse the 180-degree pulse is halfway between the 90-degree pulse here and the echo which is also known as the TE so the 180-degree pulse happens at 1/2 of te the purpose of this 180-degree pulse is to bring
the nuclei that precess out of phase due to magnetic field in homogeneity back into Faye's we then have our spin echo here and the signal that we get here is not as sensitive to signal loss from magnetic field inhomogeneity x' as the gradient echo that we showed earlier again we have the te and TR and these are the Parameters that determine the tissue contrast the way that this rephrasing pulse is often explained is through an example of racecars and erase or runners if we have one car traveling faster which will be one than the other
which is to the car that travels faster like a hydrogen molecule that experiences a stronger magnetic field and therefore has a higher frequency will get out of phase with the slower proton or slower car so if we let that play out for some period of time after a 90 degree RF pulse or the start of a race they start to get out of phase due to the differences in frequencies or speeds if we're talking about cars if we turn those cars around like that to face the start line again after a certain amount of time
and then we wait the exact same amount of time the two cars will be back in phase at the start line that is equivalent to the 180-degree pulse turning the spins backwards and after the exact same amount of time the spins will be back in phase so the takeaway point here is that the spin echo sequences use this refocusing or rephrasing pulse to reduce magnetic field inhomogeneity z-- through this mechanism and you Can recognize a spin echo by having two RF pulses usually a 90 and 180 degree pulse at the start we mentioned earlier that
the type of pulse sequence itself doesn't determine the tissue contrast the type of contrast is mainly determined by the te time to echo and tr a repetition if you remember two things from all of this remember this one shorter TRS will emphasize t1 effect and longer te s will emphasize the t2 effect so why is that let's start with why short TRS or short time two repetitions and the size t1 effect well if we had shorter TRS think about what happens when we repeat the pulse sequences when we repeat the pulse sequences with a short
TR we do it so quickly that we don't let the magnetization completely recover into the z axis before we start the next sequence so different tissues have big differences in t1 signals and that determines tissue contrast so to illustrate that here we've simplified our diagram into just showing the z axis and in blue we have water molecules and in yellow we have fat molecules if we apply a 90-degree RF pulse the entire net magnetization vector is in the XY plane and therefore there Is nothing in the z axis after a very short period of t1
relaxation these begin to relax in the longitudinal plane the fat molecules or hydrogen molecules in fact have a much shorter t1 relaxation time and so they relaxed towards the z axis quicker and after a very short period of time have a bigger net magnetization vector in the z axis if we then applied an RF pulse at this time the amount of signal that we would detect in water would be very low and the amount of signal that we detected in fat would be very high and that would be based on the differences in t1 relaxation
differences between those tissues so a shorter TI emphasizes that different in the t1 relaxation effect to illustrate that more if we had waited even longer and had a long TR we would have let the water and fat molecules completely relax into the z-axis and then if we apply an RF pulse there's no difference between the tissues and so we've now completely gotten rid of any differences in t1 relaxation so remember one thing here again short TRS emphasize the t1 effect for the reasons that we just mentioned also remember that longer te emphasize t2 effect if
the te is Extremely short we're listening to the echo or detecting the echo right away and we're not allowing much T to decay to occur if to you if the te is relatively long we're allowing more t2 decay to occur before listening and tissues will have different signals based on their t2 effect if that doesn't make any sense just remember what's on the screen short TR emphasizes t1 and long te emphasizes that t2 effect and you'll already be most of the way there if you know those two things then it makes sense that a t1
weighted sequence or if you want to make a sequence that's t1 weighted you're gonna use short TRS to emphasize the t1 effect as we mentioned and you're gonna use short T ease to get rid of or minimize any t2 effect we want the images to be predominantly t1 weighted t2-weighted images should use a long TR in order to minimize the t1 effect and a long te to maximize the t2 effect proton density or PD sequences aren't really used that much in routine body imaging but they use a long TR to minimize t1 effect and a
short te to minimize t2 effect and if you minimize the both if you minimize both the t1 and t2 effect you're just left with the density Of protons that's why it's called proton density but again we don't really use that much in routine body imaging so let's apply these concepts to something clinically relevant this is an MRCP or magnetic resonance cholangiopancreatography image it's a technique used to image the biliary and pancreatic ducts and help us look for things like stones strictures tumors etc we're really trying to get a good look at the duct stand this
is the CBD here these are the intra paddock ducts and this is the pancreatic duct here this is an example of a thick slab MRCP image and we'll talk about how we acquire these in a little bit but essentially these are just very very heavily t2-weighted images remember water is very bright on t2-weighted images because water has a long t2 relaxation time so if we emphasize t2 effects to a very very high degree we're gonna get something like this where signal has lost everywhere else and only the water or things like water are maintaining their
signal MRCP s therefore use very long t es remember long t YZ emphasis to t2 effect so they use very long t es to produce these images most of the things lose the signal and the Water and the bile ducts and the pancreatic duct maintain their signal and we get great images let's talk about fat saturation so fat is bright on images derived from t1-weighted images and fast t2-weighted sequences as mentioned earlier we often suppress the signal from fat for a few reasons and we can do so in a few different ways MRI is a
little bit different than CT and how it displays signal intensities in CT we are displaying how much something attenuates x-rays things that attenuate x-rays more than water are going to higher attenuation or brighter than water with MRI the structure with the highest signal on the image is assigned a value of one and everything else is image relative to that so if we want other bright things like cattle in iam for example which is a contrast agent to stand out fat suppression is gonna help make the gadolinium stand out better fat saturation also helps us detect
bulk fat in things so if something is bright on the t1-weighted image like this subcutaneous fat here in the bottom right corner of the image and it's dark on the fat saturated image then we know it is truly bulk fat And this can be clinically important on the left here we have a t1-weighted image again bright subcutaneous fat and here we have a t1-weighted fats at image with dark subcutaneous fat we also happen to have a large left at neck sole mass in this young female patient and it has a lot of t1 hyperintensity in
it on this image alone we don't know exactly what this is based on the signal at least but if we look at the fat saturated image we see that we lose signal here or the bulk fat is saturated out so this is a bulk fat containing ovarian or an exome ass this is a dermoid or mature teratoma of the ovary what I want you to take away from this slide is the following one fat saturation allows us to characterize tissues we can figure out what has bulk fat in it like the lesion that we just
showed in the subcutaneous tissues and - fat saturation makes the background dark so other things that are t1 bright are gonna stand out better as I mentioned there are a few ways to produce fat saturated images for now we're going to briefly touch on two of those methods the first is called stir or short TI inversion recovery stirrer uses an inversion recovery Pulse to null the fat what is that an inversion recovery pulse is a 180 degree inversion pulse before starting a conventional spin echo pulse sequence so what does that do well the initial 180
degree pulse flips magnetization into the negative Z direction after a certain amount of time based on their t1 relaxation time they start to recover in the z axis towards the positive z axis in a short amount of time because fat has a very short t1 relaxation time fat is going to cross through 0 and everything else is still gonna have signal if we apply the RF pulse at that exact time when fat is crossing zero then we're gonna get signal from everything else and the fat signal is gonna be suppressed as a result this is
how stirrer suppresses fat there's also something called chemically selective fat suppression I should introduce now that protons in fat actually precess or spin like a top slightly slower than protons in water remember RF pulses only work if they are at a frequency that matches the larmor frequency of the nuclei that it's trying to knock down chemically selective fat suppression first excites only the fat molecules with a very narrow RF pulse and then it spoils or eliminates all signal from what was selected then the pulse sequence starts as usual and the fat signal is eliminated clinically
what are the advantages and disadvantages of these techniques well if you want to remember anything remember this stir fat suppression techniques often give us a more homogeneous suppression they are less sensitive to magnetic field in homogeneity s but we can't use stir with gadolinium with chemically selective fat suppression techniques we can in fact use them with gadolinium but the fat suppression is often less homogeneous and it's more sensitive to in homogeneity with things like metal okay let's talk about diffusion weighted imaging water molecules in most tissues in the body can freely move and diffuse in
random directions so called Brownian motion simply put in certain situations this motion is restricted in the body and the water can't move freely the motion or diffusion is restricted diffusion weighted imaging images how much the diffusion of water is restricted in various tissues this is very clinically important if we look at this pulse sequence diagram here This would create a DWI image we have a 90 degree RF pulse here and a hundred eighty degree RF pulse here so this is a spin echo based sequence and there are these very strong gradients labeled eg for diffusion
gradients on either side of the 180 degree refocusing pulse these gradients are for all intents and purposes equal and opposite in direction in this pulse sequence diagram we're gonna get signal down here somewhere and because we have to apply these big gradients and these big gradients take time the te is gonna be from this 90 degree RF pulse to where this signal is detected so the TE is gonna be long enough because of these gradients that take some time that there's gonna be some level of t2 weighting effect to these DWI images remember longer te
emphasizes te f effect and we can't keep the te so short because these gradients take time so there's a long enough te to have some level of T to waiting on this diffusion weighted image we're gonna talk about that more in depth in a bit but first why do we apply these super strong gradients and why does this produce images that our diffusion-weighted if we apply a 90-degree RF pulse the nuclei Start to precess in phase in the XY plane as we have mentioned before if we apply a very strong gradient or magnetic field that
varies over space which is a gradient each of these molecules are nuclei here experiences a slightly different field strengths based on where it is relative to this strong gradient so we have a stronger magnetic field down here because of the gradient and a weaker magnetic field up here field strength is directly proportional to the precession frequency the larmor equation these nuclei are all going to precess at slightly different frequencies namely 3 is going to precess at a faster frequency and 1 at a lower frequency as a result the ones that precess at a faster frequency
or higher frequency are going to accumulate more faze if we apply now a gradient in an equal and opposite direction as we do here and in the interval time between the gradients these molecules or nuclei have not moved at all aka their diffusion has been restricted then they will be acted on by this opposite gradient and brought back into phase and signal now is maintained for these molecules with restricted diffusion however if we go back let's Say that after this first gradient again we have the strongest field down here and weakest field up here these
all accumulate different different phases as a result of faster or higher frequency down here and a lower frequency of precession up here so again they accumulate different phases now in the interval time before we apply the second equal opposite gradient these molecules are nuclei happened to move so they've moved from this position to this position now we have three at the top here one at the bottom they've diffused through Brownian motion and their diffusion has not been restricted then when we apply the equal and opposite gradient and they accumulate phase based on where they are
these are clearly gonna remain out of phase and when they're out of phase in the XY plane they're not gonna produce any signal and the signal is lost from these tissues that are not restricted in their diffusion so if that's confusing don't worry I just wanted to introduce the basic concepts what is more clinically important is what things that restrict diffusion look like on imaging so things that have restricted diffusion are gonna look bright on DWI Images for the reasons that we just described and on ATC Maps or apparent diffusion coefficient maps they're gonna look
dark ADC maps or apparent diffusion coefficient maps are calculated based on to DWI images at different diffusion strengths or different B values and we'll talk about that in a bit the ADC maps display the diffusion coefficients themselves so things with lower amount of diffusion aka diffusion restriction are gonna have lower signals they diffuse less something that restricts diffusion again is going to be bright on DWI and dark on ADC remember we also mentioned that DWI images are spin echo based sequences that have some background t2 weighting so something so if we just had this DWI
image and we had this bright thing over here for example we don't know based on that image alone if it is due to diffusion restriction itself or due to background t2 of effect itself and that's why we need the ADC and need to look at both of these if it's bright on the DWI and bright on the ADC it's not true diffusion restriction the bright signal on the DWI would have been due to t to shine through effect the last technical thing that I Want to mention briefly about DWI is the concept of B value
the higher the B value the stronger the diffusion effects if you have a DWI sequence with a B value of zero then there are no diffusion effects and you're essentially looking at a t2-weighted image higher B values mean more of a DWI effect and less of a t2 effect this becomes important and this becomes important in things like prostate imaging and this is a prostate cancer in these images up here prostate imaging requires B values of over 1400 to adequately assess for cancer if that's too much just remember again that things that like to restrict
diffusion are bright on DWI and dark on ADC DWI images are extremely clinically important it's important to know what things restrict diffusion the most common thing that we use DWI images for in body imaging is to detect cellular tissues namely and most commonly tumors DWI is invaluable in tumor detection and tumor staging for example in rectal cancer cervical cancer etc and we'll talk about that in another video other things that restrict diffusion include abscess ease and normal things like the spleen when looking at an abdominal MRI DWI images can be useful for a number things
and we've mentioned the tumor detection characterization and staging also they're helpful to detect lymph nodes they pop out on DWI images as well as multiple other things I know that this has been dense so far but we're almost out of the woods and ready to look at abdominal MRI in comparison to msk and brain MRI abdominal MRI had initially been slower to develop this is because most of the basic MRI pull sequences that were initially done were very slow they took a long time this was not amenable to imaging in the abdomen where cardiac respiratory
and bowel motion results in pretty severe artefacts the development of fast pulse sequences was necessary for the abdomen and now that they exist they've been used in abdominal MRI for quite some time so we're gonna review fast t1 weighted imaging in another phase image and fast t2 weighted imaging and MRCP and these are the pulse sequences that essentially are the foundation of an abdominal MRI study fast t1 weighted imaging occurs through gradient echo based sequences as we mentioned before gradient echo is pretty susceptible To magnetic field inhomogeneity ie a loss of transverse magnetization due to
D phasing of precessing protons the longer we wait the more that they are going to deface so an important point is that susceptibility artifacts are worse at higher T DS if we wait longer for the echo and we have longer echo times there's going to be more D phasing due to magnetic field and homogeneity so we can minimize this by shortening echo x and that's actually perfect for t1 weighted imaging because remember for t1 weighted imaging we want to use short TRS to emphasize the t1 effect and we want to use to ease as possible
to decrease the t2 effect on imaging the second thing that we can do that's important that makes things much faster here is we can use what are called partial flip angles I the sum value less than ninety degrees instead of every cycle having to wait for relaxation to occur all the way from the transverse plane and all the way back we really only need to partially excite the protons this allows for the next RF pulse to happen more quickly and so you get a shorter TR or shorter time to repetition the shorter TR allows us
to Have a shorter overall acquisition time fast t1 weighted imaging is used in abdominal imaging for 2d and 3d t1-weighted images or t1-weighted sequences the 3d ones are often used for post contrast dynamic imaging for example through the liver when we're characterizing tumors these are some examples of some t1 grate and echo based sequences that we use in abdominal imaging and these are some examples of 3d versions of these sequences and it's not important to memorize these names but just recognize them they're all going to be different based on the vendor of the MRI machine
for example SB gr refers to a spoiled gritty and echo type sequence by lava and thrive again depending on your vendor you're gonna know that you're looking at 3d t1-weighted images and then you're gonna see dynamic post contrast images as well okay let's move on to this important concept in and out of phased images this is very important in abdominal MRI we mentioned earlier that protons in fat precess slightly slower than protons in water and what that means is that while processing in the XY plane there are going to be points in time when the
protons from Fat and water are going to align or are in-phase and additive and there are going to be times when they oppose or opposite in directions or are out of phase and subtract from one another this is the principle of in and out of phase imaging out of phase imaging displays water signal - fat signal or the difference in the two and in phase imaging displays water plus fat or the additive signal of the two practically speaking for imaging this means that any voxel or volume pixel or little cube of tissue that has both
water and fat hydrogen nuclei in it are gonna look bright on the in phase images and dark on the out of phase images we perform these with a dual echo gradient echo so it's just like the fast gradient echo that we showed you earlier but we collect both of these echoes at the same time in the same acquisition we acquire the out of phase and then the in phase at one point five Tesla these are the times that we generally acquire the mat so out of phase at about 2.25 milliseconds and then in phase at
four point five milliseconds and again because they're in the same acquisition they're gonna be perfectly registered to one another and You'll see what that means when we open up an MRI relatively shortly so let's look at some in phase and out of phase images so here on the Left we have an in phase image and the TE is displayed and here we have an out of phase image and the TE is displayed and right away with looking at these images you can tell that this one here is the out of phase image and this one
is the in phase image and the way that we tell is that the outer phase image has this dark line that surrounds these abdominal organs for example or any tissue here so what is that dark line a dark line is called the India ink artifact and essentially this happens because at the edge of any of these tissues like the spleen for example here there's an interface between a water containing spleen and the bulk fat around it so any voxel that's at the edge of this spleen here is going to contain water nuclei from the spleen
and fat nuclei from just around it and it's gonna drop out it's gonna drop in signal on this out-of-phase image because the water and fat protons are gonna cancel each other out in that particular voxel so knowing that if we're looking at the liver For example on these images we see that the liver is relatively bright on the in-phase image and on the out-of-phase image we lose signal this isn't keeping with a fatty liver when you have a drop of signal and tissue on the out-of-phase image we generally refer to that as containing intra voxel
fat tiny amounts of fat smaller than the size of each of the voxels or volume pixel each voxel has water and fat molecules within it notice that the fat in the subcutaneous tissues remains bright on both that's because this is bulk fat so on this image here on the story on the in-phase image you're gonna have water plus fat so zero water plus one fat is one and here we have the difference and the difference between 1 & 0 is 1 so the signal is gonna be the same so the signal only drops on the
out-of-phase image if you have both water and fat within a voxel the other thing that I really want to emphasize is that the out of phased images are acquired first at an earlier te these are gradient echo based sequences and as we mentioned earlier gradient echo is susceptible to susceptibility artifacts and these artifacts increase with increasing tes As with longer echo times is going to be more time for the precessing protons 2d phase when you have magnetic field inhomogeneity so at longer T YZ we're gonna lose signal if you have susceptibility artifact one thing that
creates susceptibility is the presence of iron molecules if someone had iron deposition on the liver for example which is gonna happen with hemochromatosis or chemo siderosis we're gonna expect a lower signal on images with longer TVs or longer echo times so we'd see a reverse of this picture of this fatty liver right the image looks longer te aka the in face here is gonna actually be darker and the out of phase is gonna be relatively brighter that's why it's crucial that the out of phase is acquired first if it was in Reverse and the in
phase was acquired first and with a shorter te and there was a drop in signal on the out of phase image we wouldn't really know if that was due to fat because they're out of phase or due to iron because it has a locker T II if you take away one thing from this slide know this you got to know how to detect intra box'll fat and iron slash susceptibility artifact on the in and out Of phase images namely if it drops on the out of phase image it's fat and if it drops on the
in phase image then its susceptibility artifact like iron now moving on to fast t2 weighted imaging in order to image with t2 weighted contrast our te is going to be longer so we generally have to use spin echo based sequences in t2 body imaging to minimize susceptibility artifact the problem with this is that conventional spin echo base sequences take a super long time and that's not really feasible in body imaging because things are moving and people can only hold their breath for so long in fast spin echo during each repetition of the entire pulse sequence
there are multiple refocusing pulses and these multiple refocusing pulses are used to create multiple echo these multiple echoes helped us collect multiple phase and coding steps or to simplify multiple rows of data essentially are calculated or collected stored in a single step as a result we can collect the data for the image in less repetitions and the scan happens much more quickly this is what a fast spin echo sequence might look like the number of refocusing pulses and Therefore the number of echoes collected during each repetition is called the echo train length so here it's
three the longer the echo train length the shorter the scan a fast bin echo can be acquired in several ways one common way in the body that is really good for reducing motion artifact is called a single shot fast spin echo so an SS for single-shot FS e for fast spin echo this is a fast spin echo sequence that collects an entire slice of data following a single RF pulse so we have a single RF pulse and then multiple refocusing pulses and equatorial links have over a hundred after a single RF pulse and we collect
an entire slice of data and so that's all that's meant by a single shot fast Mineko or SS FS see that you'll see in your abdominal MRI protocols haste is essentially the same thing a J stands for half Fourier transform again it's just another way to make the signal or the sequence faster and ste stands for single shot turbo spin echo and turbo spin echo is essentially the same thing as fast spin echo again depending on the vendor the main advantage of single shot fast spin echo sequences is that because you would acquire an entire
slice At once each slice is very insensitive to motion and it's very fast so you're not gonna get much motion artifact on any individual slice in body imaging we cssf se scout scans so we use them force note images usually the initial t2 weighted imaging is performed using single shot techniques and then certain types of MRCP can also be done this way as well so since they're so fast they can be used without the patient having to hold their breath but since they're so quick generally we acquire them by having the patient hold their breath
and acquire all the slices in turn if the patient's unable to hold their breath and they move around slightly while they're trying to hold their breath you might notice that the image slices are kind of jumping you know that they're not perfectly spaced and that's kind of a hallmark of what you see when you're looking at single shot fast spin echo to two weighted images and we'll show you that a modern mr in a bit you can also have conventional fast spin echo images that can have better contrast and resolution if motion artifacts can be
reduced so a lot of protocols will also include a traditional Fast spin echo there are also certain artifacts that that can avoid but that's again beyond the scope of this introductory talk on these fast t2-weighted fast spin echo sequences remember fat is gonna look right and that has to do with the multiple 180-degree pulses the mechanism is beyond this talk we've mentioned this earlier but the principle behind MRCP images is to use a very long echo time or a long te to emphasize the t2 effect and in turn emphasize fluid signal this can be done
in different ways commonly done in more than one way first with a single shot fast spin echo with thick slices so thick slabs and you can do them in different planes or different orientations this is less susceptible to motion but you get pretty thick slices so other fluids build structures adjacent can kind of get in the way of our image and then you can do a 3d RCP which is a fast bennetto based sequence that is a 3d sequence with very high spatial resolution that can take longer to acquire and again will show you these
images shortly when we go through a normal MRI other practical notes that I think are worth noting for abdominal MRI one what does Flowing blood look like on these sequences without contrast well force pinnacle base sequences most of the time we're doing fast spinetto based sequences that are t2-weighted after a 90-degree RF pulse most of the tissues are gonna have signal in the transverse plane because we just applied an RF pulse if we have flowing blood on the other hand that leaves the slice and is replaced by blood that has no mr signal in the
transverse plan and it's all on the longitudinal plane then there's gonna be no signal say in the aorta so this is a t2-weighted image and you'll notice that the aorta with flowing blood is extremely dark for t1 gradient echo based sequences with short TRS blood entering the slices are gonna look bright okay this is because blood entering the slices has all of the magnetization already in the z-axis or in the longitudinal plane and as we mentioned that's essentially as if they had a very fast t1 relaxation like fat so essentially in flow is gonna look
bright on these t1 grating echo based sequences and so you often see this in the aorta here for example at the superior aspect or the upper slices in the abdomen and Then in the lower slices in the abdomen towards the feet you're gonna see it in the IVC because venous blood obviously is gonna flow from the legs and up towards the heart if you were to scroll down in this image though for example this bright signal would decrease and you also notice that none of these organs are enhanced there's no contrast in the kidney so
these are in fact neuron contrast images but it's a common pitfall and common fake-out it looks like a contrast image because the aortas bright but it's not this bright aorta is due to this inflow enhancement that is an artifact we don't have time to get into an in-depth discussion of Mr artifacts but I really encourage you to read the appropriate essential topics again there are links in the description and I've also attached a link to a table that summarizes MRI artifacts and things you can do to try to fix them in the description the common
artifacts include ghosting from breathing wrap around artifact or aliasing artifact flow artifacts on SS FSC images as well as susceptibility artifact that we describe briefly as well okay so we've made it past a whirlwind Overview of some of the basic concepts and we're ready to get into a practical reading of an abdominal MRI so we're gonna finish this video by going over first a typical MRI protocol then we're gonna go through a normal abdominal MRI scan and show you these images and what they look like and then we're gonna go through an abnormal study so
first a typical abdominal MRI protocol so usually there are Scout images that cover a greater amount of anatomy and the focus of the abdomen so usually you have to look at these to make sure you're not missing anything that you might catch outside of the imaging field of view you have then most sequences start or most MRI protocols of the abdomen start with t2-weighted single shot fast pin echoes usually in multiple planes so for example axial and coronal t2-weighted single shot fast pin echoes then usually there's at least one true T to fast spin echo
and this is often done in an axial plane we then perform MRCP images so single shot fast Mineko thick slab MRCP s we mentioned earlier and 3d respiratory gated thin-sliced mr CPS so essentially these are those high-resolution 3d mr CPS that we're going To show you we also perform in and out of phase t1 reading echo base sequences and we showed you what those look like earlier and then we have our 3d dynamic contrast enhanced images so we have a t1 greeny an echo 3d sequence and it's usually fat saturated we have a pre contrast
image a dynamic arterial acquisition so usually multiple arterial phase images to catch what the contrast is doing over time early on we then have a portal venous phase acquisition and a delayed acquisition that are all post contrast images we then also acquire DWI and ADC images are calculated based on these and so this isn't necessarily the order that they're acquired but I've grouped them in order to better understand and think of all of these sequences and make them appear simpler so we have our t2-weighted sequences our single shots and our conventionals we have our MRC
PS that are looking at the ducts we have our in and out of phase two one weighted image we talked about that in detail and then we have essentially our pre and post contrast 3d t1-weighted images and our diffusion-weighted images that we also discussed in detail so you should understand what this means Now when you look at all of these sequences and this should be more clear after our discussions so far so now let's look at normal and abnormal abdominal MRI scans and see what the images look like okay so this is an abdominal MRI
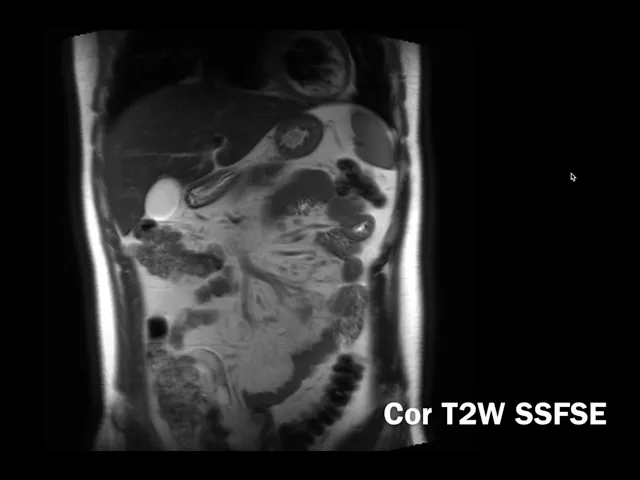
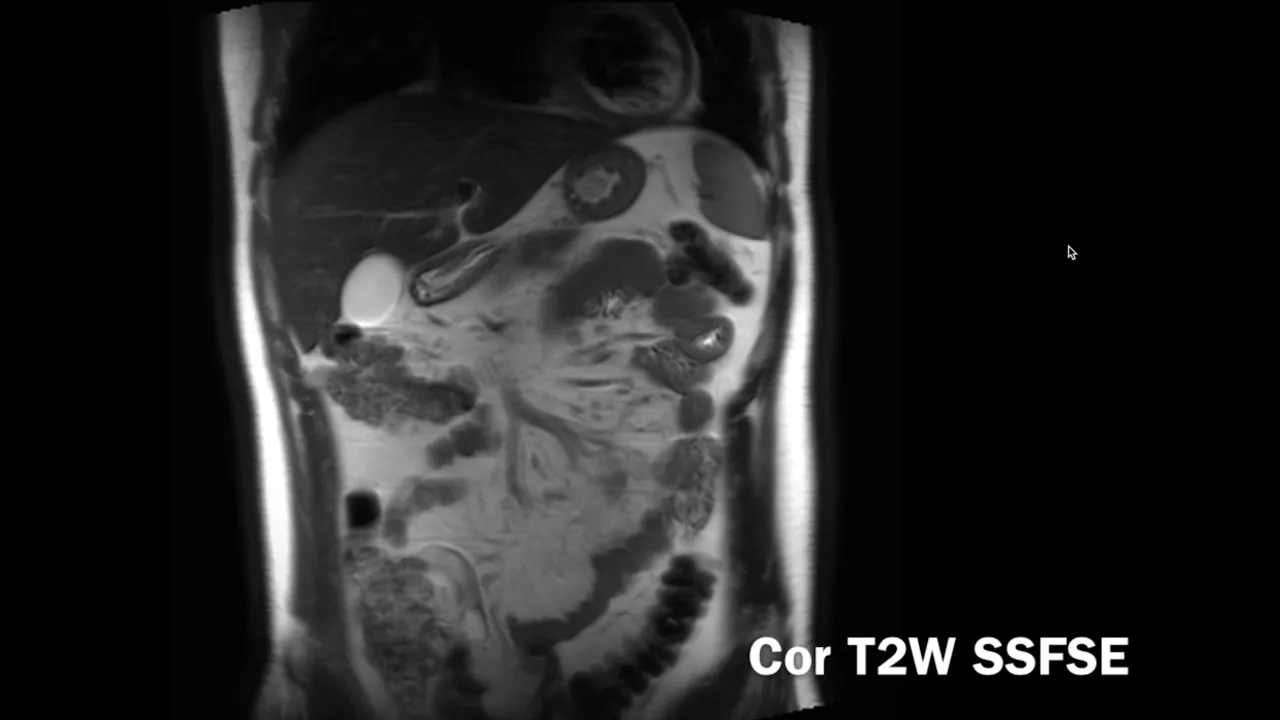
study and we're gonna go through each of the sequences that we discussed in order we'll skip the scout slash localizer sequences and start with our single shot fast Ben goes so this is a t2-weighted single shot fast Mineko coronal image and we'll scroll through this and you see it's t2-weighted so the CSF is bright the fluid signal in the biliary system and the gallbladder is bright the liver is relatively dark notice that the kidneys spleen adrenals and pancreas here that's all the pancreas right there are relatively dark on t2-weighted images this is not fat saturated
lesions in general for most things are gonna be bright in comparison to these organs so most of the time you're gonna see things that are brighter than the pancreas or brighter in the liver or brighter in the kidney there are exceptions but that's what we're looking for and these organs look pretty much normal on these notice that these are single shot images So they're relatively insensitive to motion relatively good images but notice that when we scroll through it it's not always perfectly placed no this is a pretty good example on a young patient who is
cooperative but sometimes in patients who can't hold their breath they jump around a little bit more but you can kind of tell it's a little different than what you're used to with the CT there's some you know irregular jumps for example this here is the axial single shot fast Mineko SSF SC or haste so again not fat saturated here large tissues like the liver spleen liver is darker pancreas is relatively dark fluid signals to be relatively brights or things like the gallbladder the bile ducts stand out very well you see there's no biliary duct dilatation
you can see what normal kidneys look like you also notice that there is very dark vasculature remember we talked about why that was when we talked about what flowing blood look like on these sequences next we generally perform a t2-weighted image with fat saturation this happened to be done as a single shot fast but nickel as well this was a haste image and so You can see that because all the fat is so dark the fluid signal stands out quite a bit more so you're gonna look for things like edema so for example if there
was pancreatitis you might see a lot of bright signal and the fat surrounding the pancreas that we wouldn't have seen on the earlier t2-weighted images so the fat saturated t2-weighted images are really good for looking at fluid and specifically edema next we talk about our MRCP images and so as you can see our MRCP images are just very heavily t2-weighted images so things like the duodenum here that's filled with fluid is gonna show up as bright but what we're trying to focus on here is the biliary system so this is the CBD that's quite beautifully
imaged we have our inter paddock ducts here with our left two pedak ducts going to the left lobe here and our right hand patek ducts on this side over here so I'm anterior into the left here that's the left to Patek duct and left main bile duct on the right here we have our right duct and our right anterior duct goes on a more oblique angle like that let's see that's our right anterior duct now right posterior duct is often more horizontal So in this plane so notice that you follow that that's our right posterior
duct and it inserts right here before it joins the confluence and then becomes the common duct and then later the common bile duct after you have your cystic duct here you can also see the pancreatic duct here it's not seen as well because it's so small but you can see that it's non dilated here as well we then have our Internet of Fay's images so this is this is the t1 gradient echo out of phase image so you can see it's theater phase image again you have this India Inc artifact surrounding the organs due to
the India Inc artifact as a result of having voxels with water and fat molecules within or a nuclei within that cancel out notice the subcutaneous fat remains bright because that's bulks that not intra box'll fat so this is the out of phase image acquired first this is the in phase image acquired second with a longer te the liver is quite a bit brighter than it was on t2 so most things are gonna look t1 dark in comparison to it I notice that the pancreas is quite a bit bright as well and so most things are
gonna look dark in relationship to the pancreas we're gonna Have our fat saturated pre contrast t1-weighted image okay so this is fat saturated the fat is dark and no contrast has been given yet this is a t1-weighted image okay this is our creating echo base sequence and we're gonna give gadolinium and then do multiple sequences but notice how bright the pancreas is on t1-weighted images so we talked about the liver I was bright and how things are in the look dark in comparison but the brightest Oregon on t1-weighted images in the abdomen is the pancreas
and look how beautifully it stands out here and how bright it is and you have things like chronic pancreatitis the entire pancreas can start to look a little bit darker and that's an earlier finding in chronic pancreatitis but the thing you're really looking for here is if it's very bright and you see a focal area or a focal lesion that's dark we know that that's abnormal and you want to look at a closer on the other sequences so the t1-weighted images are really good for looking at the pancreas and making sure it's normal then we
have our post contrast images so we have our dynamic arterial phase images and so here you can see that the contrast is now on Board we've given gadolinium we can tell it's an arterial we have typical tedward appearance of the spleen we know it's a good arterial phase because the arteries are well pacified we have great enhancement of the pancreas it's in a critical measure Larry phase the kidneys and specifically we have a pacification of the portal vein that's early and we have non opacification of the hepatic veins so early opacification of the portal vein
with no opacification in the paddock veins that's a good phase to look for arterial enhancing lesions like hepatocellular carcinoma for example so for example this is slightly later in this dynamic arterial enhanced image this is slightly later than that even you can tell the aorta is now less so pacified on the portal venous system is becoming more pacified this is still an arterial phase and a dynamic arterial phase image even later in the arterial phase so there are multiple dynamics here and then we have our portal venous phase this is at 70 seconds so our
portal vein is now well O pacified we have a pacification of the iPad ik fans here the spleen is more homogeneous and we can see How our pancreas our kidneys and everything else looks and at this point the enhancement patterns are somewhat similar to what we're looking for on CT we then have our three-minute or delayed post contrast image here which is very important when we're characterizing certain things like if we had an abnormality you want to see what it looks like on these delayed images and we often perform a coronal post contrast image as
well this sometimes covers a little bit lower down than a little bit higher up than the axial so I like to look at this to not only look at any of their maladies and trying to characterize but also look at anything I might see in the pelvis the bones especially for enhancing lesion as well as any incidental findings in the lungs lastly we have our diffusion-weighted images so you'll notice right off the bat on these DWI images that the spleen is bright we mentioned earlier that the normal spleen restricts so the splenic tissue signal on
diffusion-weighted imaging is a good marker for what is diffusion restricting and so on DWI images this is bright here you'll notice that there are other bright things that are not Actually truly restricting like the gallbladder so this is that t2 shine through effect that we talked about so the spleen is truly restricting you'll also notice that the lymph knows as we mentioned earlier pop out really nicely so look at all these mesenteric lymph now it's here they pop out pop in and out of sight quite nicely and so this is a good sequence to look
at when you're looking for lymph nodes as well as characterizing lesions and looking for focal lesions of the liver for example if we were to look at the ADC to prove that this is restricting this is the ADC we see that the spleen is dark on the AC it was bright on the diffusion-weighted images so this is truly restricting whereas if we look at the gallbladder the gallbladder was bright on DWI and bright on ADC that's just T to shine through that we talked about earlier okay so that's it for a normal abdominal MRI and
we've gone through the sequences showing you what the tissues generally look like a normal I'm Arab demand let's go through a quick case and then we'll call it okay so this is a quick case that does have abnormalities in it and we won't go through Everything but we'll go through it briefly these are the localiser images so you can see that they cover more ground and you can see more things you can see that there's some cystic lesion here in the pelvis for example and already you can see that there's something that's quite big in
the liver so we'll get to that in a sec so if we again start with our coronal SS FSCS these are single shot fast Bennetto is t2-weighted again the liver is relatively dark and abnormalities often stand out as being quite right so this is an abnormal lesion and the liver that's slightly t-tube right her t2 hyperintensity lab normalities here in the liver this is a very slightly t2 hyperintensity so intense to background liver and the there's a central area here that's a little bit t2 brighter then notice again things like fluid are bright the stomach
the CSF we can look in so you can see tiny cysts and the kidneys for example it looks like most of the action is in the liver based on this overview if we look at our axial fats at images we definitely see that this is quite hyper-intense this lesion in the liver this is in segment 7 here posteriorly there are multiple other liver Lesions here my interiorly integrin 8 as well as down here in segment 5 we have this other lesion here that's quite I so intense - background on t2 and has this central t2
hyperintensity R we want to look at the Internet of Fay's images closely here whenever we're characterizing liver lesions especially we want to look for intra box'll fat because I don't change our differential diagnosis here on the out of phase images there's no background fatty liver of course we compare to the in phase and usually look at them side by side so here on the in-phase images we can see that this is slightly t1 hypo intense posteriorly here and these ones are slightly do you want to hyper-intense this one is relatively to one eye so intense
this is the one with that central scar and none of them had fat none of them looked darker on the out of phase image images that we just looked at we look at our pre contrast image again really nice pancreas you know bright the pancreas is abnormalities would look dark in comparison and we can see what our lesions look place can deliver pre contrast and then we give contrast and this is an arterial phase image so the artery is quite Little pacified the portal vein is ou pacified and the paddock veins are just starting to
apostatize this is a little bit late but you can see that this lesion down here demonstrates arterial enhancement around a non enhancing central scar these other lesions there are multiple of them but let's focus on this big one for now it's one that was quite t2 hyperintensity real enhancement it's a little bit more heterogeneous and there are non enhancing areas as well there are multiple other lesions that are also arterial enhancing actually I should mention that this is a EMS study so we didn't give normal gadolinium contrast or purely extracellular gadolinium contrast that we're used
to be using in MRI Nia vist or prema vest is a 50% extracellular contrast agent and 50% 50% to petal biliary agent that is excreted in the petal biliary system so we look at these lesions on a 20-minute iya missed scan or a petal biliary phase and you'll see that there is contrast in the biliary system because you've missed or these pedal biliary agents are excreted in the biliary systems we also noticed that some of these lesions namely this lesion down here that was quite I so Intense at a central t2 hyperintensity are takes up
do vist quite avidly as well as this one up here and all these other ones don't especially this one posteriorly here that was quite t2 hyperintensity Rajini asleep enhancing on the arterial phase and takes up no ear vist so this is a young female patient and again the purpose of this is not to show you how to characterize liver lesions we'll talk about that later but the purpose is to know what a normal MRI looks like and then show you how things stand out nicely compared to background on these various sequences but this these lesions
here are predominantly mostly at enormous especially this large one posteriorly this lesion here more inferiorly is more confidently an fnh or focal nodular hyperplasia the taking up of the August alone does not make that determination certain types of adenoma is like beta catenin and planetory adenoma as can't a copy of issed but the fact that this has relative ISO intensity to background pattern of arterial enhancement it's t2 hyperintensity retainment of eovist on hepatobiliary phase are all in keeping with this being in fnh However this patients main problem is that they have multifocal adenoma okay this
one is quite big in over five centimeters so patients do that a nomas are at risk for bleeding and later down the road can transform into malignancy the rule of thumb is often that adenoma is over five centimeters should be surgically removed if they can be if they're confidently I don't know Mazon imaging in a young female patient for example without other risk factors for hepatocellular carcinoma or HCC then smaller out of nomás that are less than five centimeters can be followed up if the patient especially is on oral contraceptive pills which is a risk
factor for these they can stop the OCP and follow it up shortly and see if they reduce in size but again that's well beyond the scope of this talk I just wanted to show you an example of one abnormal MRI and how we can look at all these sequences to try to determine when we're looking at we'll talk about the specifics later again future videos are gonna look at characterizing liver lesions we'll have a liver MRI video we'll also put out a pelvic MRI and a MRI video as well To help you approach those studies
okay so that's it for now I hope this was helpful thanks a lot