Okay let me utilize definition from Henry's clinical diagnosis and management by laboratory methods 22 Edition of quality control quality control also called statistical process control is a what a process to periodically examine a measurement procedure to verify that it is performing according to pre established Specification Ver and very powerful definition all right since Henry mention about statistical process control um We are talking about statistical quality control then we have to review take not we have to review some statistical terms the first one is mean What is mean easy the average set of values used in
calculation to determine bias It's a primary indicator of accuracy and it measures systematic error and here's the formula for the mean about standard deviation It's used to measure distribution or scattering of group of values around the mean It's a primary indicator of precision as um opposed to mean primary indicator being primary indicator of accuracy and standard deviation measures random error and here's the formula Don't worry We will not be calculating mean and standard deviation It will be provid to us gaan distribution is the third term here in Statistics It's a review gaussan distribution or normal
distribution This is platted frequency versus measurement and gaussan or normal distributed data are described as Bell shape curved symmetrical points cluster around the mean This is the mean more points around the mean more points like closer to the mean farther away from the mean the fewer data points exist see farther away the fewer that data and of course the measures of central tendency are the same number the measures of central tendency are the mean median and the mode so in gaussian distribution those three are the same number fourth confidence limits This is another term now
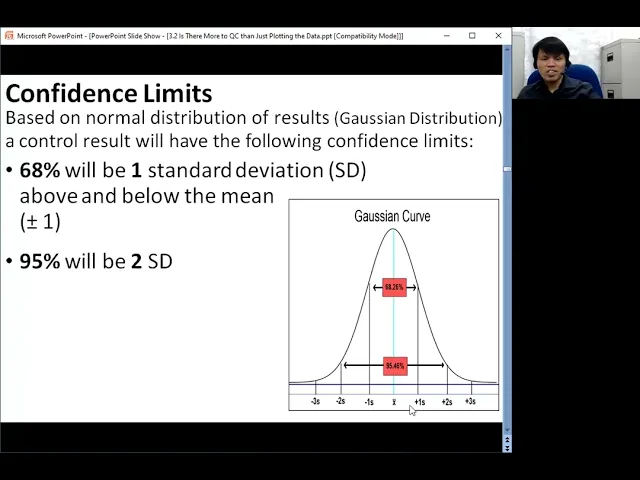
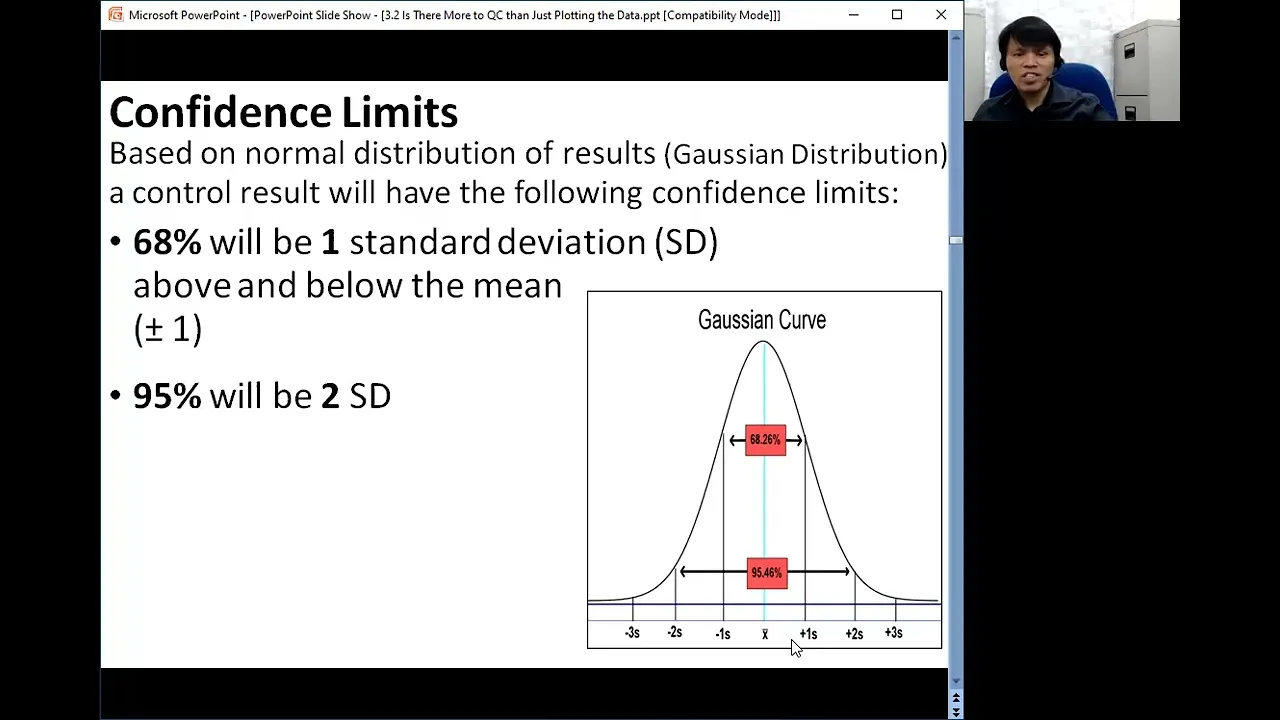
this is based on normal distrib based on the normal distribu distribution contrs will have the foll confidence limits the first one 68% will be one standard deviation above and below the mean easy that's 68% confidence limit one standard deviation above This is your mean and below thean 68% limit 95 per will be two standard deviation above and below the mean easy that's plus or minus 2 SD and lastly we have 99% will be 3 standard deviation above and below the mean that's 3 plus or minus 3 standard deviation as far as quality control is concerned
the important confidence limit is the 95% limit plus or minus 2 SD All right let's Look at it again the confidence limit so 68% is plus 1 SD above the mean and 1 SD below the mean that is the span of your 68% from here to here 95% 95% is from -2 SD up to + 2sd and the span of three standard deviation below the mean up to 3 standard deviation of the is the 95 I'm sorry 99.7% confidence limit All right if we put this gaussan distribution This Way like this way right again let
me do that um gaussan distribution put it sideways and relate it to this Oh that's the LJ char lev Jen chs basically here you have an LJ chart that has to follow the distribution of this data will have to follow a gaussian distribution are you with me all right so as I have said um as far as our discussion is concerned our Focus would be which confidence limit the 95% confidence limit All right Is that clear Thank you