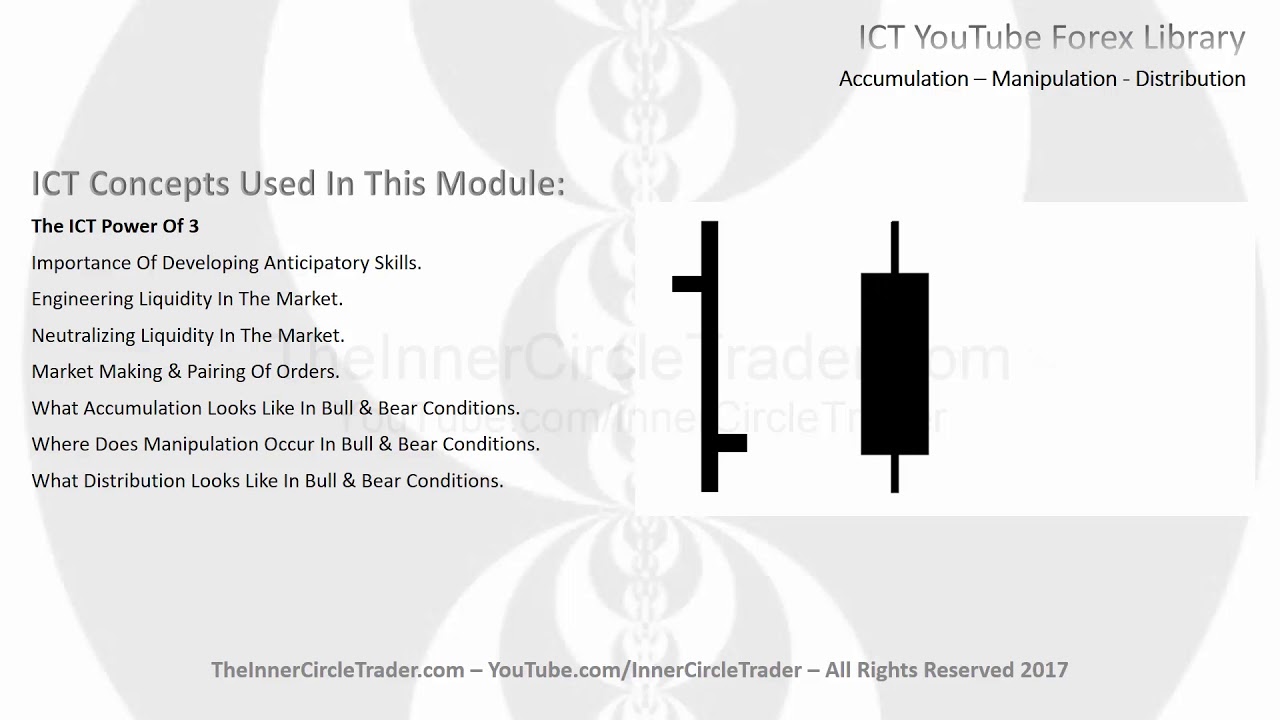
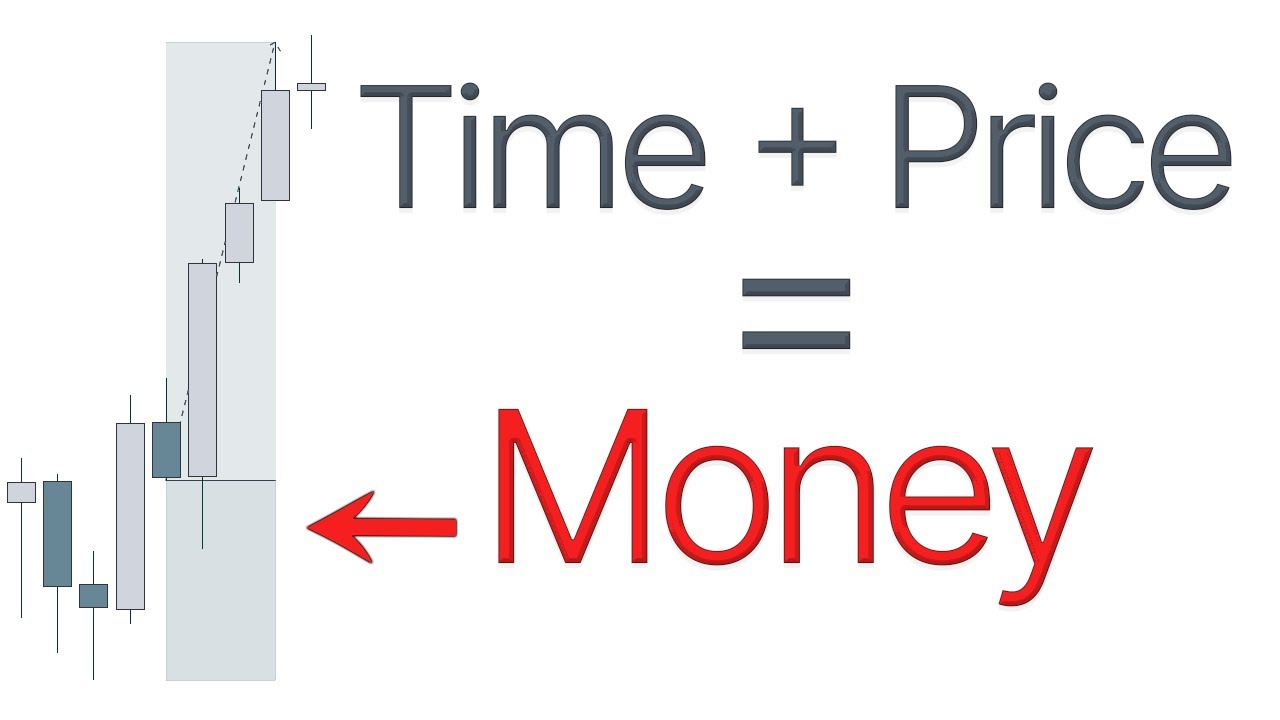
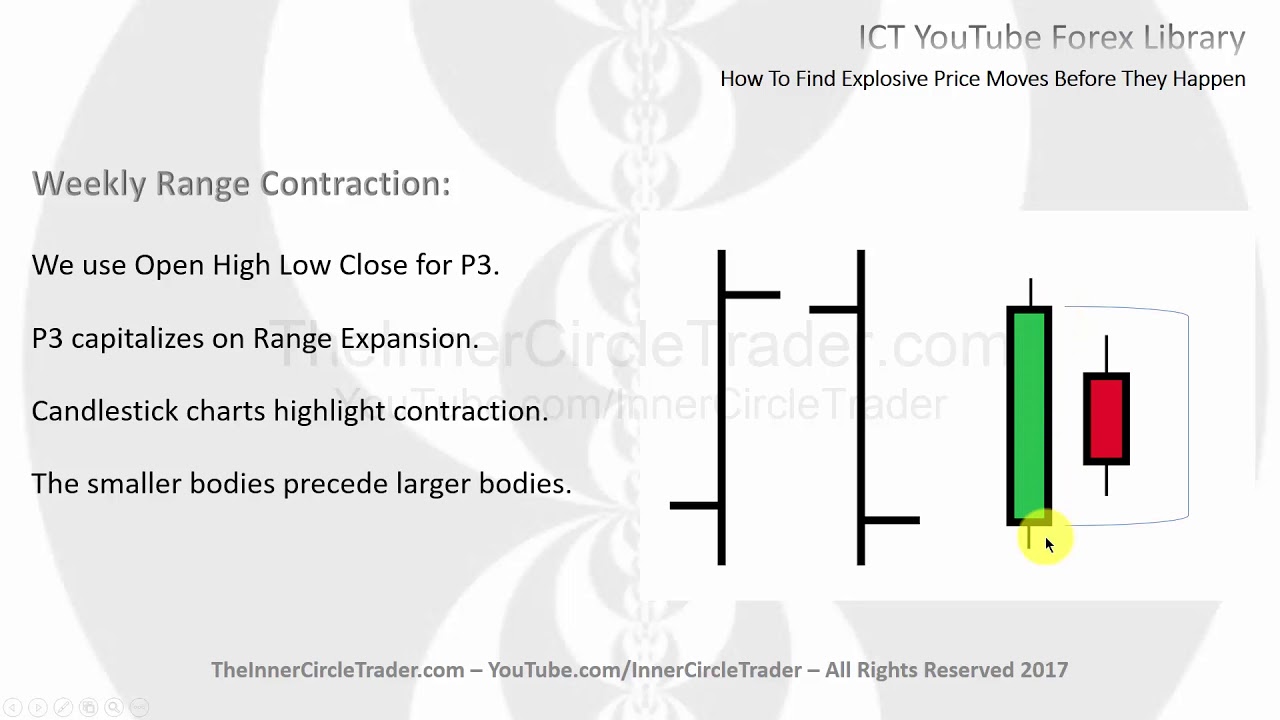
okay folks welcome back this teaching will be specifically dealing with time and price theory now while this is going to be a generalized overview and more or less an introduction to time and price theory as I teach it it's a very vast subject and I go into greater detail in my free tutorials and in greater detail in my premium mentorship but I think you'll find this teaching will be beneficial to you nonetheless okay folks everything you seek in price action is found in this formation the open high the low and the closed the ICT concepts
used in this module will be the importance of time and price we're gonna be revisiting the power 3 and we're specifically teaching monthly time and price characteristics weekly time and price characteristics and finally daily time and price characteristics ok ICT power 3 and the monthly open now price action is fractal in nature that means everything that you can see in terms of a price pattern on a 1-minute chart on a 5-minute chart can be seen on a monthly chart or we clean any time frame and any interval of time measurement that plots price the fact
that we can see a pattern on any specific timeframe price action has a generic characteristic to it so whatever we see on one time frame could be easily replicated and seen on a lower timeframe or a higher time frame so when we see price patterns it's not that one timeframe is better than the other per se but there is an emphasis or significance that's placed on the higher time frame charts over the lesser time frames for instance the monthly has the most significance to me and my analysis and because it gives me a the ability
to look at a whole year or multi years or I can look at it from a quarterly basis or a biannual basis and always in six months of intervals so I don't need to see any other time frame because the monthly gives me all the depth and detail that I would ever need from a macro standpoint which brings me to the purpose of using a monthly chart is that it provides a macro institutional bias so we can see what large institutions are doing or what their sentiment is based on what these higher timeframe monthly charts
are revealing in price action in a nutshell if we are doing our analysis on the monthly chart and we deem that monthly chart to be bullish we as traders and analysts we look for buying opportunities at the opening price or below the opening price if we have come to the conclusion that the monthly chart or perspective on the monthly is bearish then we are focusing our analysis on selling short at or above the monthly opening price now large institutions use algorithmic systems that key off of monthly and weekly opening prices since there are massive amounts
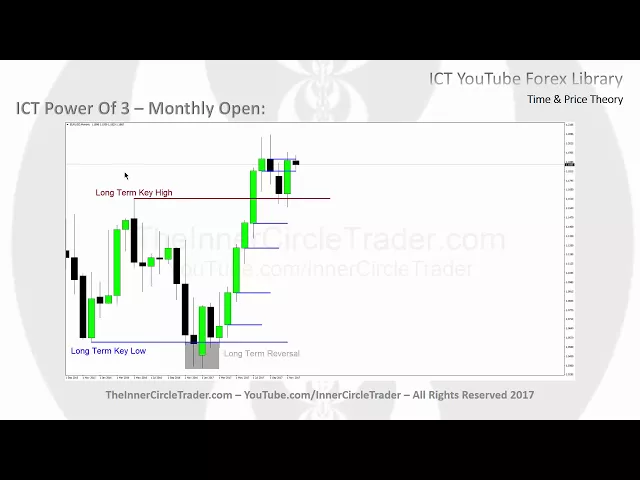
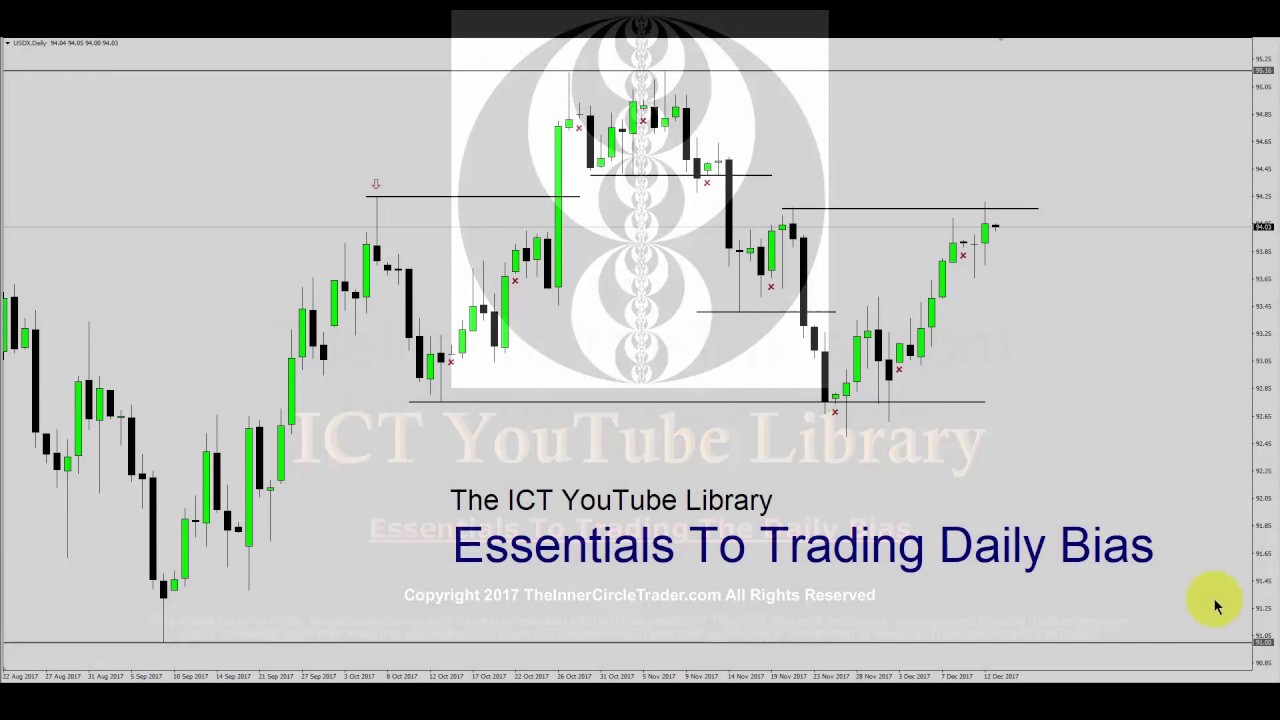
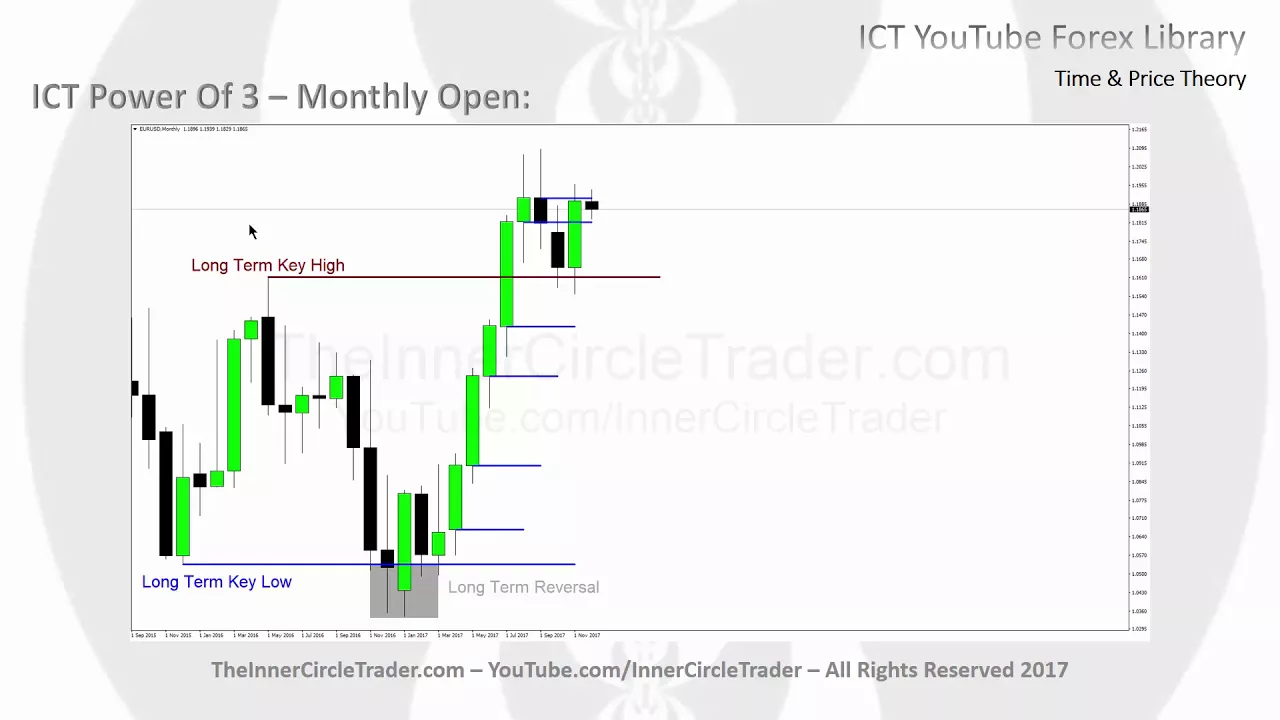
of volume in these entities actions we would do well to imitate or mimic their actions and directional bias so let's take a closer look at this monthly chart this is the Euro Dollar and if you go in through my material there's a lot of things that I teach by way of directional bias picking a direction sticking with a specific direction looking for key levels looking for key targets looking at this sample size of price action on a monthly basis for the euro dollar I want you to take a look at what you're seeing in price
action now obviously majority of what's already happened is all hindsight but it's for your learning for the individuals I've gone through my mentorship in 2016 2017 they know that I was bullish in the first quarter of 2017 with the euro dollar and I called a specific price point of 120 at that time several months later here we are in December of 2017 you can see we did in fact hit one twenty mile marker on the Eurodollar it was based on what I'm about to show you here a lot of other things they go along with
it to help fine tune that detail but generally it started with this concept so do you see anything that stands out in the chart for instance this old low over here they're relatively equal price makes an attempt to drop lower and it does in fact go below these equal lows and then it does what it trades back above those lows and then we have a swing low form we have a candle to the left with a higher low a candle in the center and it can look to the right so there's our three bar pattern
or swing low and then we wait for that third candle to be penetrated we have it here so that way now we can start looking for being bullish on the monthly chart for the euro dollar we see the previous month even though I had a weaker close it still was a up close and because we broke the swing pattern for a swing low to be without valid every subsequent candle should be viewed as bullish until we get to some key resistance this isn't key high it's cause they market turn so we're gonna have to keep
our focus on here and just like we saw market movement go below this low here true support resistance isn't lining this and it can't go any higher than that we understand that there's going to be a one so I want to go through that high to seek some measure of liquidity just like it looked for liquidity below these lows so if there's ideas in mind let's add some lip stick to this chart so now we have a long term key low here and we have a long term reversal in the form of a false break
below swing low forms and then I started delineating all the opening prices on the subsequent months so every one of these candles represents one full month data and then I noted that long term key high here so we would be looking for it down a move above this high which if you think about it that is a lot of pips so I know I've been doing a lot of work on Twitter and on my youtube channel to be active with day trading and scalping just to show my proficiency in studying and reading price action and
executing on there's lower timeframes I have tools and applications that work on higher timeframe charts like this if you can't do day trading I have methods that help you do these types of things I personally do not like this style trading it's too slow and doesn't give me enough action and I just Excel as a short term intraday trader in teacher and short term traders for one shot one kill there are many students of mine that can't do that because of their businesses that they're running or their jobs or they're just unable to do it
because of their family commitments they just can't do it so they need a larger or higher timeframe perspective and this is one way you can do that so we have a monthly chart here with the opening prices after a swing low and a violation of an old low and once we try to start the trade back above that low here we start looking for validation with the swing low being in fact valid and we have that one this month here so we had plenty of times several months before this month begins the hunt for lungs
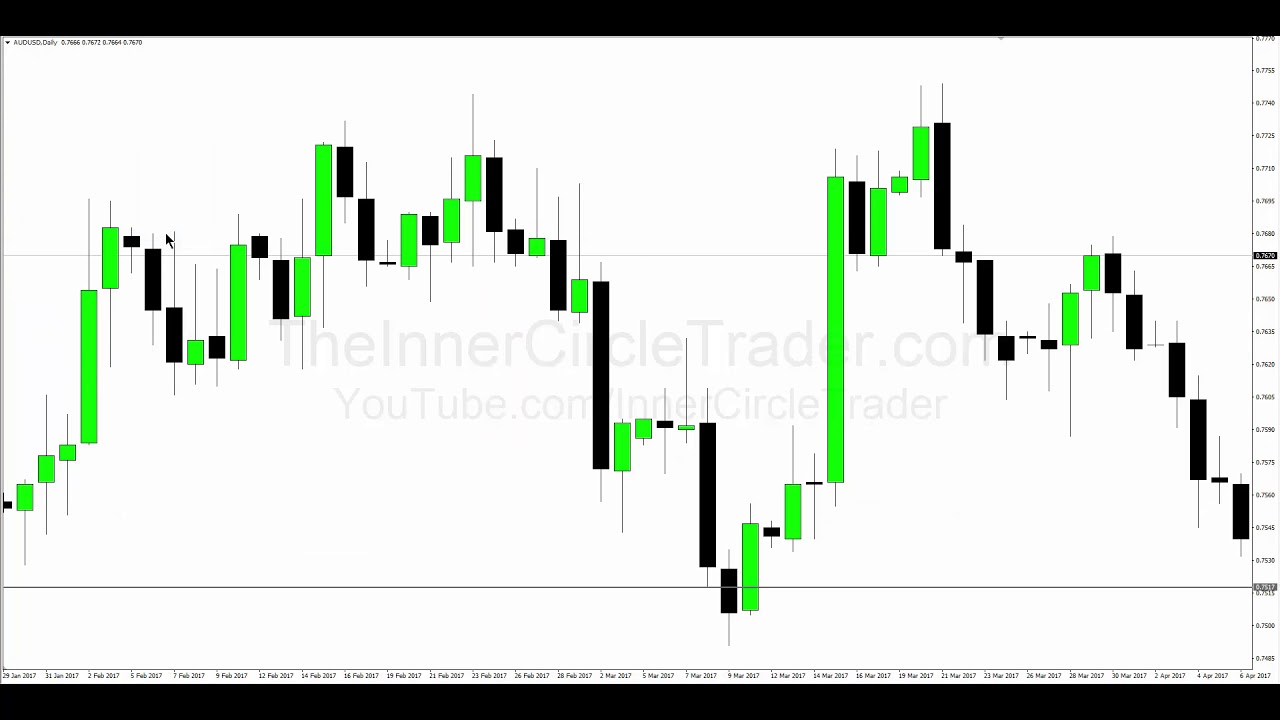
so it gives you lots of time to get prepared you don't have to be in front of your charts every five seconds in fact you don't have to probably watch it every day you just got to be aware that this swing low has to be validated and it does it here when it starts to trade above this candles high so with this information let's take a closer look and now we have the daily chart of the euro dollar and what I have here is every specific monthly opening price doing it with a small little horizontal
trend line segment so each little short trendline that's moving horizontally starting with this one here this represents a monthly open well it's the opening price it's a month and this isn't the other one this is another one this is another one another one and finally here's the last one I'm gonna reference in this specific teaching so we're going to start with April 2017 and we have seen a potential long-term reversal and we're gonna be looking for buying opportunities and we're gonna look for validation to see that in price action now for a bullish we want
to see signatures in price action that support that idea that means the opening price and below it we want to see some bullishness or buying so is there a swing low that forms below the opening price on the monthly and is it showing energetic price action once that low forms and does it move higher with magnitude strength and speed while we have that here and not too long after that we start seeing price move higher obviously I'm using this chart with the benefit of compensate for its time purposes to save a lot of time in
the recording but you can see that reference point there below the opening price of April gives us our nice buying opportunity you can look at many instances overlapping for optimal trade entry at that price point and we're moving to the next month this is May 2017 again we're looking at the opening price of May 2017 and we want to see a willingness to go below the opening price and then find buying we had that here and again very very strong reaction in price action and the market starts to move rather aggressively on the upside moving
right along we're going into the next month this is June 2017 and again we have the opening price of June and below the opening price we want to see buying we see that in fact does come to fruition here very nice accelerated movement on the upside and again now we have July of 2017 the opening price delineated and we want to see a movement below the opening price and then buying nice optimal trade entry long pattern there as well very very explosive price action up to that horizontal maroon color line that is that old long
term hi so now we hit that in the month of July at that price point now we have to start easing off large expectations of being bullish doesn't mean completely abandon the idea it just means that we have to slow down and not be so aggressive but we can be aggressive and looking for that long term highly betrayed to every previous month but now in July we can see price did in fact hit that level so we have to be mindful that could stop now the next month here is August of 2017 some similar pattern
we have movement below the opening price of August and again a nice little rally up and it moves well it moves about 400 plus points or pips above the old long term high so obviously we can't use a 10 to 20 or 30 pip sweep idea let me deal with intraday charts looking for movements beyond the old highs and lows or double bottoms and double tops when we were using longer turn timeframe levels we had to have a greater expectation of terms of the the magnitude or range of how far it will move past those
price points now I don't have a science to that I do use Fibonacci to help me get to those levels it's not always accurate sometimes it's it's all short of it and sometimes it goes beyond to what I thought was gonna happen and that's technical analysis and trading you're never gonna be perfect you're never gonna be right but over time you're gonna see that this method serves you very very well now we can take these ideas also and transpose them to the weekly opening price now this is going to be the framework for a lot
of the things that I teach in my mentorship for my one shot one kill which is essentially trading the weekly range now I'm not gonna be teaching that here but I will give you some of the signature points that will help you with the free tutorials to get really close to how I do one shot one kill but if you want to learn it you can go through the mentorship and get all the fine details about how to do and how I look for it get the weekly hiring the weekly lows well and if we
go through this specific idea with weekly opening price again price action is fractal and what we would see on a monthly basis we would expect to see that same thing on a weekly basis so the weekly charts provide an intermediate institutional bias that means it's not a long-term bias but it's not short-term either so it's a pretty good timeframe to look for like swing trades or even a little bit longer term short-term trades not just one or two day trades and duration longer term like two weeks to a month this is the perspective you want
to be looking for to get those types of setups but what we use for the weekly open if we know that our analysis leads us to a bullish weekly perspective we're gonna be focusing on buying at or below the weekly opening price when bullish and when we're bearish on a weekly we're gonna be focusing on selling short at or above the weekly opening price now large shifts in price that originate from the macro monthly bias will provide the framework - weekly opening price setups now here's a key point make sure you remember this because it's
not that every week and is gonna be bullish or bearish not every week we'll move in the macro directional bias but however there will be some weeks that move violently in agreement with the macro monthly bias so just like we have retracements on any other time frame we may be longer term bullish on the macro monthly perspective and the weekly we may be enduring some measure of retracement or consolidation because this chart shows four weeks of price action and I've highlighted or delineated the opening price for every respective week here and I want you to
take a look at the response that price shows below the opening price while we're bullish and then while price makes a really nice buying opportunity here in a green shaded area and it really Walt's higher price gets a little too far ahead of itself and needs to retrace so the next week so even though we have the weekly opening price and it does trade below it we have to be mindful that it may be needing to retrace deeper the following after a retracement slight consolidation we have another opportunity where Christ shares a willingness to show
buying strength below the opening price of the weekly range and again later in a week on Thursday at that particular week we see another opportunity after taking out the equal loads that were formed on Monday and Tuesday of this particular week there was two opportunities to by Monday and Tuesday offered profitability but then on Thursday ahead of deep retracement retracing down below the Monday and Tuesday is low but if you look at the previous week the Wednesday this low here - this high here this is an optimal trade entry long and it's nice houses overlaps
with a run on sell stocks below equal lows and we see a subsequent explosive move to the upside and in the following week on Monday of that week we see that does create a very nice buying opportunity and an explosive price movement ensues on Monday trading into Tuesday then during Wednesday and Thursday there's a retracement and in New York of Thursday has an exclusive price move again that's when we see it trade up into that long-term weekly high okay moving right along to complete this teaching we're going to be referring to now the opening price
on the daily so again price action is fractal and what we would see on other timeframes can be seen on the daily as well but the daily chart provides us a short-term institutional bias so in other words what the large institutions insurance companies and banks what they're looking at relative to the daily timeframe that's going to be their short-term now we look at a daily chart from an analyst standpoint because as day traders and scalpers the daily is like referred to as a hard time frame for institutional minded traders the daily is just like that's
their executable time frame that's where they're doing most of their work the orders are based around that time frame and that's why it's important to know previous day's highs and lows weekly highs and lows entry week eyes and lows and knowing what the liquidity reference points are there's specific levels that's going to help you in your development as a technical analyst but if we're bullish relative to the daily timeframe we are looking to be buying at or below the daily opening price and if we're bearish on the daily we're gonna be focusing on selling short
at or above the daily opening price now the market will gyrate higher and lower relative to the monthly and or weekly perspectives as we mentioned in the previous slides the highest probabilities and trade in the daily chart is when both the monthly and weekly support the trade idea that you would be using or hunting on dealing focusing on the elements of time and price will greatly assist you in analysis and overall development as a technical analyst if we look at this representation of a daily range here notice I'm only highlighting one specific day the teaching
that I just gave you here is not to promote the idea that if the monthly is bullish every week is going to be bullish below the opening and or every day is gonna be bullish below the daily opening equally so when the weekly is bullish it does not translate into every day below the opening price is bullish there's going to be times when you have to blend some analysis concepts to arrive at the highest probability setups even day trading is not every day trading I've said this so many times over the last 10 plus years
teaching just forex alone and I want to ingrain that in your mind that even though we have tools and I've shown this in the last two months online every single day finding a setup I do that to show you what's available in terms of opportunity and understanding I am in no way shape or form trying to promote the idea that you can find they setup yourself every single trading day I've been doing this for 25 plus years and it takes a lot of effort and experience to get to that level and I'm sometimes wrong too
but many of my new students we'll see that and they'll say well you know I'm gonna do the same thing and I'm not trying to promote that idea this teaching was to highlight the importance of going from a hard time frame down to a lower time frame using a similar concept that overlaps and dovetails very nicely but I want you to go through your charts and study when there are really good opportunities like this example here for the daily buying below the opening price where does that sit in relationship to with the weekly range and
the monthly range and their respective opening prices because if you study that you will figure out where the highest probability setups are it doesn't mean that you're getting the entry points it just means that you're highlighting the proper stage when these explosive price moves that move directionally biased happen so hopefully you found this teaching insightful and until next time I wish you good luck and good trading