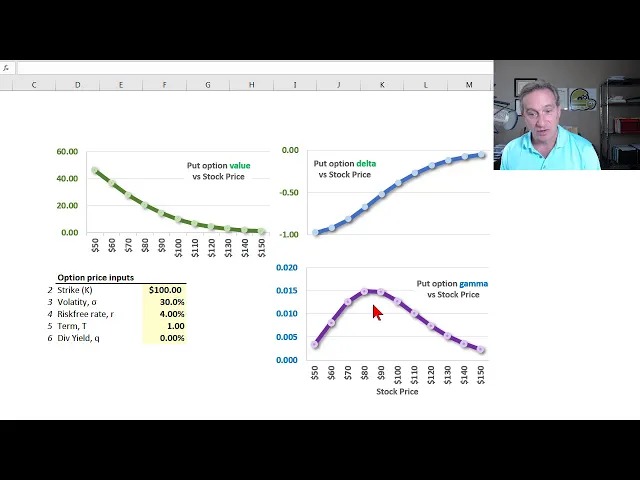
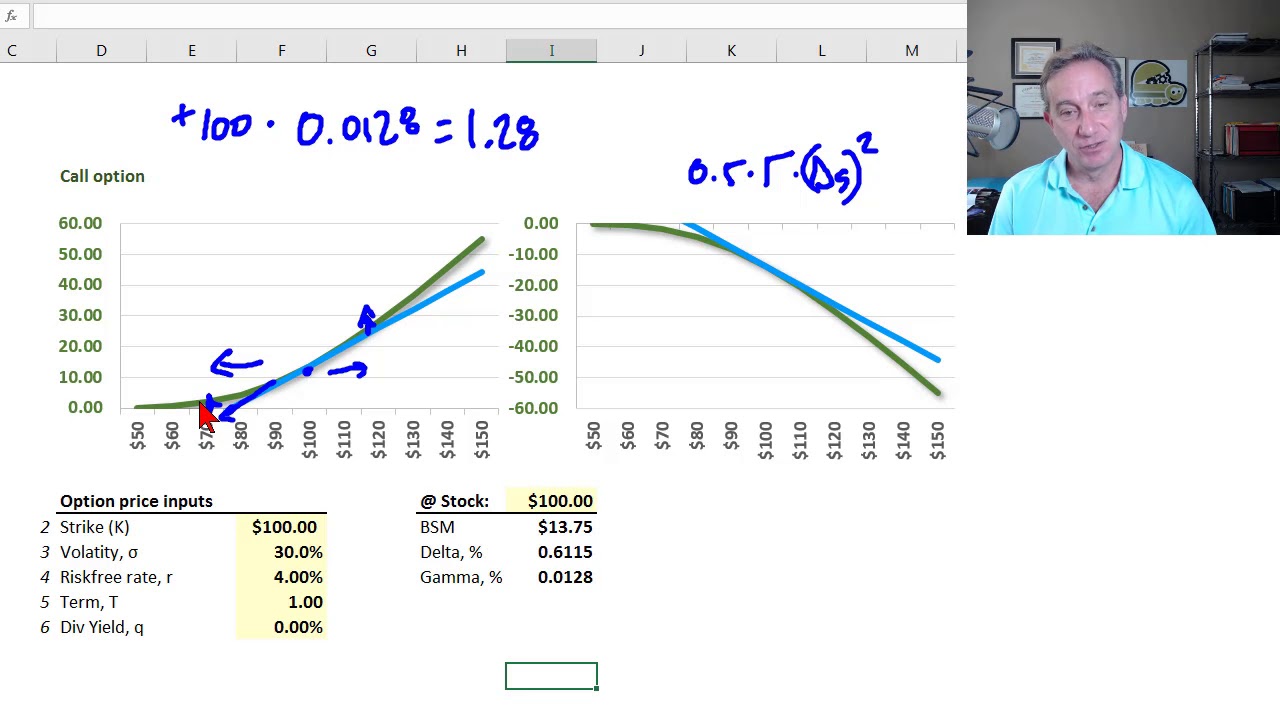
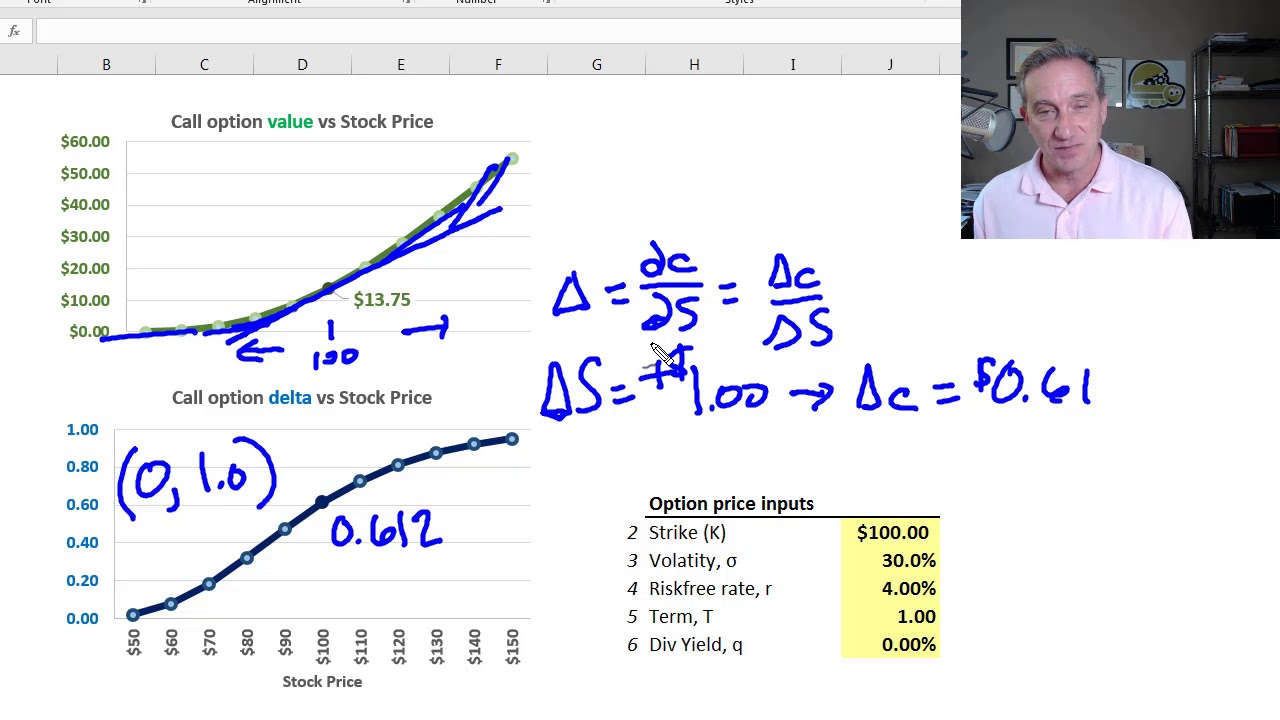
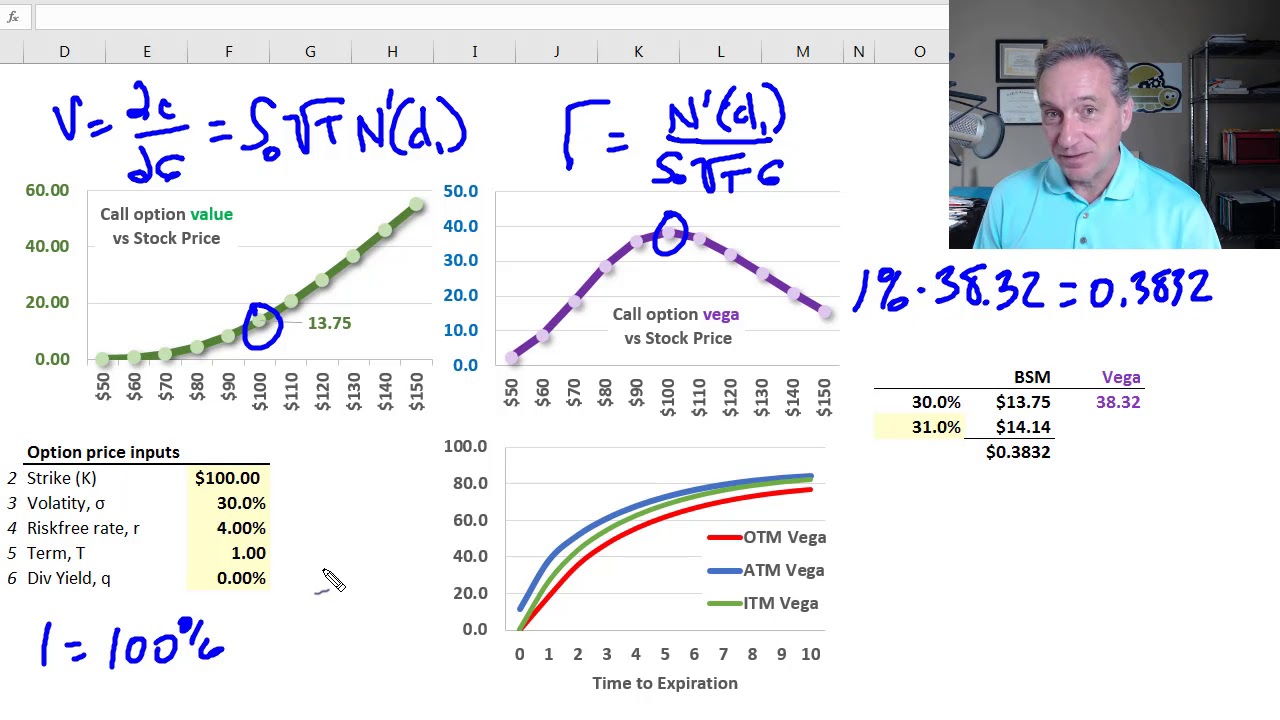
my previous video Illustrated option Delta which is the rate of change of the option value with respect to the stock price and is visualized as the slope of the straight tangent line however when using Delta to estimate the sensitivity the option value to the change in the stock price we're not capturing the gap between that straight line and the actual curvature of this relationship between option value and stock price that curvature almost all of it can be captured by option gamma so option gamma is the rate of change of the Delta when the gamma is high the Delta is changing quickly and a delta hedge is fragile when the gamma is low that is to say when the option is deeply out of the money or deeply in the money gamma approaching 0 the Delta is not changing very quickly and our Delta hedge is more robust in the lower-left I have as usual the input assumptions into my black Scholes option pricing model or five of the six all of them except for the stock price so you can see the strike price is $100 so that's going to apply for the call option on this sheet and also for the put option on the next sheet I assume a volatility of the underlying stock 30% risk-free rate 40% these options have a 1-year term and then they are options on a non dividend paying stock so in the upper left here I plot that very familiar call option value on the y axis against the stock price on the x-axis so for all of these graphs the x-axis is the stock price and that's why it's not explicate adhere as an input assumption and so this call option value for example for the at the money call option that's right here when the stock price is 100 and a strike price is 100 we have an at the money call option when your term you can see the price of that option according to the black Scholes Merton is $13. 75 and then as the stock price goes increase we're in the money on this call option as the stock price decreases we are out of the money and the previous video I said one of the key features of this graph is nonlinear it has this curvature would it be okay to say convexity but because we're talking about options technically we can all call this gamma and we have the gamma measure for this curvature so we look at that call option value move over here to the right then I'm plotting the call option Delta this was the focus of the the previous video in this playlist where I took a deep dive on the option Delta the x-axis here is the stock price and what we have the Delta mathematically is a first partial derivative with respect to the stock price change in the option with respect to the stock price we also said that if you're visual like I'm visual I prefer the visual interpretation then we take the whatever point we're evaluating here we take the tangent line there's a point of tangency the single point where that with this align a straight line intersects with the actual value to price relationship and the slope of that line is the Delta so that's the rate of change here and if I go over to call option Delta where we are at the money stock equals 100 that's a should be an S equals 100 then the call option Delta is point zero point six one two so that's the rate of change of the option value at this point where the stock price is 100 and so it's unit-less and our interpretation is I'll clear this out a little bit the interpretation is very simple if we're here at stock equals 100 it's telling us that if the stock price increases by one dollar we expect the option value to increase by sixty one point two cents or if the stock price drops by one dollar we expect option value to drop by 61 cents and now if we stick with a visual interpretation because the actual option the stock price relationship is nonlinear it has this curvature you'llyou'll you can see it's pretty easy to visually confirm that the slope of this line is changing and we set a key feature of the call option deltas that's bounded at 0 & 1 so that if we go out of the money deeply out of the money here at lower stock prices for example $50 stock price on a $100 strike is $50 out of the money we're deeply out of the money this the slope of the tangent line here is pretty much getting close to 0 so we're bounded at 0 and we on the other hand if we go deeply in the money we're up here at $150 for example $50 in the money as the stock price increases that translates almost directly 1 for 1 to call option value so we have a 45-degree line here a slope of 1 we're bounded at 1 so the fact that this is curved reflects is reflected here in an option Delta that's not a flat line or not constant so if we were to go up 2 if the stock were to go up to $110 then our Delta is reevaluated the Delta is now 0. 72 meaning if the stock price at 110 $110 increases by $1 we expect the option value to increase by 72 cents and so Delta itself is changing and that's the point of gamma gamma is mathematically a second partial derivative with respect to the stock price and more intuitively it's the rate of change of the Delta and so I've plotted it here in purple and I've teased out the specific gamma value at the money here when the stock price is 100 and you can see here the gamma value is low it's point zero one two eight so that's the rate of change of Delta so how can I interpret that well let's take an example where now I'm going to do a pretty dramatic jump in the stock price from 110 to one from 100 to 110 right let's say we do a plus ten dollar jump in the stock price and here the gamma is point zero one two eight well at 100 the Delta is point six one two the gammas giving us the rate of change if the stock price increases by ten dollars then this gamma if we multiply it by ten you can see is point one two eight I'll say 0.
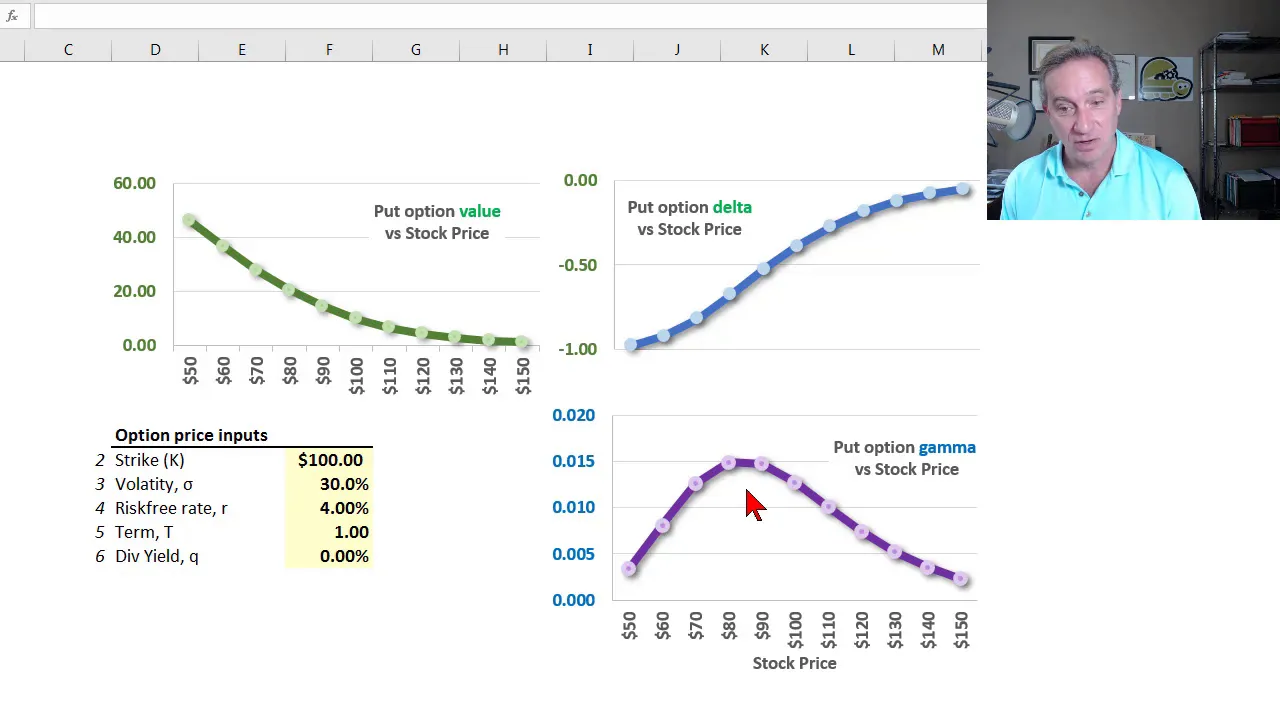
128 $10 jump in the stock price multiplied by the gamma gives us point one two eight what is that that is an estimate for the rate of change of the Delta and you'll notice the Delta here jumps from point six one to two point seven two six and it's pretty close not exact but it's pretty close so gammas give Miss the rate of change of the Delta and you can see here the gamma tends to be highest near at-the-money in my case not exactly actually in my case for my assumptions here these can be changed in the shape of the gamma will change my case it happens to peak not quite at the money but at $80 but we generally have high gamma to reflect the Delta is changing the most when we're here and the gamma is low at actually approaching zero both in the money and out of the money and so you can see visually similar just like we did with the first derivative we come up here to call option Delta as we go deeply out of money and that and the Val option value is not very responsive to stock price change we have a low Delta the Delta also is not changing very much and gamma as the rate of change of Delta is reflected here in a low value of zero and similarly if we're deeply in the money our Delta is approaching one but you can see the slope of this tangent line is getting closer to the slope of this line is actually getting closer to zero but also not changing very much and so that's reflected in a low rate of change of gamma that's approaching zero another way to think about this is the way that we use the gamma is that if we put on a delta hedge and we're here at high gamma the delta hedge is fragile as the stock price moves the high gammas telling us that Delta is changing quickly so we have a more fragile Delta hedge when the gamma is high if we're over here with low gamma it's saying as the stock price moves the deltas not going to shift to much and are dealt to hedge is less fragile or more robust okay so now I'll show you the put/call the put option and I'm going to use the same assumptions here and that means same strike price and same term you might recognize those are the conditions for put-call parity and that's actually going to ensure that my gamma is the same that's great for example canidates this is just met when they make one thing that makes our life easier here if the if the option is put-call parity applies then our gammas are gonna be the same for the put as they are for the call well why would that be well you may or may not recall that put option we the call option Delta now that's on the previous page was n of d1 standard normal cumulative distribution function of the d1 or I just call that short for probability function to remind me might remind us that it's bounded between 0 1 that was for the call Delta and now I'm showing here for the put Delta and it is equal to n of D 1 minus 1 so in terms of the graph all we do here for the put option Delta is we shift it down one unit on the y-axis consequently as as discussed in the previous video the put option is bounded by 0 and negative 1 but in terms of the slope of the tangent line this is the same shape we get the same result put option gammas this is the same here so that very makes that very simple and finally just one more application just to put this in action and now I have hi I've teased out two points here stock price is a hundred is shown right here you can see and stock price at 130 shown right here so I'll just focus on the on the one on the right at 130 if I can get that out okay here at stock price of 130 the black Scholes myrn that's right here about right here is $36. 65 right so we have when the stock price is 130 and a strike of a hundred were $30 in the money intrinsic values 30 so the time value is $6. 65 that's our option price when the stock is 130 if the stock jumps up let's say plus $10 to 140 here I'm just doing a repricing with the black Scholes I get 45 65 and that's plotted right here right $10 increase in stock corresponds to this increase in the option value as I move from this point to this point and that value increase is nine dollars now here I'm doing this is a Taylor series approximation but my point is to use the Delta is to use the gamma that we've just reviewed the change in the stock price here as I go from 130 to 140 is $10 and so I can take the $10 multiply it by that Delta at 130 and that Delta happens to be 0.
87 right we're getting close to 1 and so if I just rely on Delta in other words visually to just rely on Delta is to just rely on the straight line approximation as I go plus $10 so I'll go in a straight line but there's I'm gonna leave that little gap and tit so that's very simple $10 times my Delta the eight dollars and seventy seven cents tells us that this is the predicted jump in the option value when the stock price jumps by $10 right just along the straight line it's telling us eight dollars and seventy seven cents but that's the linear approximation it's leaving out the curvature as reflected in the gamma I can use the gamma I can bring it back in with the Taylor series and I've shown that formula here all I do but let me get it out is I've got my gamma value at 1:30 and to get the adjustment by applying that Taylor series I just use oops plus 0. 5 times the gamma that's my gamma symbol not very good times the change in stock price squared that's one of that's the term in the Taylor series approximation so that's all I did here to get the 0. 26 you can see this formula right up here it is 1/2 multiplied by gamma multiplied by the $10 change squared that gives me point to 6 that's how I capture this gap that the Delta linear approximation isn't getting the curvature it's 0.